

Industry: Government and Public Sector
Product: ModelRisk
Application: Urban development planning under uncertainty
The Point Estimate Says Reject the 12,000-Home Program — the Distribution Says It Has $138M of Upside
A growing city was asked to approve a 12,000-home growth program: ten years of build-out, a 25-year fiscal window, and a question every municipality faces — does new growth pay for itself? New households expand the property-tax base, but they also draw schools, roads, policing and utilities. The finance team's deterministic model returned a clean verdict: present-value tax revenue of $540M, present-value service cost of $479M, less $110M of enabling capital, for a net fiscal impact of –$49M. Reject. Rebuilt in ModelRisk, the same program showed a 33% chance of being net-fiscally-positive and a P90 outcome of +$138M — a right tail of genuine upside the single number had erased. The point estimate was not just imprecise; it pointed at the wrong decision.
Why a point estimate fails on a fiscal cost-benefit
A net-fiscal figure is a difference of two large, uncertain, correlated quantities — tax revenue and service cost — accrued over 25 years. The deterministic model assumes one absorption pace, one assessed-value path and one cost-per-resident, and reports the gap between the resulting revenue and cost lines. But the gap between two ~$500M present values is exquisitely sensitive to assumptions that are themselves uncertain, and a single subtraction tells you nothing about the chance the gap lands the other side of zero. Worse, it ignores the co-movement between the two legs — the very thing that determines how wide the net outcome can swing.
Where the fiscal outcome actually lives
The model builds the program year by year. Each year's planned homes are absorbed at a rate drawn from a Beta distribution (bounded in 0–1, as an occupancy fraction must be), and only occupied homes generate the $6.2k/home/yr in tax and draw the $2.2k/person/yr in services (×2.5 persons per home). Revenue and cost are discounted at 4% over the 25-year window; the $110M of enabling capital (net of developer contributions) is sunk up front.
The driver that ties it all together is a shared market-cycle regime: one LogNormal draw per trial (centred at 1.0, sigma 0.22) that simultaneously sets that trial's absorption pace and lifts its per-home assessed values. A strong-market decade fills homes quickly and raises their taxable value together; a weak decade stalls both. This is the dependence a point estimate cannot represent, and it has a surprising consequence. Because high occupancy (more cost) coincides with high values (more revenue), PV revenue and PV cost correlate at 0.89 — and that positive correlation acts as a natural fiscal hedge. The net outcome's standard deviation is $124M, versus the $239M it would be if the two legs moved independently — the correlation narrows the net spread by 48%. A model that treated revenue and cost as independent would over-state the risk by almost double.
The resulting net fiscal impact runs mean –$25M, P10 –$155M, P50 –$51M, and P90 +$138M.
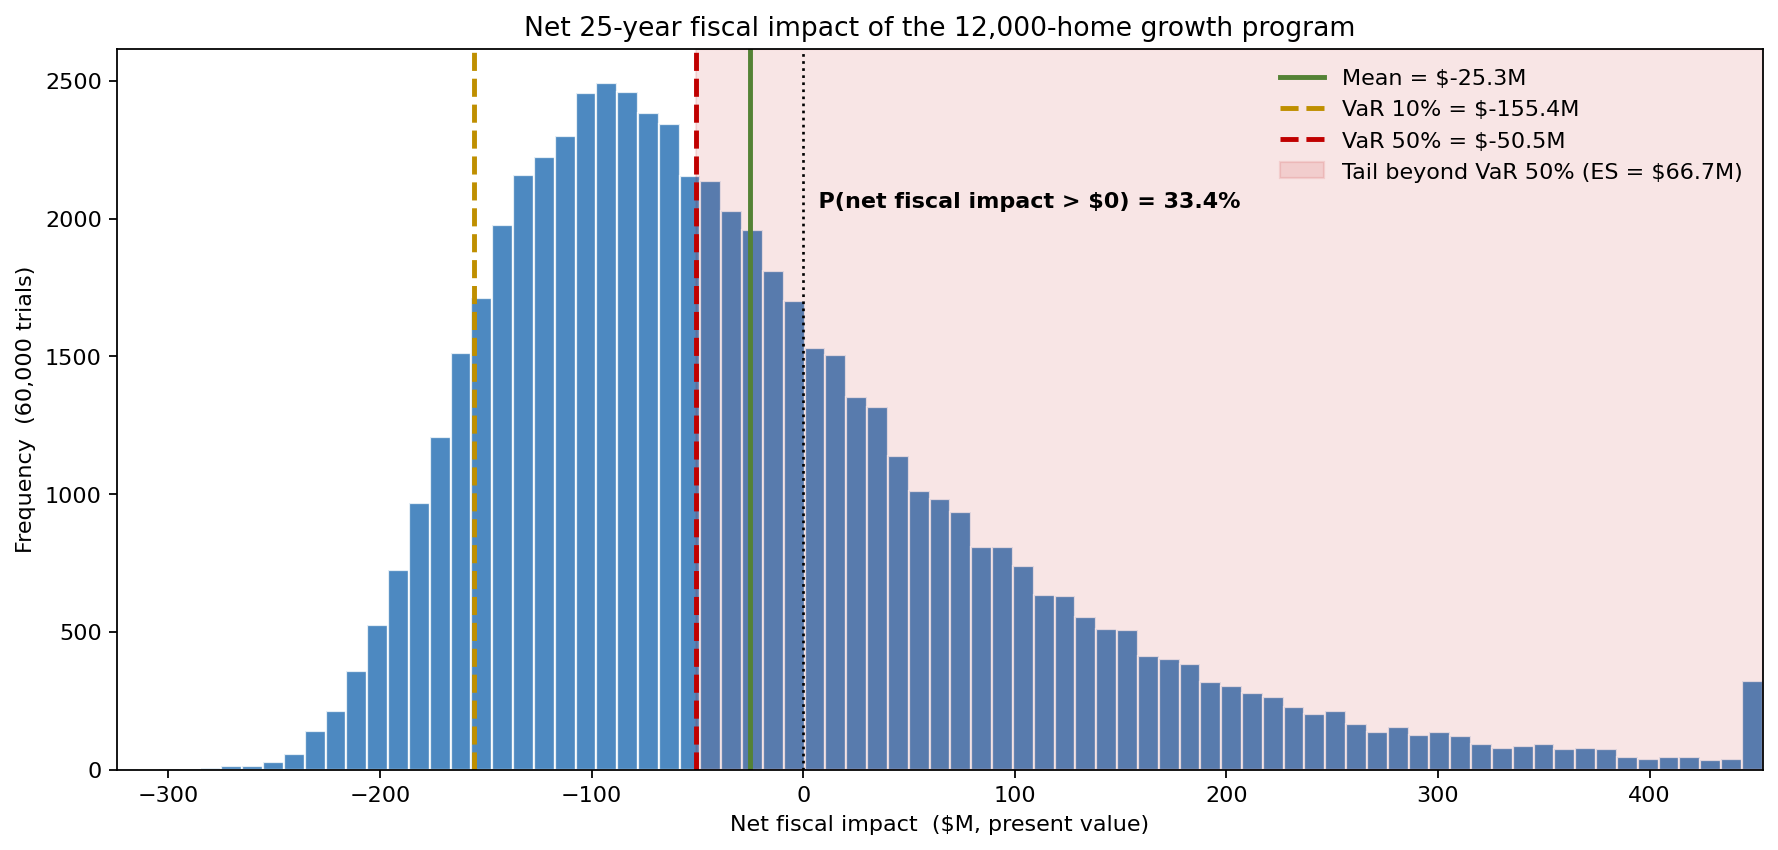
Note the gap between the deterministic –$49M and the simulated mean of –$25M: the right-skew from the LogNormal value uplift adds upside the centre-point calculation discards. The probability of a net-positive outcome is 33%, the probability of a net loss 67%, and the worst 5% of futures average –$199M. That is a far richer brief for a council than "reject" — it is a one-in-three chance of a fiscal win against a quantified, bounded downside.
The fiscal hedge, seen directly
The 0.89 revenue–cost correlation is the analytical heart of the case, so it is worth seeing rather than asserting.
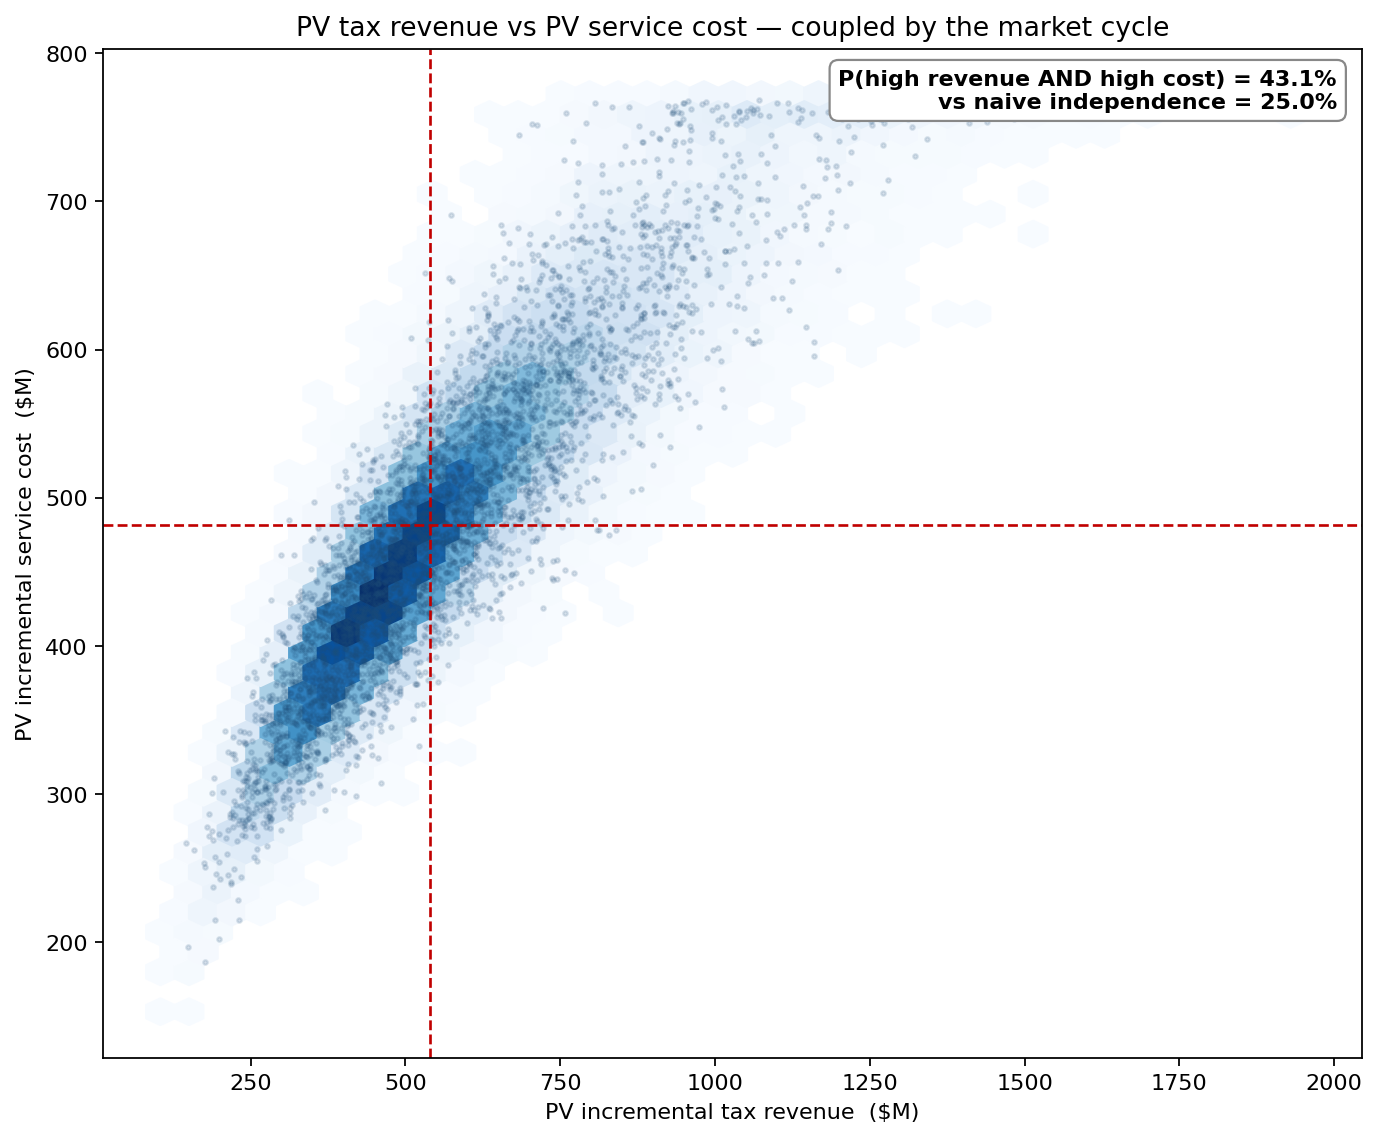
The cloud runs along the diagonal: high-revenue futures are also high-cost futures. The probability of landing in the high-revenue-and-high-cost quadrant is 43%, against the 25% a naive independence assumption predicts. For the council this is reassuring, not alarming — the years that cost the most to service are the years generating the most tax to pay for it. The program's downside is therefore tighter than either leg's volatility would suggest, and a risk assessment built on independent revenue and cost lines would have priced in a phantom risk.
Does absorption pace rescue it?
The obvious lever is occupancy: sell the homes faster and the tax base arrives sooner. Sweeping the absorption pace tests how far that argument carries.
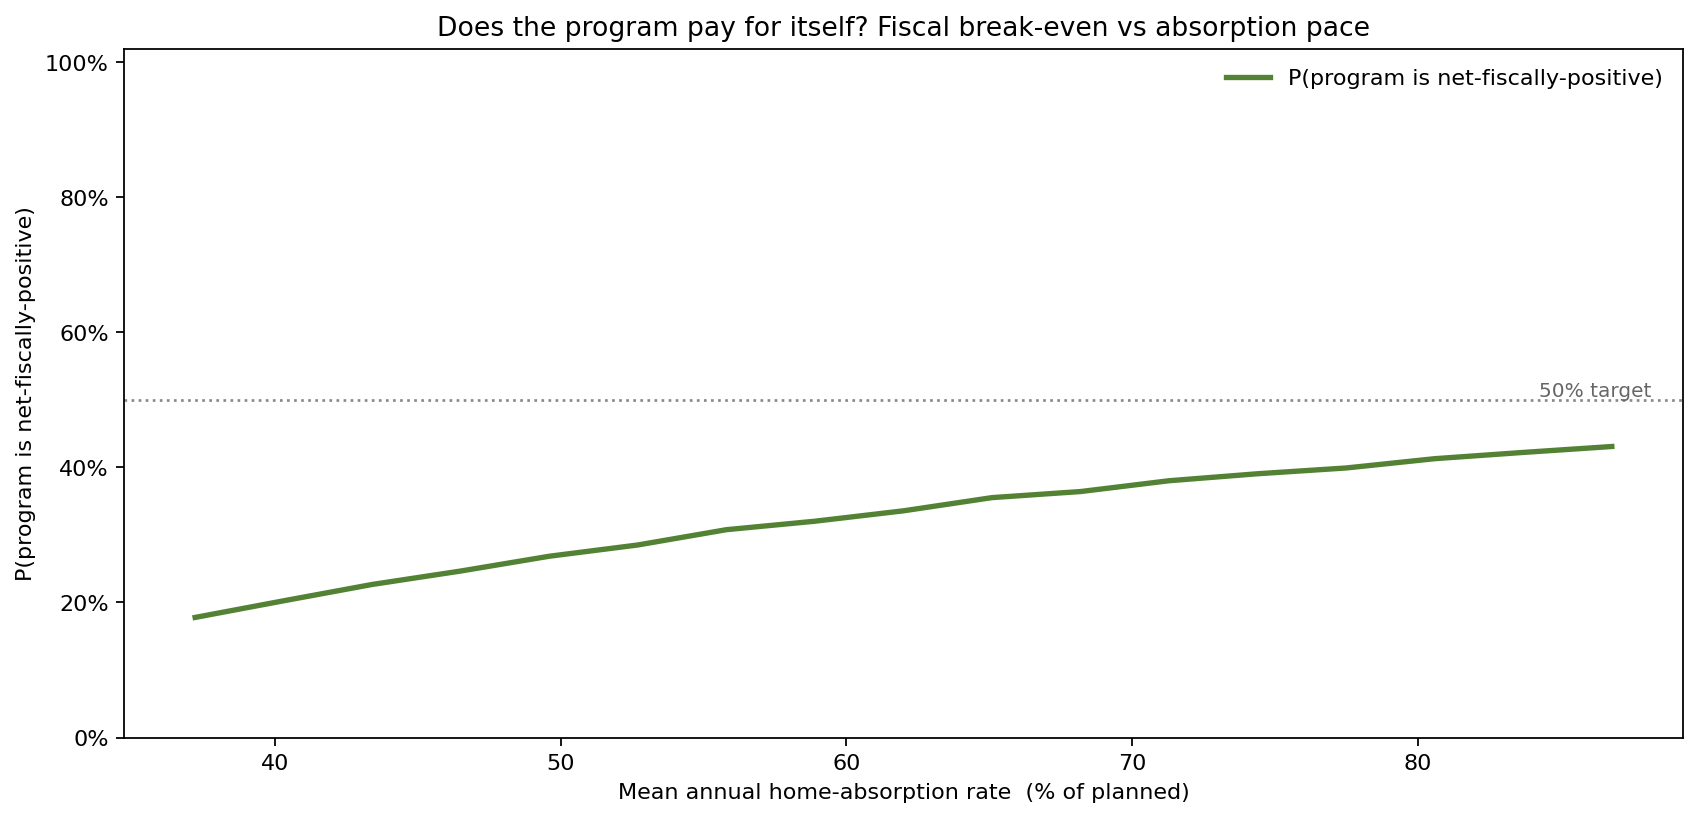
Faster absorption helps — P(net-positive) rises from 18% at a slow ~37% annual pace to 43% at a fast ~87% pace — but it never crosses 50%. Even in the best occupancy scenarios the program remains more likely than not to be net-negative, because every new occupied home brings service cost as well as revenue. The honest reading is that absorption pace alone cannot make this program a safe fiscal bet; the lever that matters is the per-home unit economics, which the tornado confirms.
What actually drives the net fiscal impact
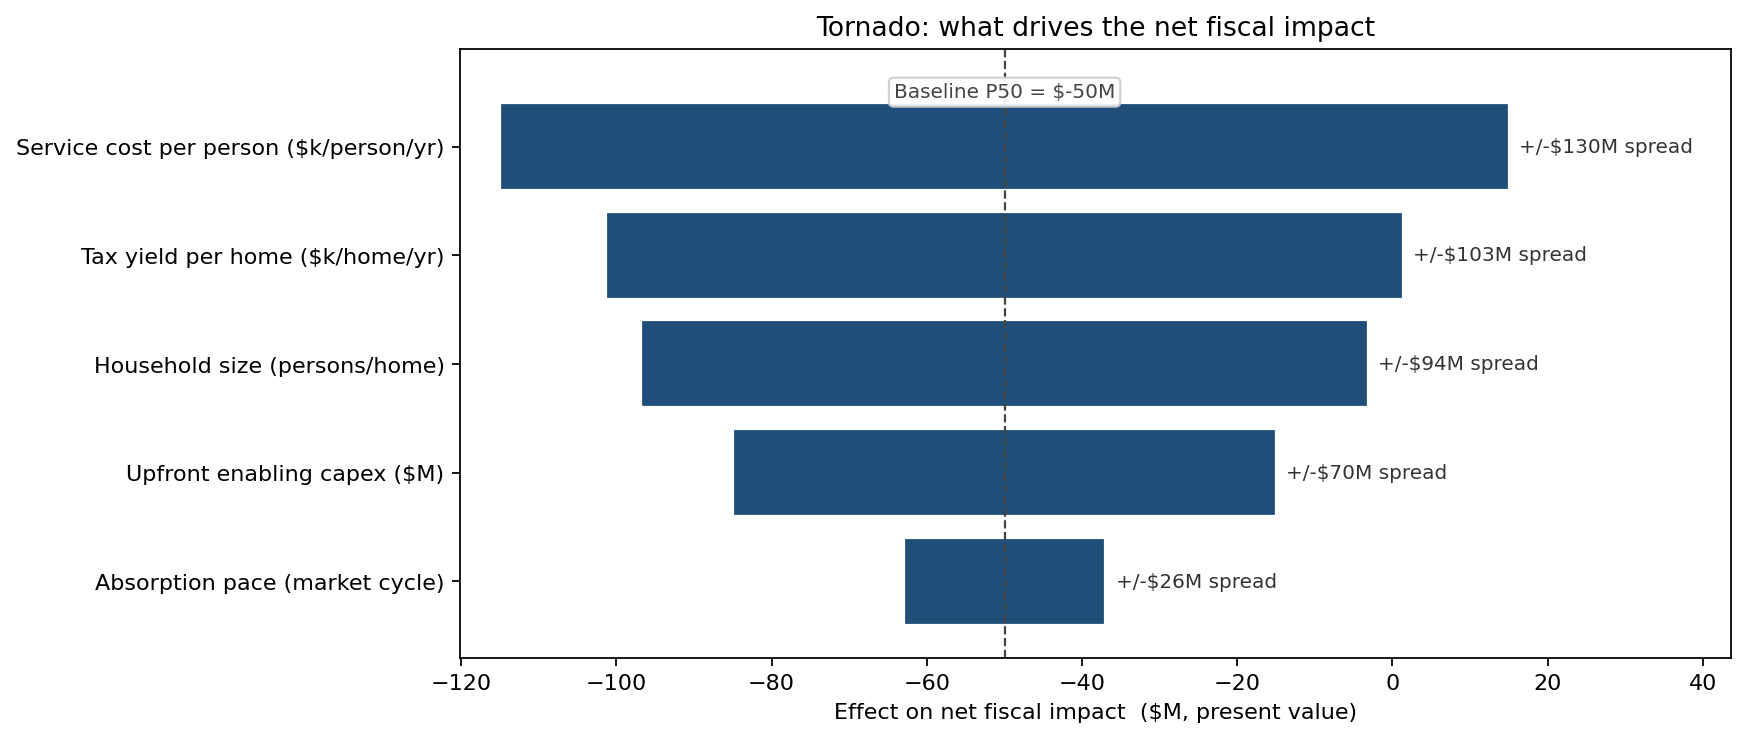
The ranking is decisive. Service cost per resident is the largest mover (±$65M across its plausible range), followed by tax yield per home (±$51M) and household size (±$47M, because it multiplies the per-resident service cost). Upfront capex (±$35M) and absorption pace (±$13M) trail well behind. The implication reframes the council's negotiating strategy: the program's fiscal fate is decided less by how fast the homes sell than by what kind of homes they are — their tax yield, their occupancy density, and the marginal cost of serving them. Those are levers the city controls through zoning, density and impact-fee policy, not just through market timing.
What the model changed
- The program was not rejected on the point estimate. Faced with a 33% chance of a net fiscal win, a P90 of +$138M and a bounded worst-5% of –$199M, the council moved the decision from go/no-go to "how do we shift the distribution right?"
- Policy targeted unit economics, not absorption. Because the tornado put service cost and tax yield ahead of absorption pace, negotiations focused on density mix and impact fees — the inputs that move the per-home margin — rather than on subsidising faster sell-through.
- Risk was priced without the phantom volatility. Recognising the 0.89 revenue–cost hedge cut the modelled net standard deviation from $239M to $124M, so the contingency reserve attached to the program was sized to the true spread rather than to an independence assumption that nearly doubled it.
ModelRisk Functionality Used
- Shared market-cycle regime — one LogNormal draw per trial coupling absorption pace and assessed value, producing the 0.89 PV-revenue/PV-cost correlation that an independent-legs model misses.
- Beta absorption with year-by-year accrual — occupancy modelled as a bounded fraction so revenue and cost build only on homes actually occupied, across the full 10-year build-out and 25-year fiscal window.
- Net-fiscal distribution — the headline output (mean –$25M, P10 –$155M, P90 +$138M, 33% net-positive) that converted a deterministic "reject" into a quantified one-in-three upside case.
- Joint-density and correlation analysis — visualising the revenue–cost hedge (43% joint high-high quadrant vs 25% under independence) and re-sizing the contingency reserve from a $239M independent spread to the true $124M.
- Absorption sweep and tornado — proving absorption pace alone caps P(net-positive) at 43%, and ranking service cost, tax yield and household size as the true drivers, which redirected policy toward density and impact-fee levers.
For municipal growth decisions, "does it pay for itself?" is not a yes or a no — it is a probability with a shape. ModelRisk turns a deterministic rejection into the question worth asking: what is the cheapest policy that moves a one-in-three fiscal win to a two-in-three?