

Industry: Government and Public Sector
Product: ModelRisk
Application: Public safety
A $6.5M Violence-Prevention Program — With a One-in-Five Chance of No Cut at All
A city is funding a $6.5M-a-year violence-prevention and hotspot-policing program across twelve precincts. The pilot estimated a 12% reduction in incidents, and the budget memo runs that figure straight through: 12% of roughly 12,000 annual incidents is about 1,400 fewer, at a tidy cost per incident averted. The number that wins the appropriation is a single multiplication.
The trouble is that both inputs are uncertain, and incident counts are anything but well-behaved. Simulating the program 60,000 times against an over-dispersed baseline, the expected reduction holds at about 1,310 incidents averted per year — but the spread is enormous. The 10th-percentile outcome is 839 incidents worse than baseline; the 90th is 3,881 averted. The program has only a 78.4% chance of averting any incidents at all, a 21.6% chance of backfiring in a given year on the raw count, and just a 60.6% chance of delivering the "meaningful" 8% reduction that justifies its cost.
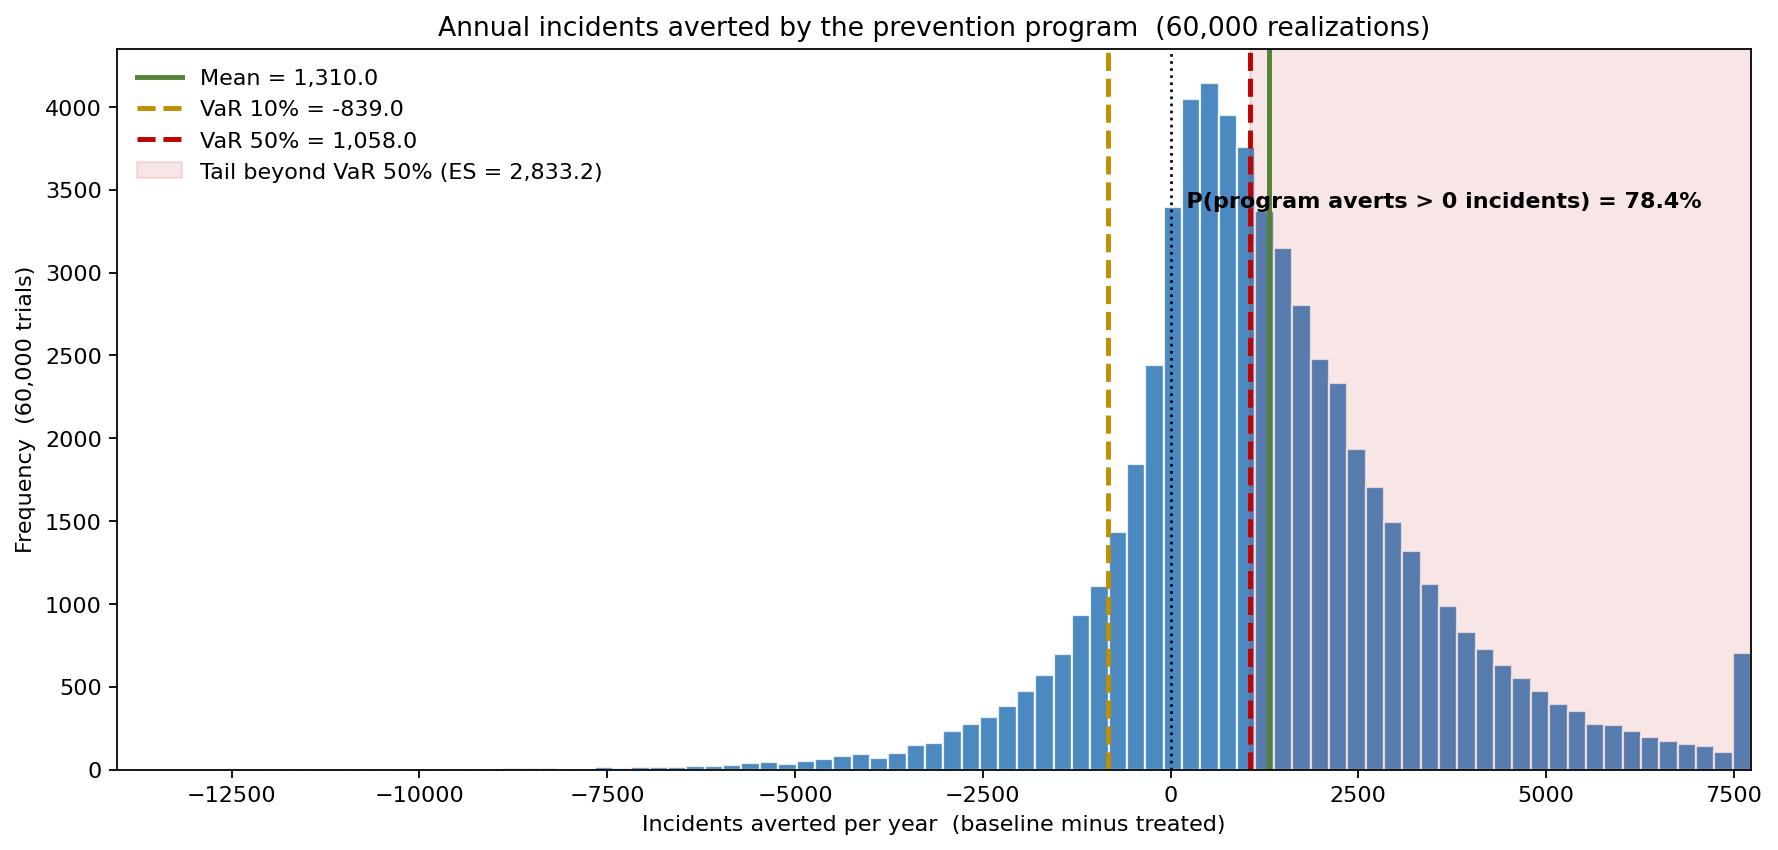
A municipal public-safety office rebuilt its program-evaluation case in ModelRisk after a previous initiative was declared a failure on one bad year's count — a verdict the underlying noise could easily have produced regardless of the program's true effect. The mandate: separate the signal of the intervention from the noise of incident counts, and attach a probability to "did it work?"
Why a point estimate fails
Multiplying a single effect size by a single baseline ignores the two things that actually determine whether a year's data will look like success:
- Incident counts are over-dispersed. Crime clusters — by season, by contagion, by a single bad summer. A shared annual "city-climate" factor (modeled Gamma) lifts every precinct's rate together, so the baseline annual count has a mean near 12,000 but a 90th percentile above 21,000. That year-to-year swing can swamp a real 12% effect.
- The effect size is itself a distribution. The true proportional reduction is uncertain (modeled on the log-rate-ratio with a Normal), spanning a strong cut, a negligible one, and the genuine possibility of no effect or a small backfire. The pilot's 12% is the center of a wide belief, not a fact.
- A point estimate cannot express the failure risk. "1,400 averted" hides that one realization in five shows the program apparently increasing the count — purely because a bad-climate year overwhelms the intervention.
The model uses a paired draw: the same shared latent rate underlies the baseline and treated arms, so the before/after difference isolates the program rather than the luck of the year, with the rate reduced by the uncertain effect in the treated arm.
What the program does to the count distribution
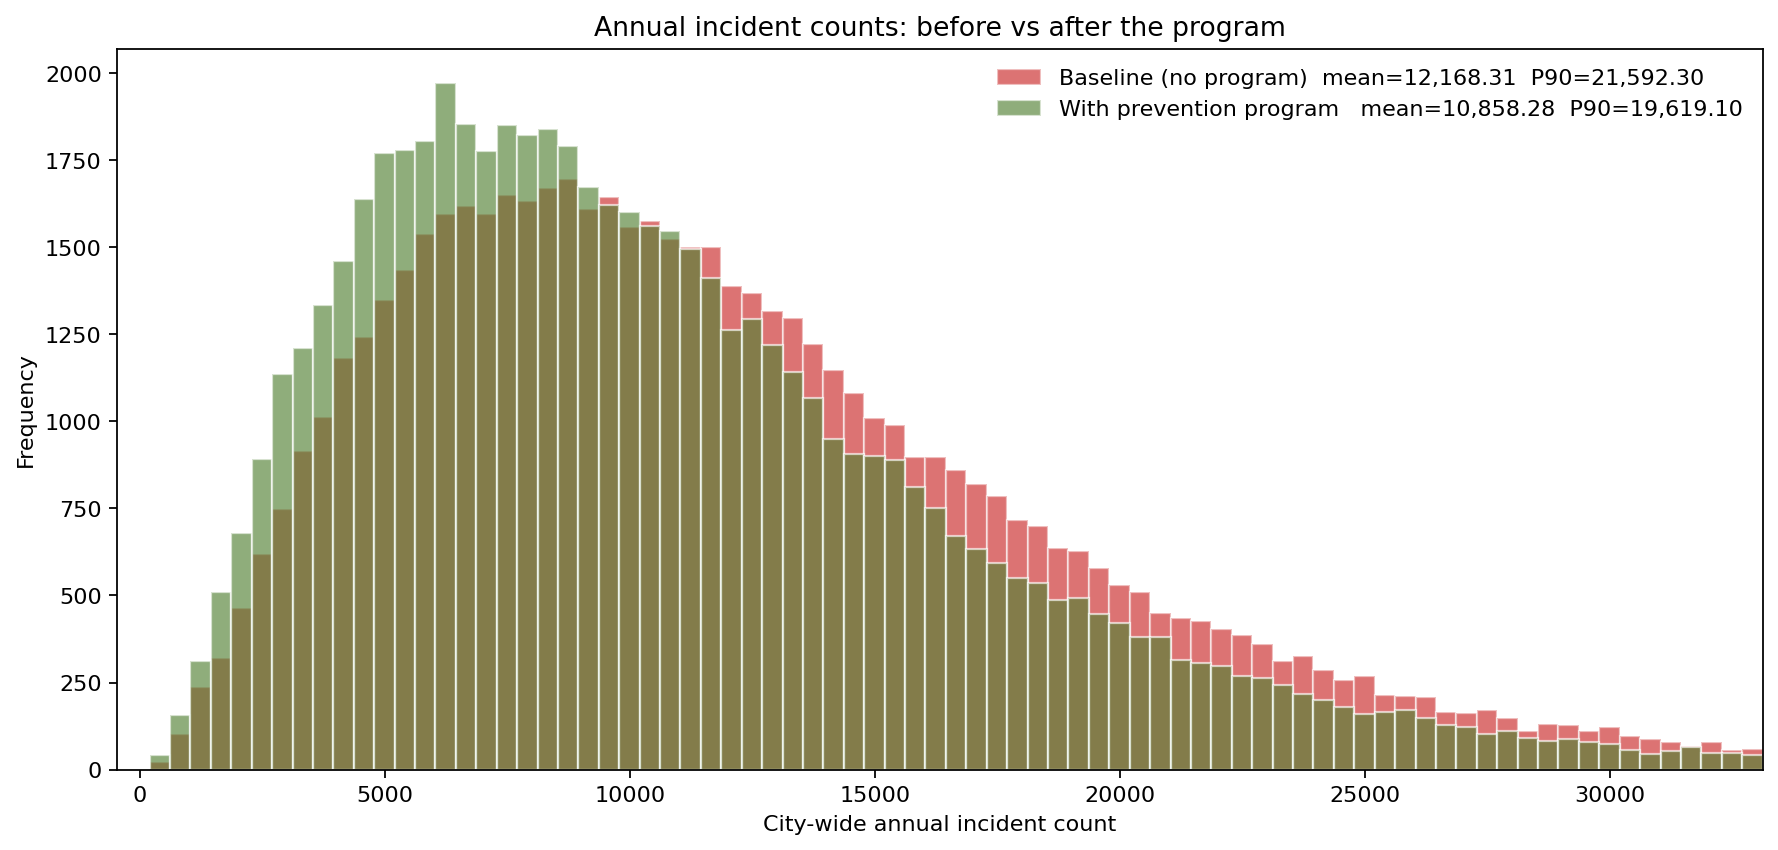
Laid side by side, the baseline and treated count distributions overlap heavily. The baseline averages 12,168 incidents (P90 = 21,592); with the program the mean falls to 10,858 (P90 = 19,619) — a mean shift of about 1,310 incidents. The shift is real and in the right direction, but it is small relative to the width of either distribution. That overlap is precisely why a single year's count is a poor verdict on the program: a good-climate baseline year can post a lower count than a bad-climate treated year, and the over-dispersion, not the intervention, decides which.
How big must the true effect be to be worth it?
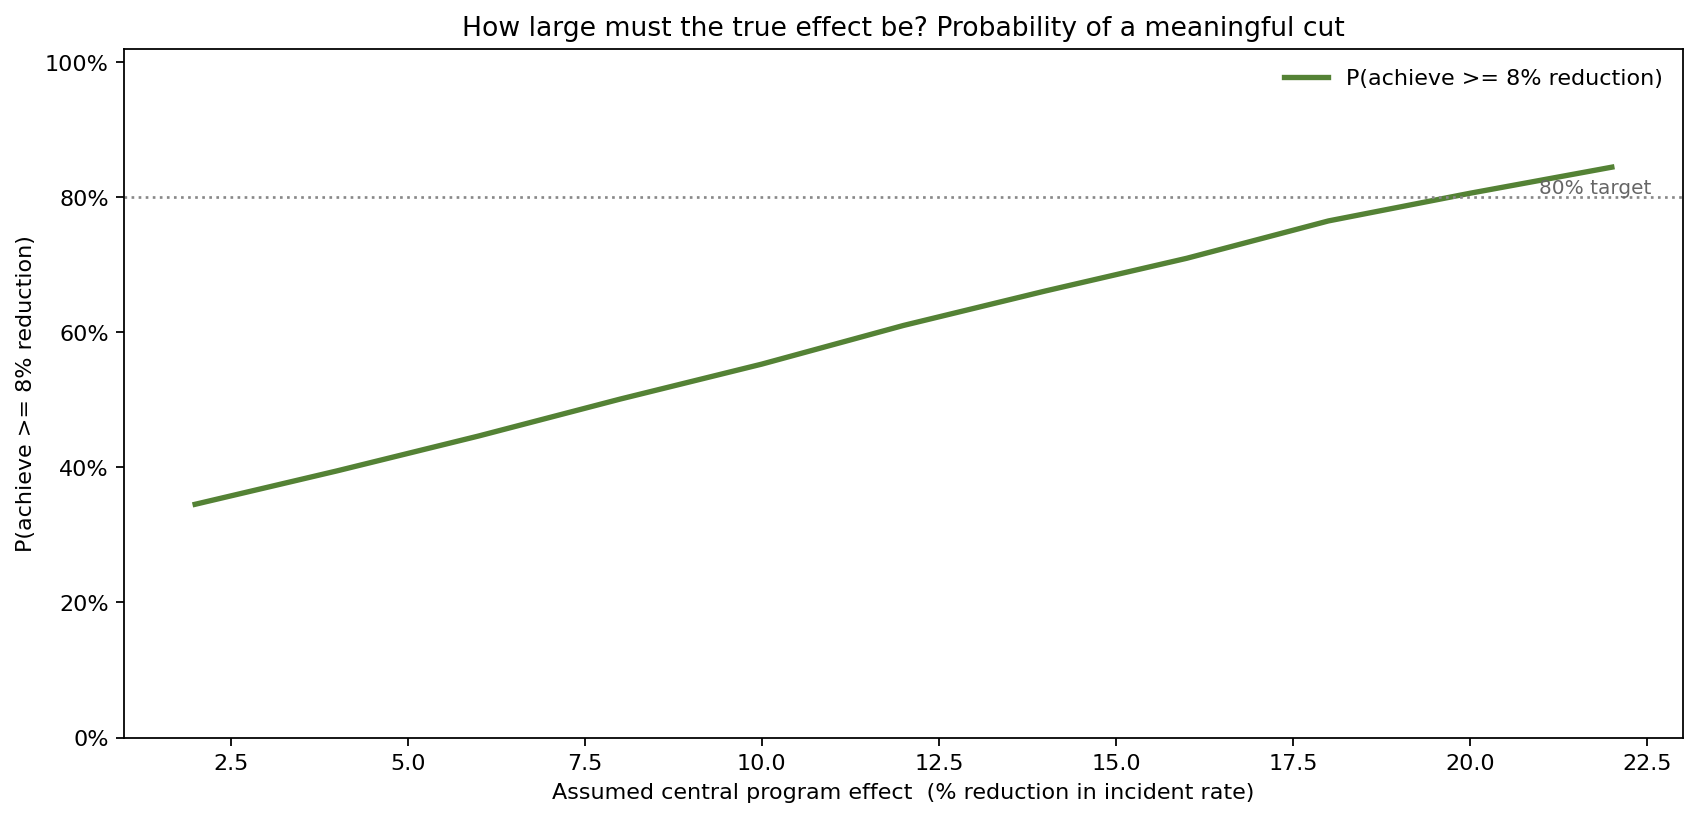
Sweeping the assumed central effect size turns the value question into a threshold. At the pilot's 12% central effect, the probability of achieving a meaningful (8% or greater) reduction is 61% — better than even, but a long way from confident. To reach an 80% probability of a meaningful cut, the true central effect must be about 20%. The median cost per incident averted falls in step: from roughly $4,250 at a 12% effect to about $3,160 at 20%. This is the honest brief for the appropriations committee — not "the program cuts incidents 12%," but "if the program is as good as the pilot suggested, it clears the value bar three years in five; to clear it four years in five it would need to be substantially stronger."
What drives the uncertainty in incidents averted
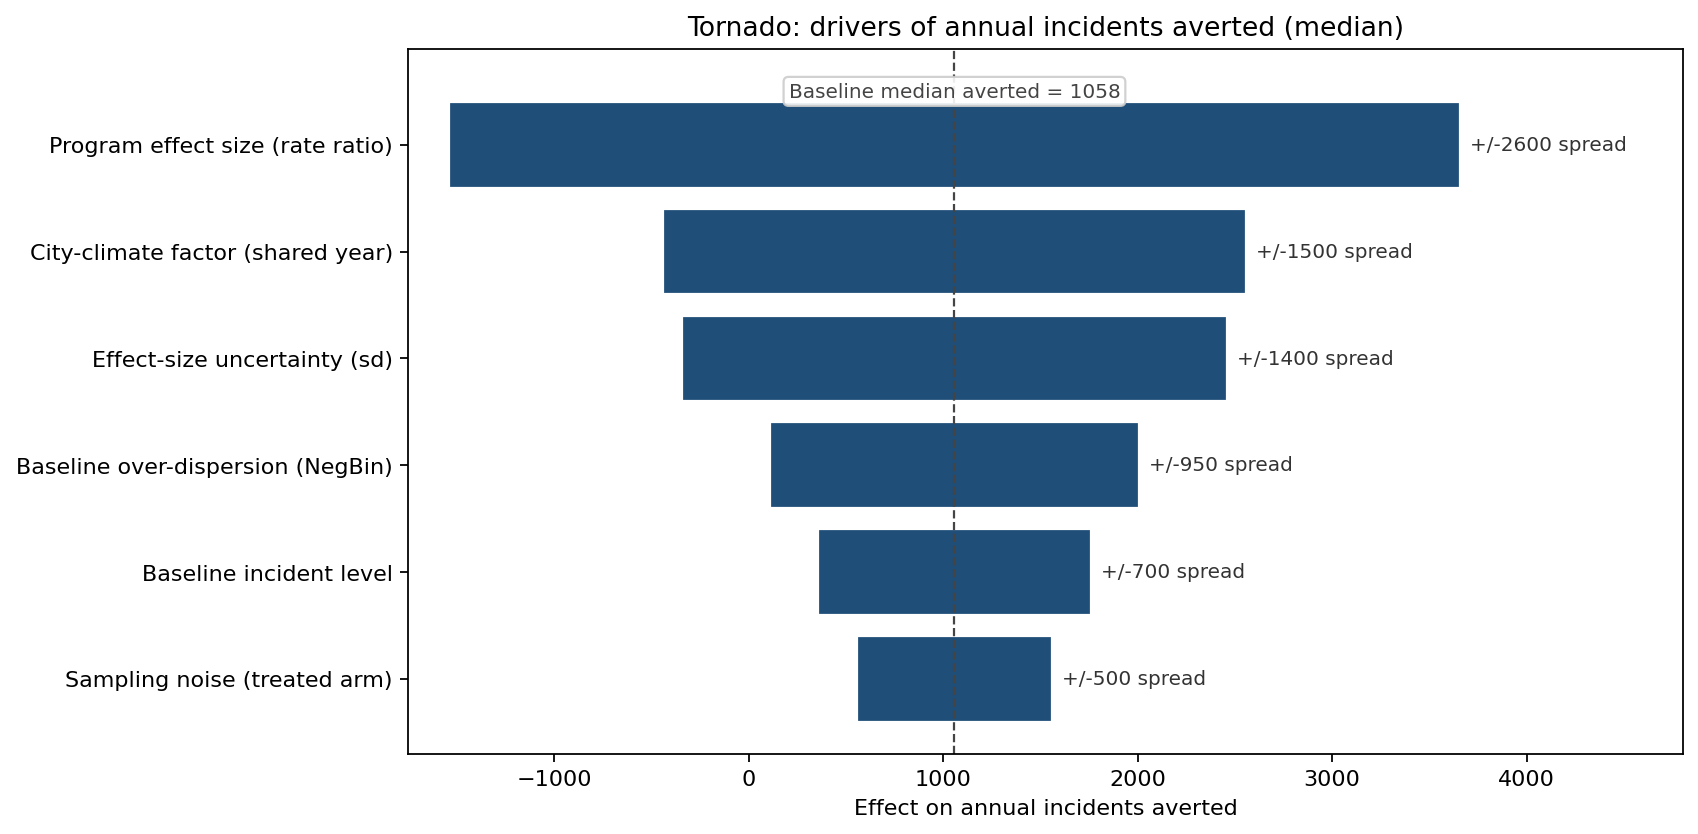
Around the median of about 1,060 incidents averted, the dominant driver is the program effect size itself — its central value and its uncertainty band together account for most of the spread. The shared city-climate factor is the next-largest contributor, followed by the baseline over-dispersion. The ranking is the research agenda: the single most valuable next investment is not more program spend but a better estimate of the effect size — a stronger evaluation design (staggered rollout, matched controls) that narrows the effect distribution and converts the program's 61% success probability into a defensible number.
What the model changed
- The program was funded with an explicit success probability attached — a 61% chance of a meaningful reduction at the pilot's effect size — rather than a deterministic "1,400 fewer incidents" the data could not have supported.
- A staggered-rollout evaluation was built into the design so the effect size (the top driver) is estimated against matched controls, narrowing the band that dominates the tornado.
- The "did it work?" review was redefined around the distribution, not one year's count — protecting the program from being killed by a single bad-climate year that the over-dispersion makes likely.
- The value case was reframed as a threshold: the committee was shown that an 80% confidence of a meaningful cut requires a ~20% true effect, setting an honest bar for continued funding.
ModelRisk functionality used
- Monte Carlo simulation of 60,000 program-years with an over-dispersed (Gamma-Poisson) baseline and a paired treated arm, isolating the program effect from year-to-year climate.
- A distribution on the effect size (log-rate-ratio Normal) capturing the real chance of a strong cut, a negligible one, or a backfire.
- Before/after count distributions showing the overlap that makes a single year's count an unreliable verdict.
- Effect-size sweep producing the probability-of-meaningful-reduction curve and the cost-per-incident-averted threshold directly from one engine.
- Tornado sensitivity ranking effect-size uncertainty above program spend, redirecting the next investment toward a stronger evaluation design.
A prevention program judged on one number, against one year's count, is a program set up to be praised or condemned by chance. ModelRisk is what shows the appropriations committee the truth: a worthwhile bet with a 61% chance of clearly working — and a clear path to making that number bigger.