

Industry: Government and Public Sector
Product: ModelRisk
Application: Public health policy planning under uncertainty
A Point Estimate Said 421 Beds Would Cope. The Simulation Found a 27% Chance of Overrunning 850.
A regional public-health agency planning for a respiratory season in a 2,000,000-person catchment ran the standard calculation: take the expected attack rate, the expected hospitalisation rate, the expected peak-day share, multiply through, and you get a peak inpatient census of about 421 beds. The region has 850 staffed acute respiratory beds. On that arithmetic the surge "fits comfortably," with room to spare.
The Monte Carlo rebuild in ModelRisk told a different story. The median season does peak around 546 beds — close enough to the point estimate to be reassuring — but the 90th-percentile season peaks at 1,347 beds and the 99th at 2,560. The probability that peak census exceeds the 850-bed capacity is 27.4%. Roughly one season in four overruns the entire region's staffed respiratory capacity, and the deterministic number gave no hint of it.
Why a point estimate fails here
Plugging mean inputs into a multiplicative burden model gives the mean of the inputs, not the mean of the output — and certainly not its tail. Seasonal burden is a product of several skewed, positively-coupled quantities: transmissibility, the susceptible fraction, severity, how peaked the admission curve is, and length of stay. Multiply skewed factors and the result is heavily right-skewed, so the mean sits well above the median and the upper tail runs far past anything the central estimate suggests. A hospital network sized to "421 beds, comfortably under 850" is sized for a season that, in the model, essentially never happens at the tail that actually breaks the system.
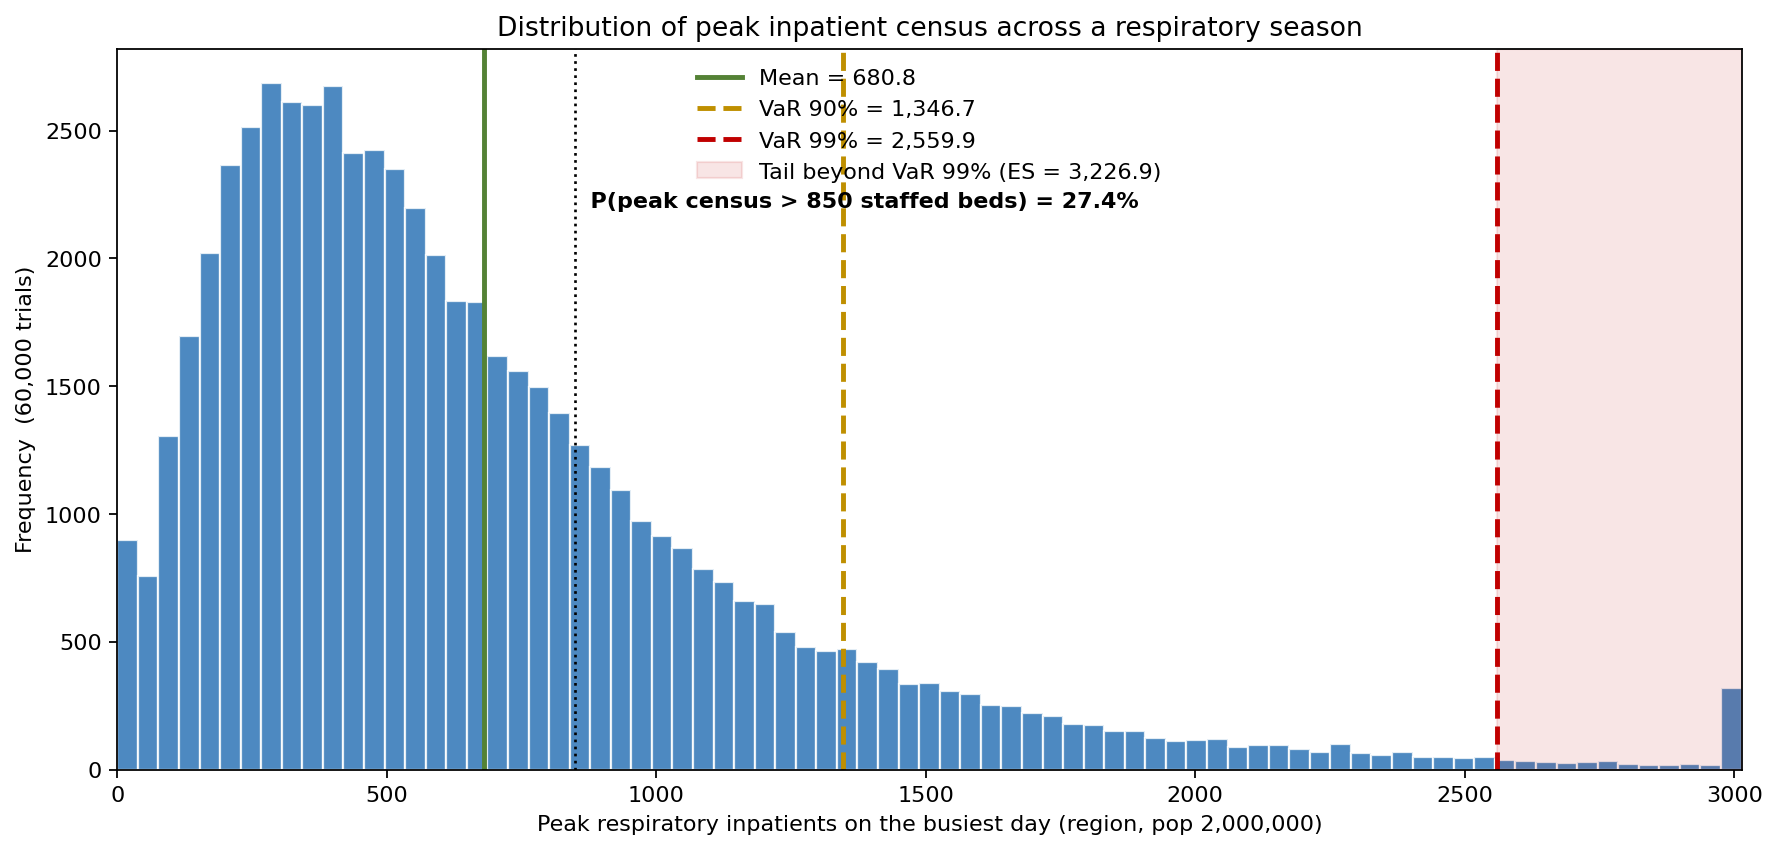
The headline chart shows the full distribution of peak inpatient census. The mean is 717 beds, the 90th percentile (marked VaR 90%) is 1,347, and the 99th percentile is 2,560. The black dotted line is the 850-bed capacity; 27.4% of the distribution sits to its right. In the worst 1% of modelled seasons the expected peak census is about 3,227 beds — nearly four times capacity. Surge planning has to answer "how bad is the bad season," and only the distribution can.
Building the season, not a single curve
The model is population-level epidemiology, and its most important design choice is a season common factor: one shared severity-and-spread multiplier drawn once per simulated season and applied across the whole region. Without it, summing many independent local outbreaks would average out by the central limit theorem and collapse the regional total toward a near-deterministic number — exactly the false confidence the agency was trying to escape. The common factor makes a bad season bad everywhere at once: high transmission and high severity arrive together, which is what real influenza-type seasons do.
On top of that shared climate:
- Transmissibility is a LogNormal R₀ centred near 1.45, feeding the Kermack–McKendrick final-size relation
z = 1 − exp(−R₀·z)to convert transmissibility into a region-wide attack fraction. - Susceptible fraction is Beta with mean ≈ 0.70 — only part of the region is non-immune each year.
- Hospitalisation per infection is Beta (mean ≈ 0.9%), bounded on [0, 1] so it can never produce a negative or above-one severity, and lifted by the same season factor.
- Peak-day admission share (Beta, ≈ 2%/day) and length of stay (LogNormal, ≈ 5 days) translate the season's total admissions into the census on the single busiest day.
Region-wide infections run from 357,000 at P10 to 1,057,000 at P90 (median 726,000); hospitalisations from 2,387 to 11,310 (median 5,894). Every count is non-negative and every probability stays in range by construction.
Surge risk against capacity
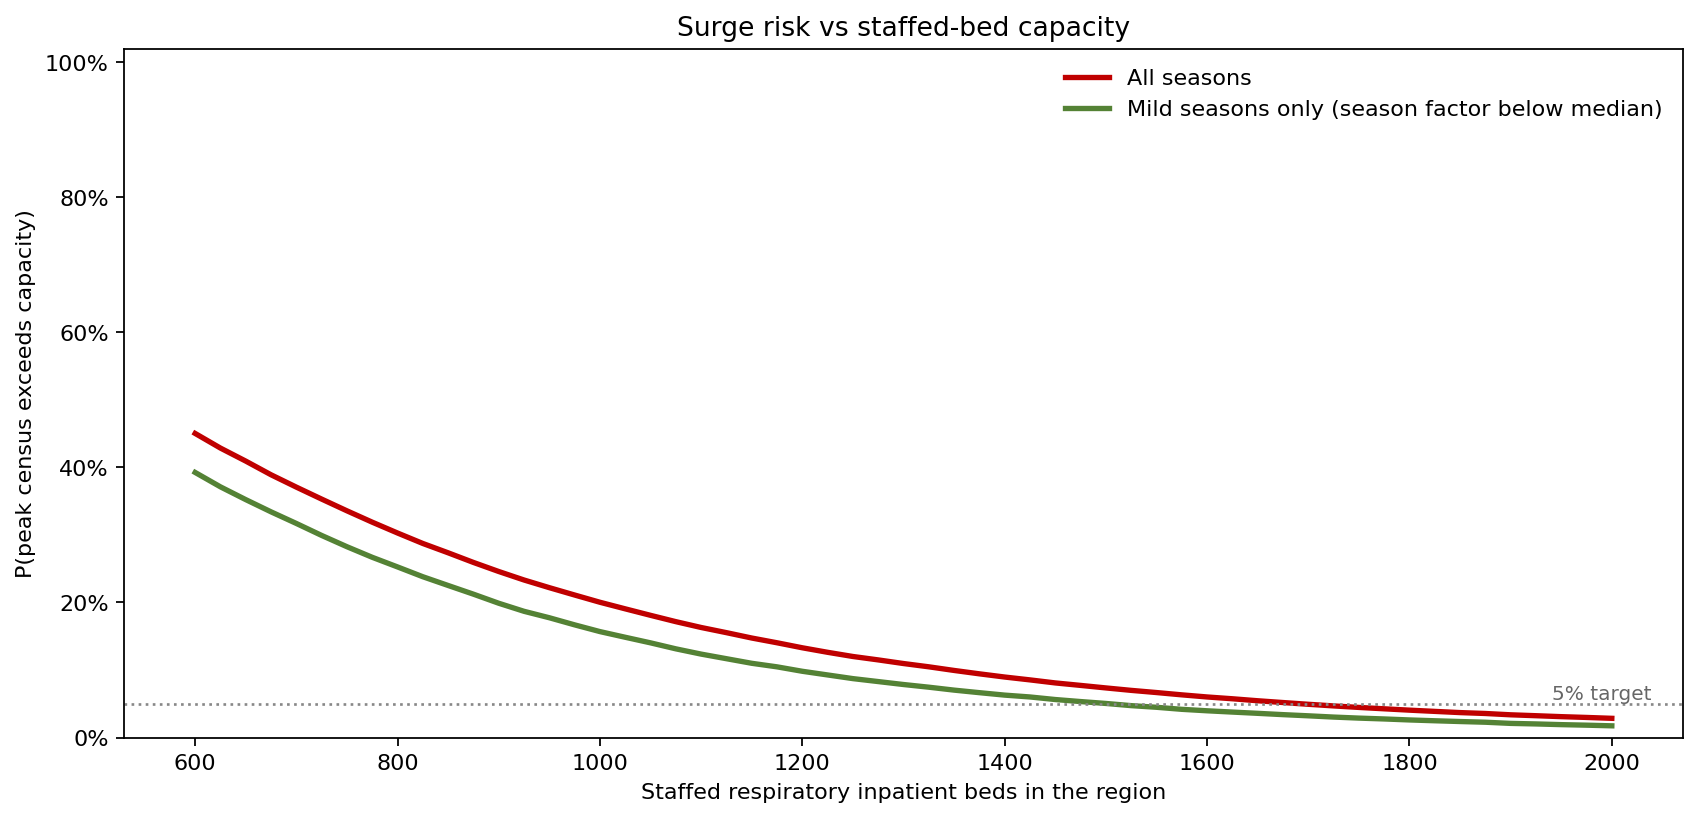
The capacity sweep reframes the question from "what is the peak?" to "how many beds buy what level of protection?" At the current 850 beds the exceedance probability is 27.4%. To hold the probability of overrunning capacity at or below 5%, the region needs about 1,700 staffed beds across all seasons. If the agency could somehow rule out the worst half of seasons (the "mild seasons only" curve, conditioning on a below-median season factor), 1,525 beds would suffice — but it cannot rule them out in advance, which is the point. The 5% target line is unreachable anywhere near the current establishment; the gap between 850 and 1,700 is the true scale of the surge-resilience problem.
A bad season is bad everywhere
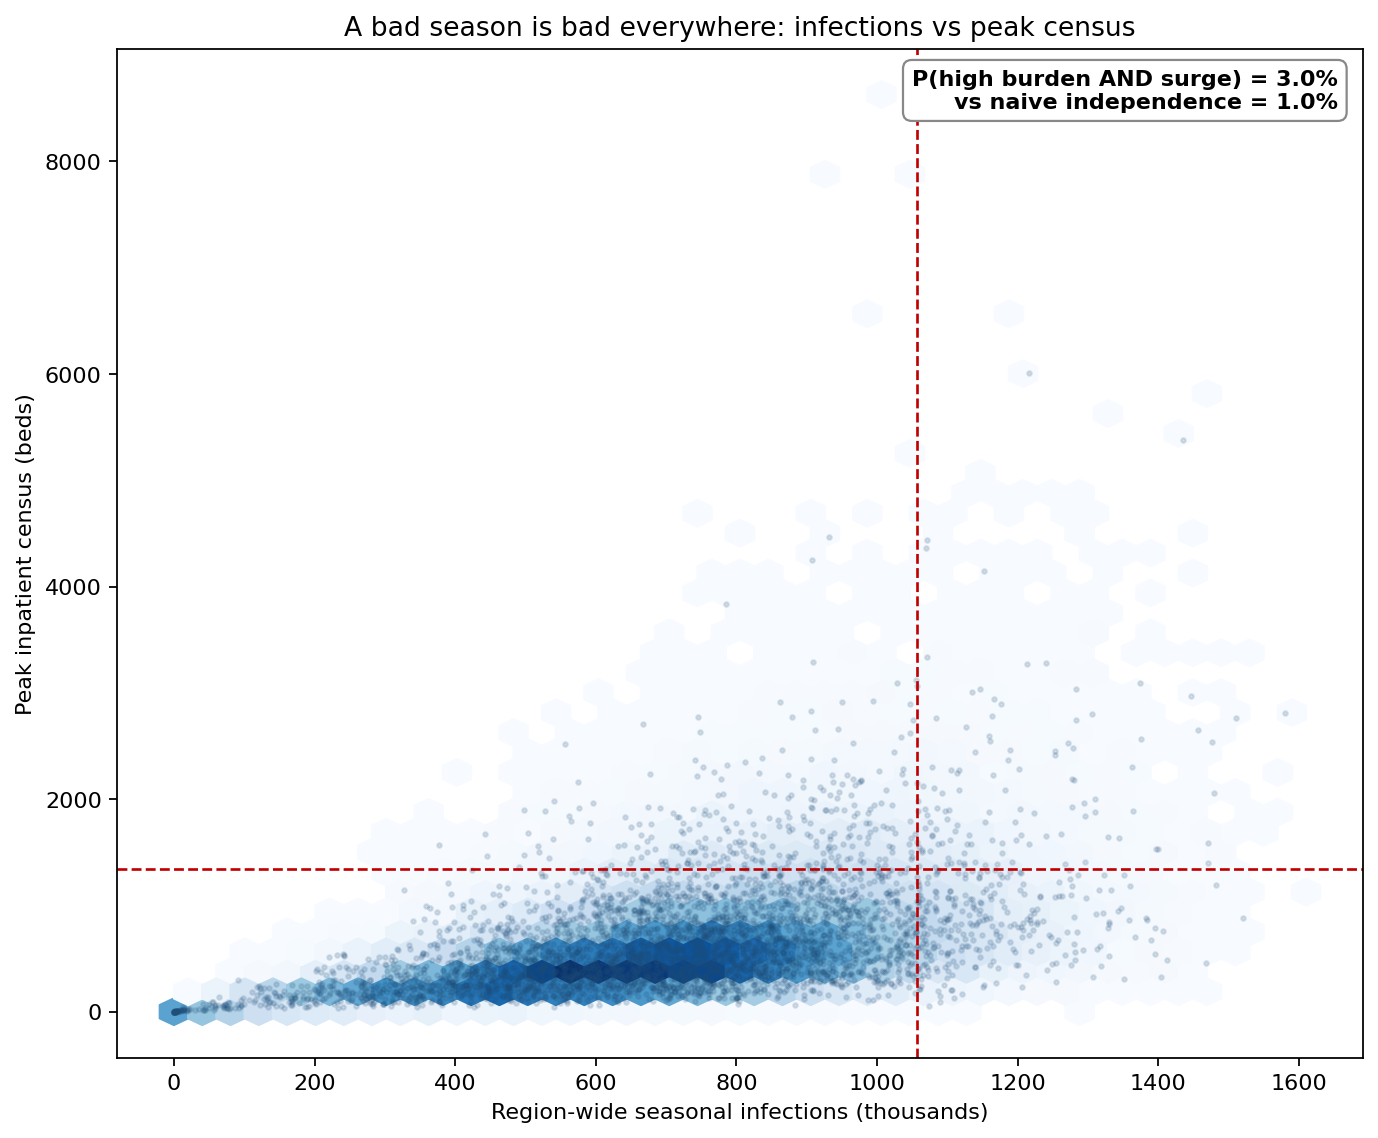
This joint view is the season common factor made visible. Infections and peak census are correlated at 0.50 — not independent. The probability of landing in the top decile of both burden and surge simultaneously is 3.0%, three times the 1.0% a naive independence assumption would predict. Planning that treats "a lot of infections" and "a bad hospital surge" as separate risks underestimates the joint tail by a factor of three; the worst seasons bring both at once.
What the model changed
- Surge planning moved from the mean to the 90th percentile. The agency now sizes contingency against the P90 peak of 1,347 beds, not the 421-bed point estimate or even the 546-bed median.
- The capacity gap was quantified. Reaching a 5%-or-better exceedance target requires roughly 1,700 staffed respiratory beds versus the current 850 — the difference being mutual-aid agreements, surge wards and step-down protocols rather than 850 new physical beds.
- Joint-tail risk was costed. Because burden and surge co-move (correlation 0.50, joint-decile probability 3.0% vs 1.0% under independence), the agency stopped budgeting outbreak response and hospital surge as independent reserves.
- Surveillance priorities were set by the tornado below, which ranked which input estimates actually move the peak.
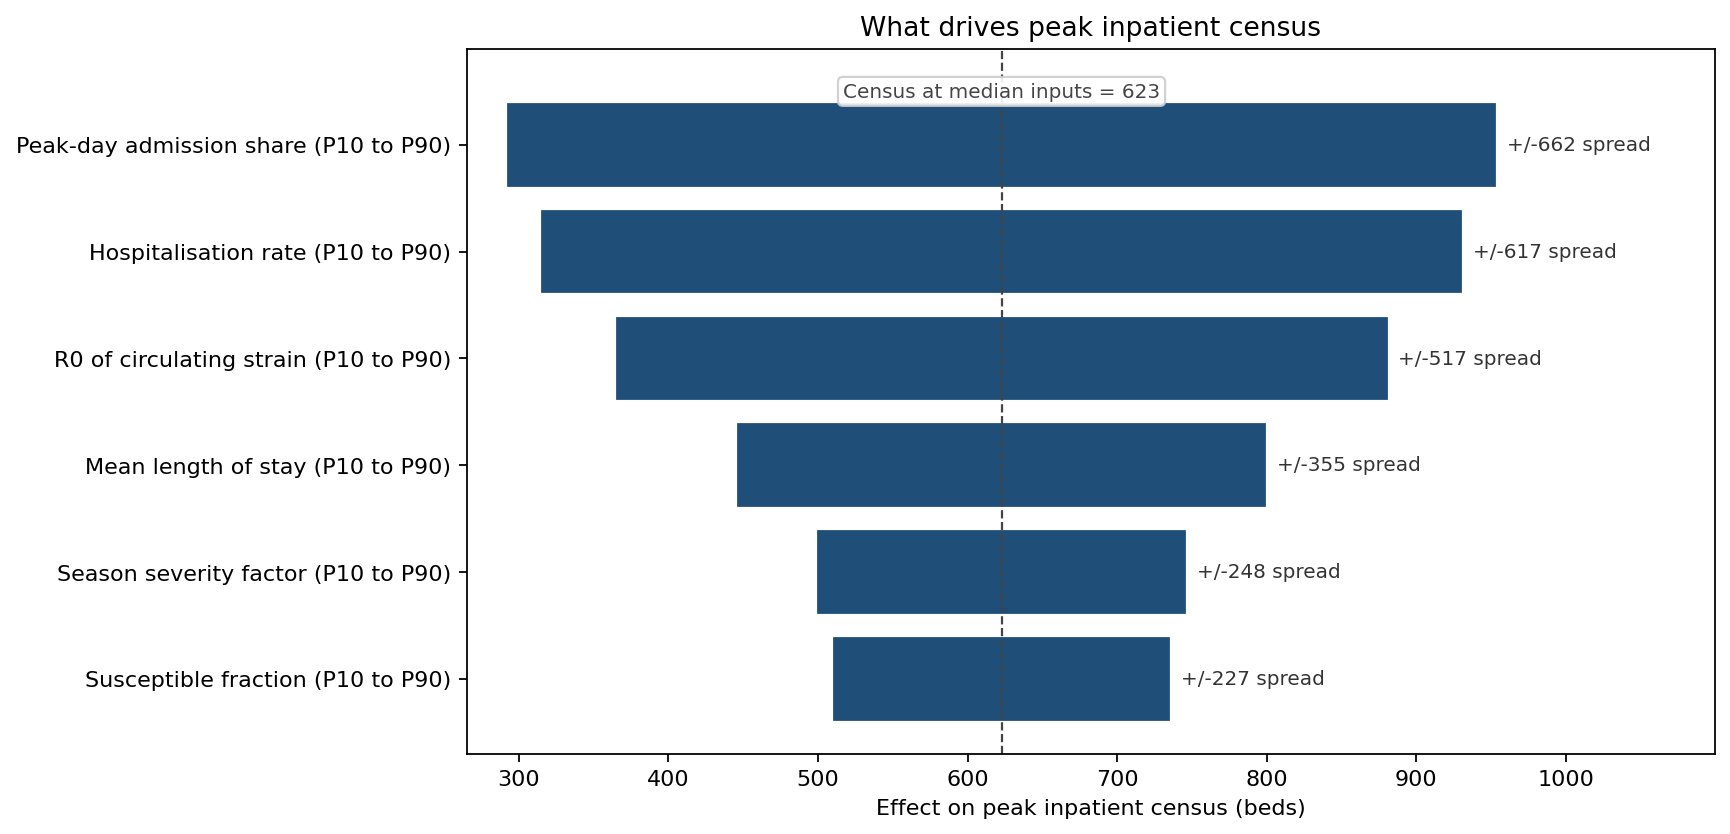
Swinging each input across its P10–P90 range, R₀ of the circulating strain moves peak census by about ±259 beds, the peak-day admission share by ±312, and the hospitalisation rate by ±308 — the three dominant levers. Length of stay (±177), the season factor's residual effect (±124) and susceptible fraction (±107) follow. The briefing line: early-season estimates of transmissibility and per-case severity are worth more than any other data refinement for predicting the height of the surge.
ModelRisk functionality used
- A season common factor (LogNormal, shared per simulated year) that couples spread and severity across the whole region — the single design choice that keeps the regional burden distribution wide instead of collapsing to a deterministic mean.
- Kermack–McKendrick final-size relation solved per iteration to turn a LogNormal R₀ into a region-wide attack fraction, rather than assuming a fixed attack rate.
- Beta priors for every probability (susceptible fraction, hospitalisation rate, peak-day share) so no draw can fall outside [0, 1] — a Normal here would silently admit negative severities.
- A 60,000-trial peak-census distribution quoting mean 717, P90 1,347, P99 2,560 and a 27.4% probability of exceeding the 850-bed standard.
- A capacity sweep computing exceedance probability across bed counts from 600 to 2,000, locating the ~1,700-bed level needed for 5% protection.
- A joint-density chart quantifying that the top-decile-of-both probability (3.0%) is triple the independence prediction (1.0%).
The peak-census point estimate is one number; the public-health decision is the shape of its upper tail. Monte Carlo simulation in ModelRisk is what turns "the surge should fit" into "there is a 27% chance it does not, and here is the bed count that fixes it."