

Industry: Government and Public Sector
Product: ModelRisk
Application: Public health policy
The Central-Case ICER Was $14,362 per QALY. The Full Distribution Said the Programme Clears the $20,000 Threshold Only 58% of the Time.
A national health agency was deciding whether to fund a universal adult respiratory-vaccination programme covering 3,000,000 people. The economics team produced the figure committees expect: a central-case incremental cost-effectiveness ratio of $14,362 per quality-adjusted life year (QALY). Against a willingness-to-pay (WTP) threshold of $20,000/QALY, that is a clear "fund it" — comfortably under the bar, apparently good value.
The ModelRisk rebuild kept the same structure but treated every uncertain input as a distribution. The result reframed the decision. The median ICER is $16,312/QALY and the mean is $21,549 — already above the $20,000 line. The probability the programme is actually cost-effective is 58% at $20,000/QALY and 74% at $30,000/QALY. There is an 11% chance it is outright cost-saving (negative ICER), and a roughly one-in-four chance it fails even the more generous $30,000 threshold. The single ratio hid a coin-flip-plus decision.
Why a point estimate fails here
An ICER is a ratio of two uncertain quantities — incremental cost over incremental QALYs — and ratios are treacherous. Plugging central values into numerator and denominator gives one ratio; it tells you nothing about how often the true ratio lands on the wrong side of the threshold. Worse, the numerator can change sign: in a heavy respiratory season the programme averts so much treatment cost that it becomes cost-saving, while in a mild season delivery cost dominates and the ratio balloons. A point estimate cannot represent "11% cost-saving, 26% above the $30,000 bar" — yet that spread is exactly what a funding committee needs to weigh.
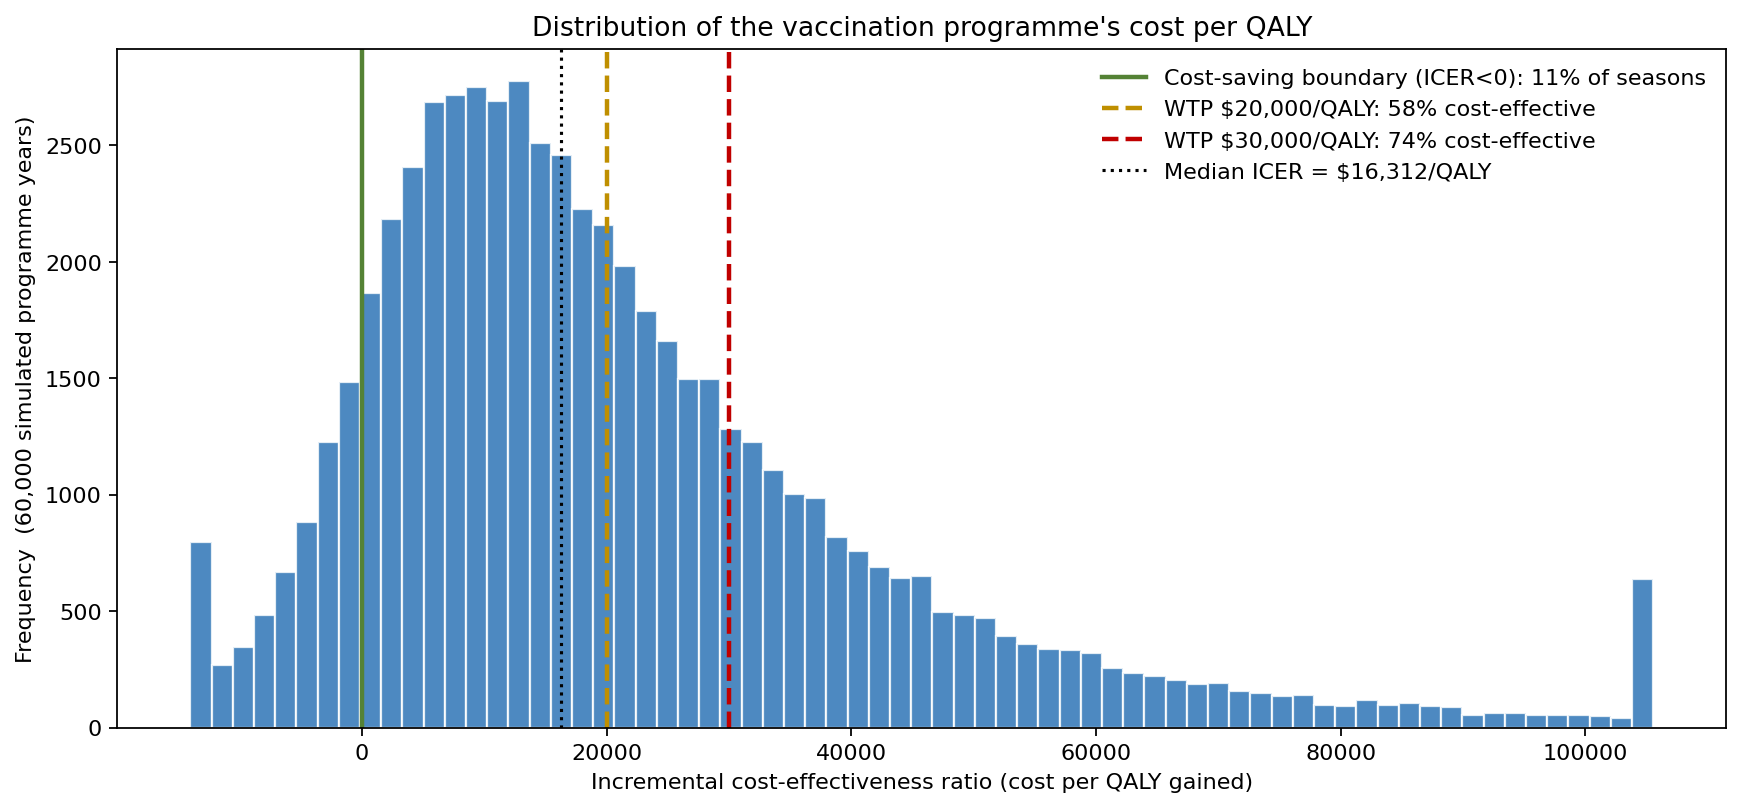
The headline distribution shows the cost per QALY across 60,000 simulated programme years. The median (black dotted line) is $16,312/QALY. The green line marks the cost-saving boundary — 11% of seasons fall left of it. The amber and red dashed lines are the $20,000 and $30,000 WTP thresholds; 58% and 74% of the distribution respectively sit to their left. The long right tail — P90 at $49,517/QALY — is the mild-season risk the central case erased.
Building the cost-effectiveness model
The model computes an incremental cost and an incremental effect, then divides.
Incremental cost is programme delivery cost minus averted treatment cost. Delivery is doses × cost-per-dose, with cost per dose drawn LogNormal around $34 (vaccine plus administration). Averted cost is cases averted × cost per case treated (LogNormal, ≈ $190) plus hospitalisations averted × cost per admission (LogNormal, ≈ $9,200). LogNormals are used throughout because unit costs are strictly positive and right-skewed — a Normal would admit negative prices.
Incremental effect in QALYs is cases averted × QALY loss per case (LogNormal, ≈ 0.006 QALY, about two quality-adjusted life-days) plus deaths averted × discounted remaining life-years (Triangular 8–12–16) × a utility weight (Beta, ≈ 0.73).
Cases averted is the engine, and it carries the model's anti-collapse device: an epidemic-year common factor. Counterfactual incidence — how many adults would have been infected absent the vaccine — is drawn once per year from a shared distribution centred on 8.5% of the adult population. In a heavy year the programme averts far more cases, dragging the ICER down across the board; in a mild year there is little to avert and the ratio rises. Coverage (Beta, mean ≈ 0.69) and efficacy (Beta, mean ≈ 0.70) thin that counterfactual into actual cases averted: 76,000 at P10 to 178,000 at P90, with 914 to 3,556 QALYs gained. Without the shared incidence factor, averaging independent sub-populations would collapse the QALY total toward a near-deterministic number and hide precisely the year-to-year variability that decides whether the programme pays off.
Is it worth funding? The plane and the acceptability curve
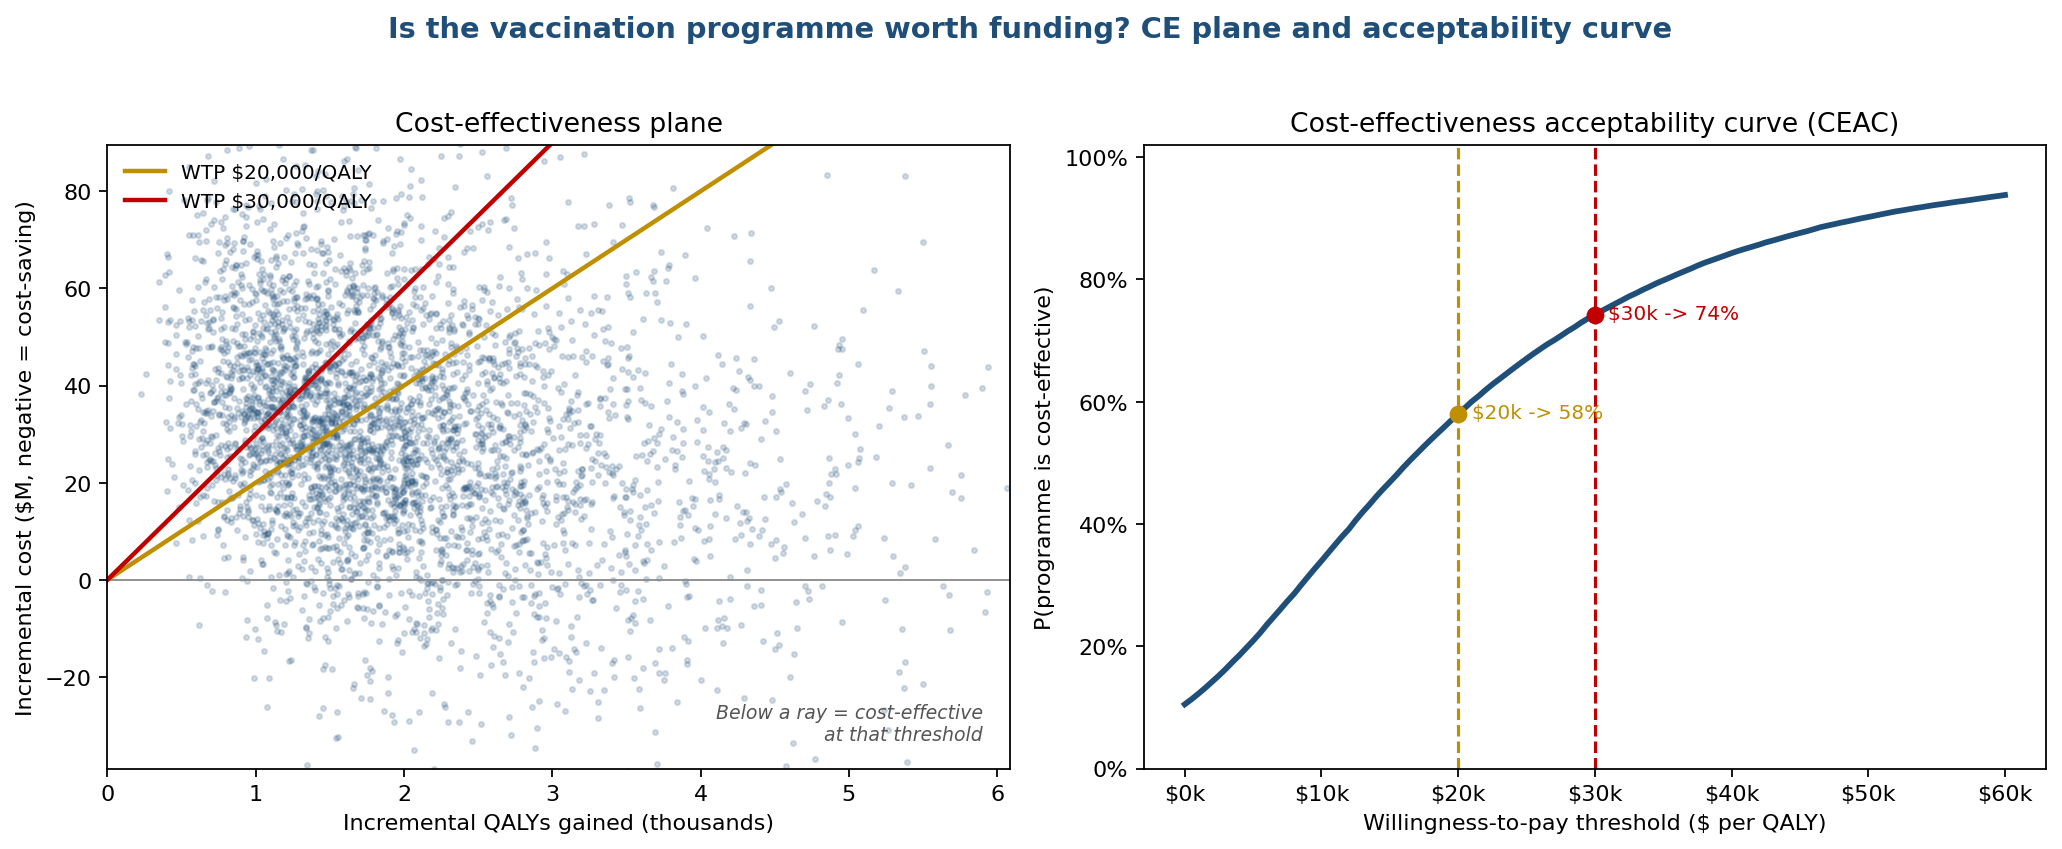
The left panel is the cost-effectiveness plane: each point is one simulated year, plotted by incremental QALYs gained against incremental cost. Points below a WTP ray are cost-effective at that threshold; the cloud straddling the horizontal zero line is the set of years where the programme is outright cost-saving. The right panel is the cost-effectiveness acceptability curve (CEAC) — the probability the programme is cost-effective as a function of the threshold a decision-maker is willing to pay. It reads off cleanly: 58% acceptability at $20,000/QALY, rising to 74% at $30,000. To reach 50% acceptability the threshold need only be about $16,500; to reach 90% confidence the decision-maker would have to be willing to pay roughly $50,000/QALY. The CEAC is the honest answer to "how sure are we?" — and it is not "sure."
Net monetary benefit: the decision rule in dollars
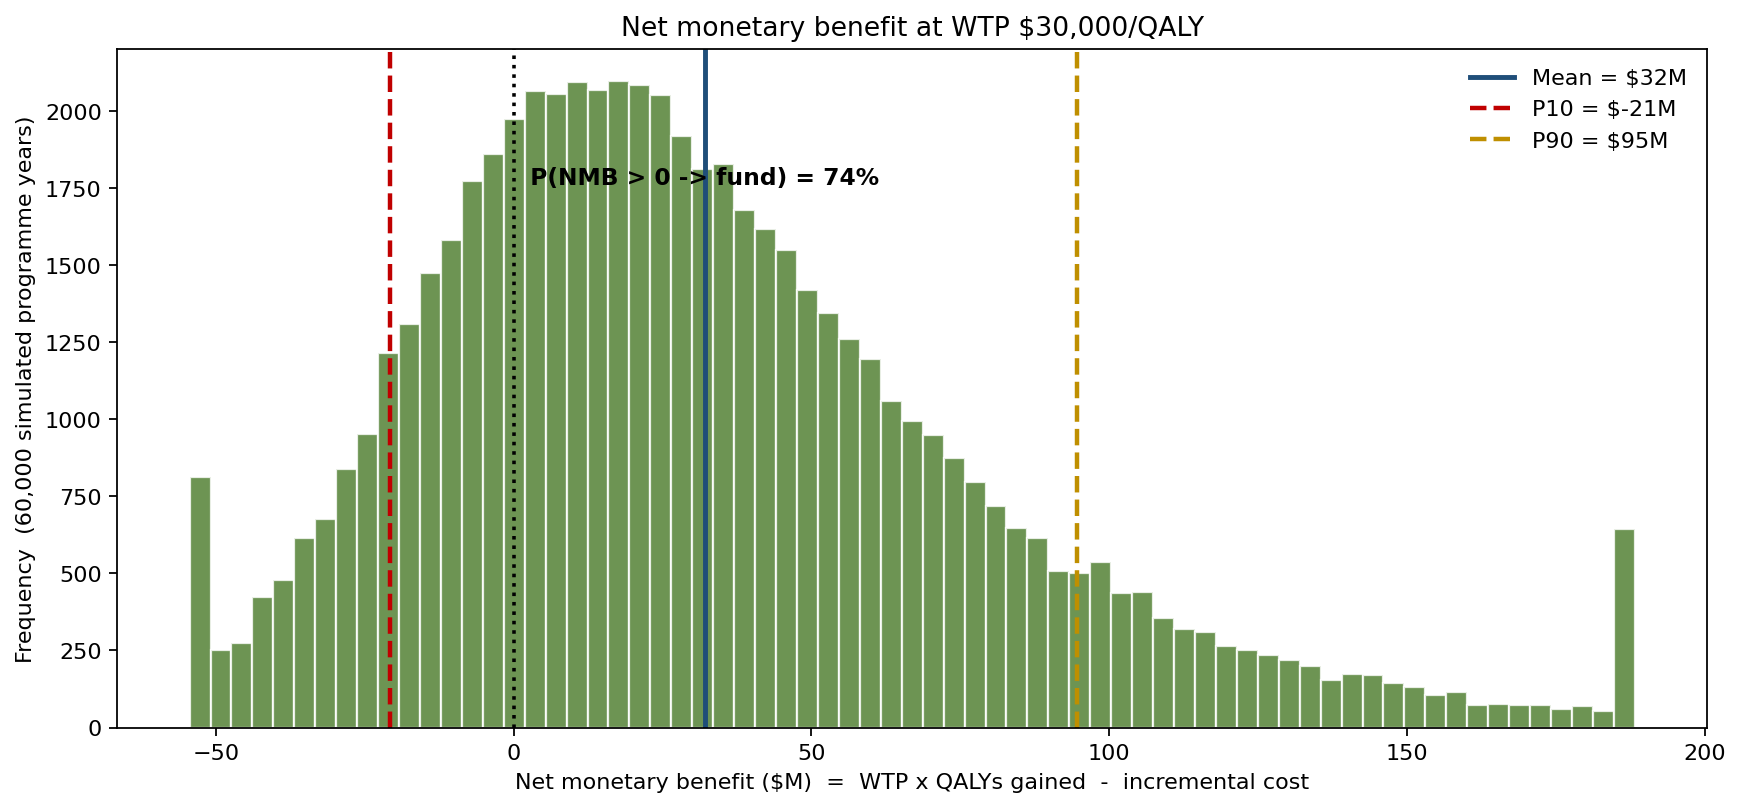
Because an ICER can go negative and is awkward to average, the team also reported net monetary benefit (NMB = WTP × QALYs − incremental cost) at the $30,000 threshold, where the fund/don't-fund rule is simply NMB > 0. The mean NMB is +$32M, the P90 is +$95M — but the P10 is −$21M, and NMB is positive in 74% of years. Funding the programme is a positive-expected-value bet with a real chance of being money-losing in any single mild season, which is exactly the trade-off the agency wanted quantified rather than averaged away.
What the model changed
- The funding decision moved from "$14,362, under the bar" to "58% cost-effective at $20,000, 74% at $30,000." The committee debated a probability, not a false certainty.
- The cost-saving upside was put on the table. An 11% chance the programme pays for itself in averted treatment was a selling point the central ICER buried.
- The downside was bounded. P10 net monetary benefit of −$21M at the $30,000 threshold told the agency the worst plausible mild-season loss, informing a contingency reserve rather than a surprise.
- Data investment was prioritised by the tornado below, which identified counterfactual incidence and dose cost as the inputs worth pinning down before the next funding cycle.
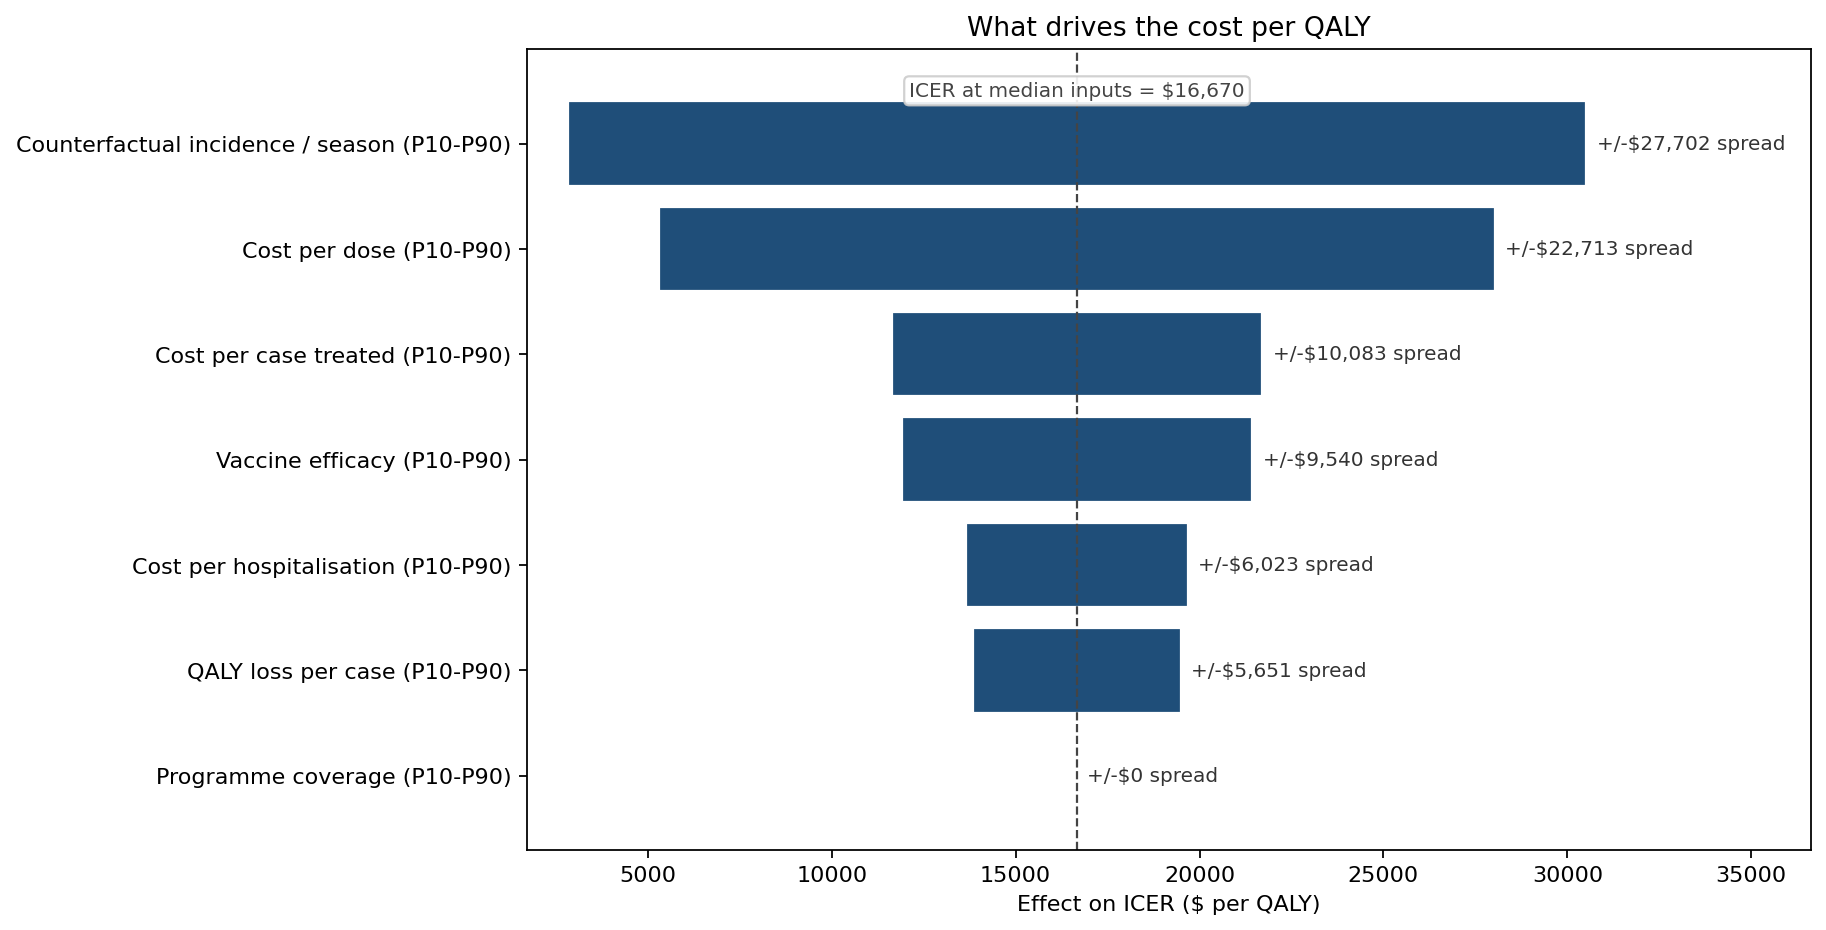
Swinging each input across its P10–P90 range, counterfactual incidence moves the ICER by about ±$13,851/QALY and cost per dose by ±$11,356 — the two dominant levers. Cost per case treated (±$5,041), vaccine efficacy (±$4,770), cost per hospitalisation (±$3,012) and QALY loss per case (±$2,826) follow. Programme coverage is essentially ICER-neutral (±$0): it scales both the cost numerator and the QALY denominator proportionally, so it changes the programme's size but not its value-for-money — a counter-intuitive result the tornado surfaced immediately. The procurement lesson: a price negotiation on dose cost shifts cost-effectiveness almost as much as the whole season's severity, and is the one lever the agency directly controls.
ModelRisk functionality used
- An epidemic-year common factor on counterfactual incidence, shared across the whole programme, so a heavy season lowers the ICER everywhere at once — the device that keeps the cost-per-QALY distribution wide instead of collapsing to a single ratio.
- LogNormal unit-cost inputs for dose, treatment and hospitalisation costs, guaranteeing strictly positive, right-skewed prices where a Normal would admit negatives.
- Beta coverage and efficacy bounded on [0, 1], thinning the counterfactual into 76,000–178,000 cases averted (P10–P90).
- A 60,000-trial ICER distribution reporting median $16,312, mean $21,549 and acceptability of 58% / 74% at the $20,000 / $30,000 thresholds.
- A cost-effectiveness acceptability curve computing P(cost-effective) across WTP from $0 to $60,000 — the committee-ready answer to "how confident are we?"
- A net-monetary-benefit distribution at $30,000/QALY (mean +$32M, P10 −$21M, 74% positive) restating the ratio as a fund/don't-fund dollar rule.
- A tornado that ranked counterfactual incidence and dose cost top and exposed coverage as value-for-money-neutral.
A single ICER answers "is the average programme good value?" The funding decision needs "how often, and how badly, could it not be?" Monte Carlo simulation in ModelRisk turns one cost-per-QALY into an acceptability curve — and an acceptability curve is what a public-health budget actually has to defend.