

Industry: Government and Public Sector
Product: ModelRisk
Application: Policy impact analysis
A Proposed Clean-Vehicle Package Has Only a 24% Chance of Hitting the 2035 Emissions Target on Its Own
A transport ministry was preparing to legislate a clean-vehicle package — an EV purchase subsidy, low-emission zones in major cities, and bus-fleet electrification — with a single number attached to it in the impact assessment: "reduces 2035 surface-transport emissions to 92 Mt CO2/yr." Below that headline sat a statutory ceiling the same legislation would write into law: emissions must fall to 70 Mt CO2/yr by 2035, down from 118 Mt today. The point estimate of 92 Mt cleared neither comfort nor the law. What policymakers actually needed was the answer to a different question: if we pass this, how likely is it to deliver the target?
That is a forward projection of one proposed policy under deep uncertainty, and it is what ModelRisk was used to build.
Why a single forecast number fails
A deterministic impact assessment runs the policy through one assumed future: one EV-adoption curve, one travel-demand path, one grid-decarbonisation rate. It returns one emissions figure and an implicit, unstated confidence of 100%. But every input is a guess about 2035, and the guesses are not independent — they all hang on which broad economic and technological world actually arrives. Collapse that to a single line and the legislature is told "the policy gets us to 92 Mt" with no sense of whether 70 Mt is within reach or a fantasy.
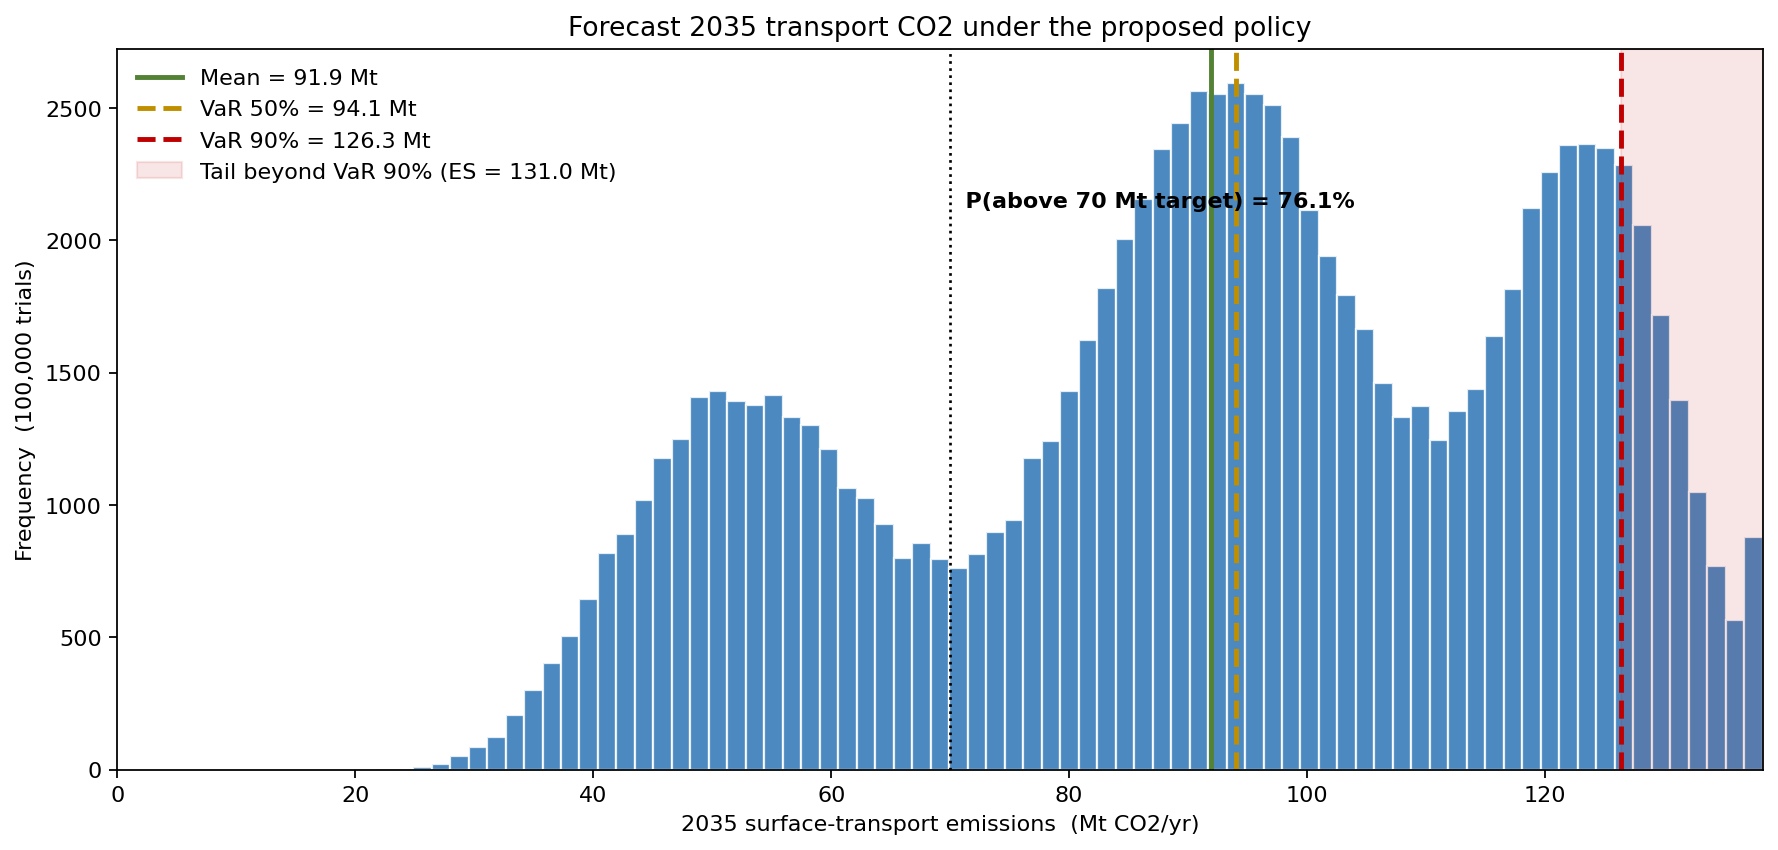
The Monte Carlo forecast tells a sharper story. Under the proposed policy, mean 2035 emissions are 91.9 Mt, with a P50 of 94.1 Mt and a P90 of 126.3 Mt. The probability the policy actually lands at or below the 70 Mt statutory ceiling is 23.9% — versus 7.8% under the status quo. The policy roughly triples the odds of success, and still leaves a three-in-four chance of missing the target it is meant to enshrine. That is the finding a point estimate of 92 Mt structurally cannot surface.
How the forecast is built — one shared scenario drives everything
The model projects 2035 emissions as today's baseline scaled by travel-demand growth and by the carbon intensity of the vehicle fleet. The fleet intensity in turn depends on the EV share of the fleet and how clean the electricity behind those EVs is. Each of those inputs is uncertain, but the central modelling choice is that they are not independent. A single discrete macro scenario — Slow transition (weight 30%), Central (45%), or Rapid transition (25%) — is drawn per trial and conditions every component together. In a Rapid-transition world travel demand is nearly flat, EV share is high, and the grid is clean all at once; in a Slow-transition world all three move the wrong way together.
- EV fleet share in 2035 was modelled as a Beta distribution centred on the scenario mean (30% in Slow, 52% in Central, 74% in Rapid), with the status-quo counterfactual sitting about 22 points lower — the gap the subsidy is meant to open.
- Travel-demand growth 2024→2035 ranged from roughly flat to +35%, scenario-dependent.
- Grid/powertrain cleanliness scaled the EV emission factor, again conditioned on the scenario.
- Low-emission-zone modal shift (Triangular, 2–12% of internal-combustion vehicle-km removed) and an induced-travel rebound (Triangular, 0–8%) were the policy-specific levers with their own uncertainty.
Tying the big inputs to one shared scenario is what keeps the output honest. Treating EV share, demand, and grid as independent would have averaged their swings against each other and produced a deceptively narrow forecast — the classic central-limit collapse. The shared factor preserves the genuine, wide, multi-modal spread the legislature has to legislate against.
Three macro worlds, three different verdicts
Splitting the policy forecast by scenario shows that "will it work?" has no single answer — it depends almost entirely on the macro path.
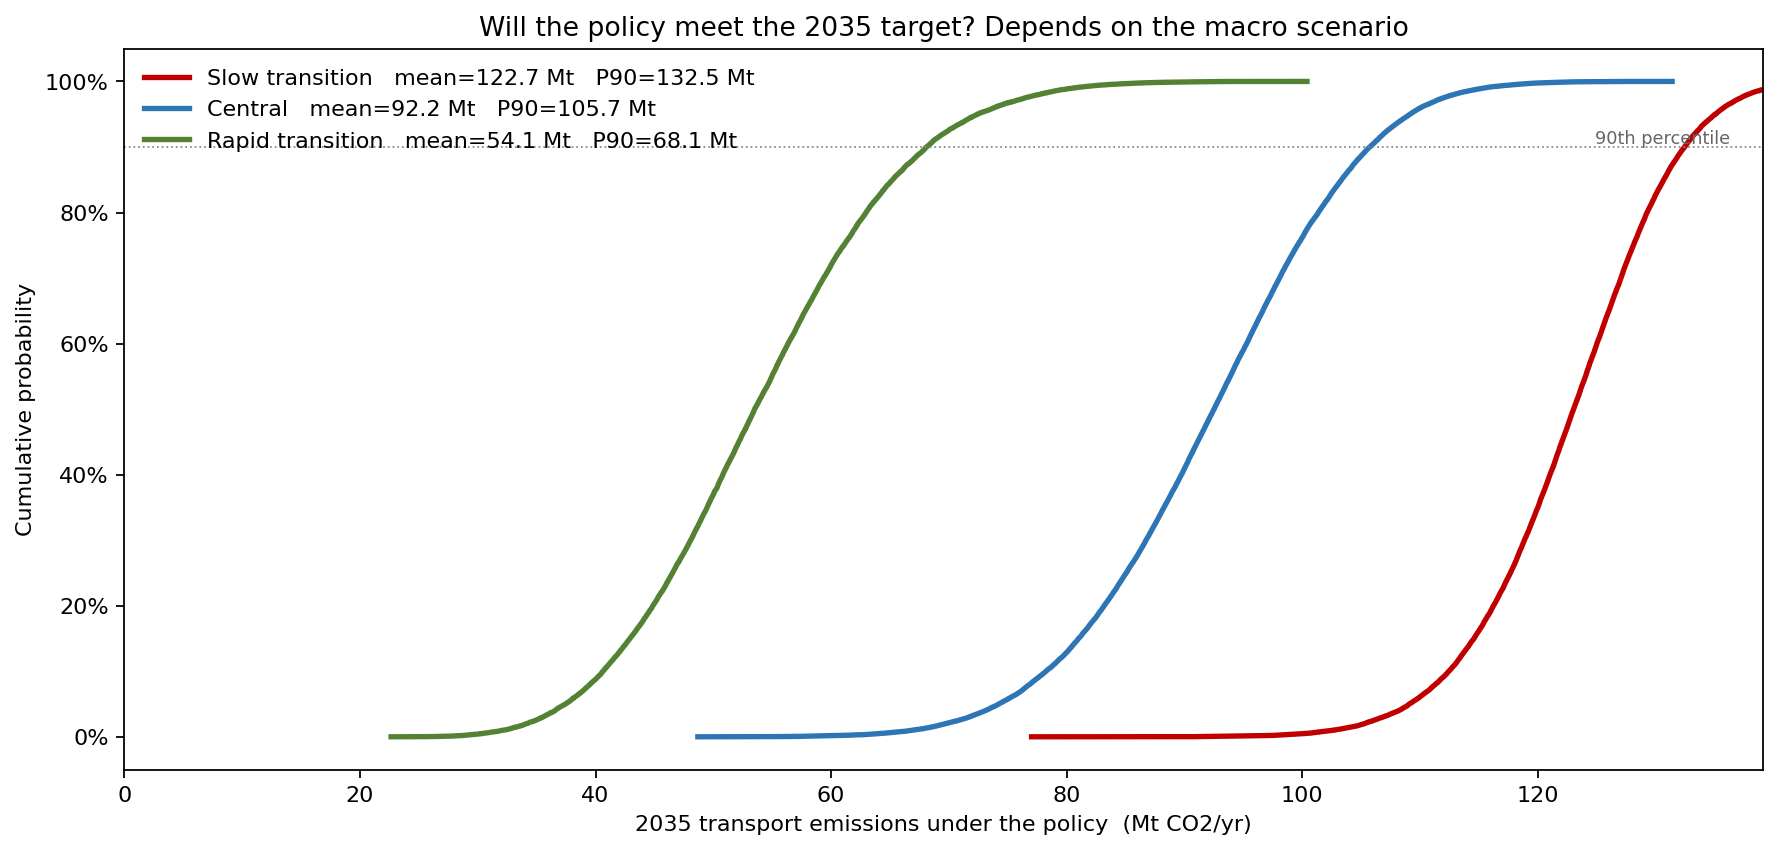
- Slow transition: mean 122.7 Mt, P90 132.5 Mt — probability of hitting the 70 Mt target 0.0%. The policy is nowhere near enough.
- Central: mean 92.2 Mt, P90 105.7 Mt — probability of hitting the target 2.1%. A near-miss world.
- Rapid transition: mean 54.1 Mt, P90 68.1 Mt — probability of hitting the target 92.6%. The policy comfortably clears the ceiling.
The blended 23.9% is dominated by which world arrives, not by the policy's design. That reframes the decision: the package only reaches its statutory goal if the wider economy and grid are already decarbonising fast — so it must be paired with grid and demand-side measures, not legislated alone.
Which assumptions the target hangs on
A rank-correlation tornado on the policy forecast ranks the drivers of the 49 Mt P10–P90 spread in 2035 emissions.
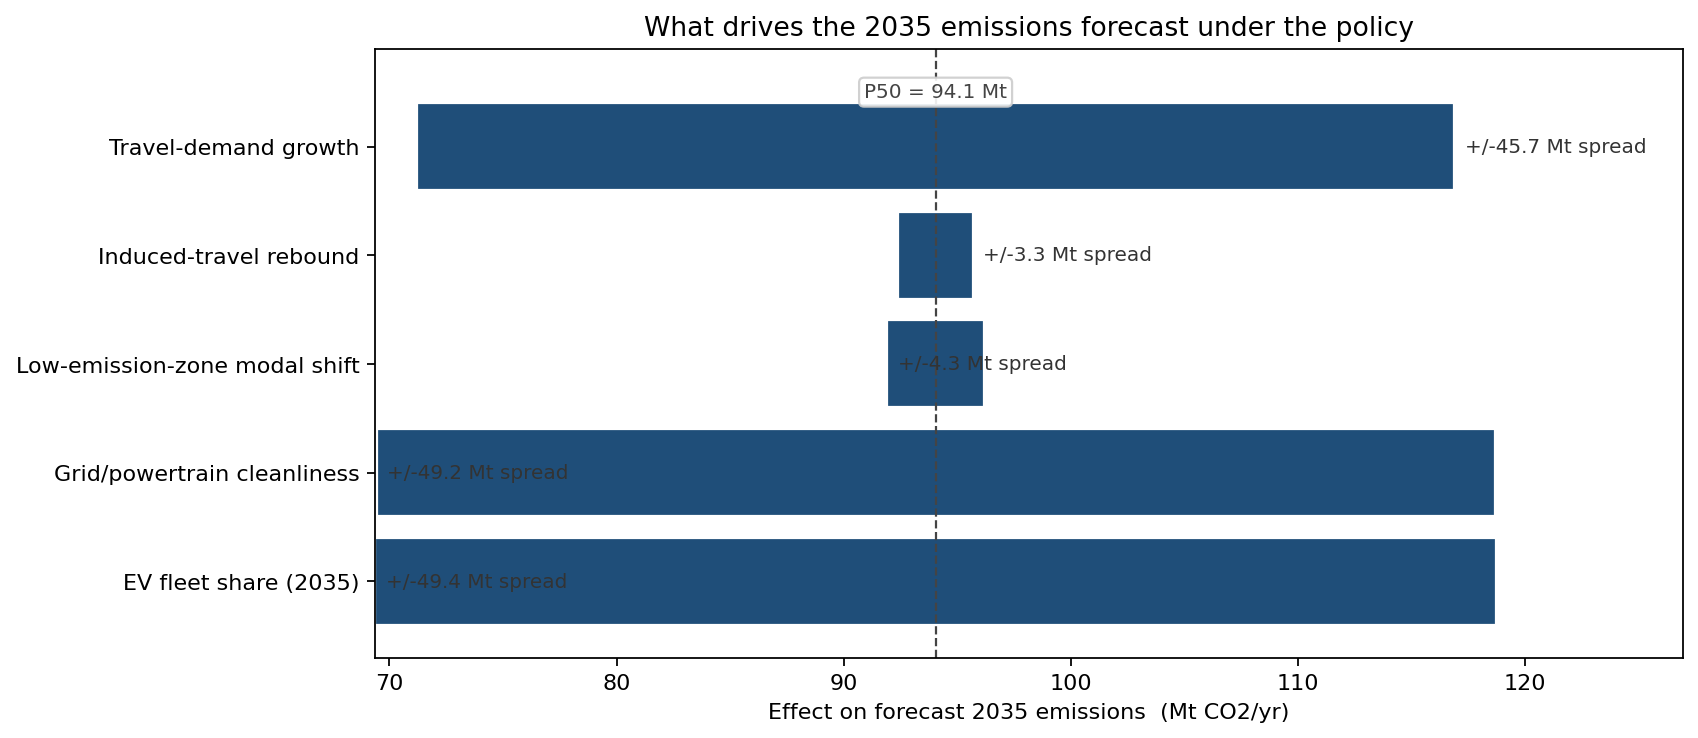
- EV fleet share (2035): ±24.7 Mt
- Grid/powertrain cleanliness: ±24.6 Mt
- Travel-demand growth: ±22.8 Mt
- Low-emission-zone modal shift: ±2.1 Mt
- Induced-travel rebound: ±1.6 Mt
The two largest levers — EV uptake and grid cleanliness — are exactly the ones the transport ministry only partly controls. The visible policy instrument, the low-emission zones, moves the answer by barely a tenth as much. The honest conclusion is that the target's fate sits mostly outside the package itself.
How strict a target can the policy carry?
Sweeping the emissions ceiling shows how the policy's success probability rises as the goal is relaxed, with the status-quo curve underneath as the counterfactual.
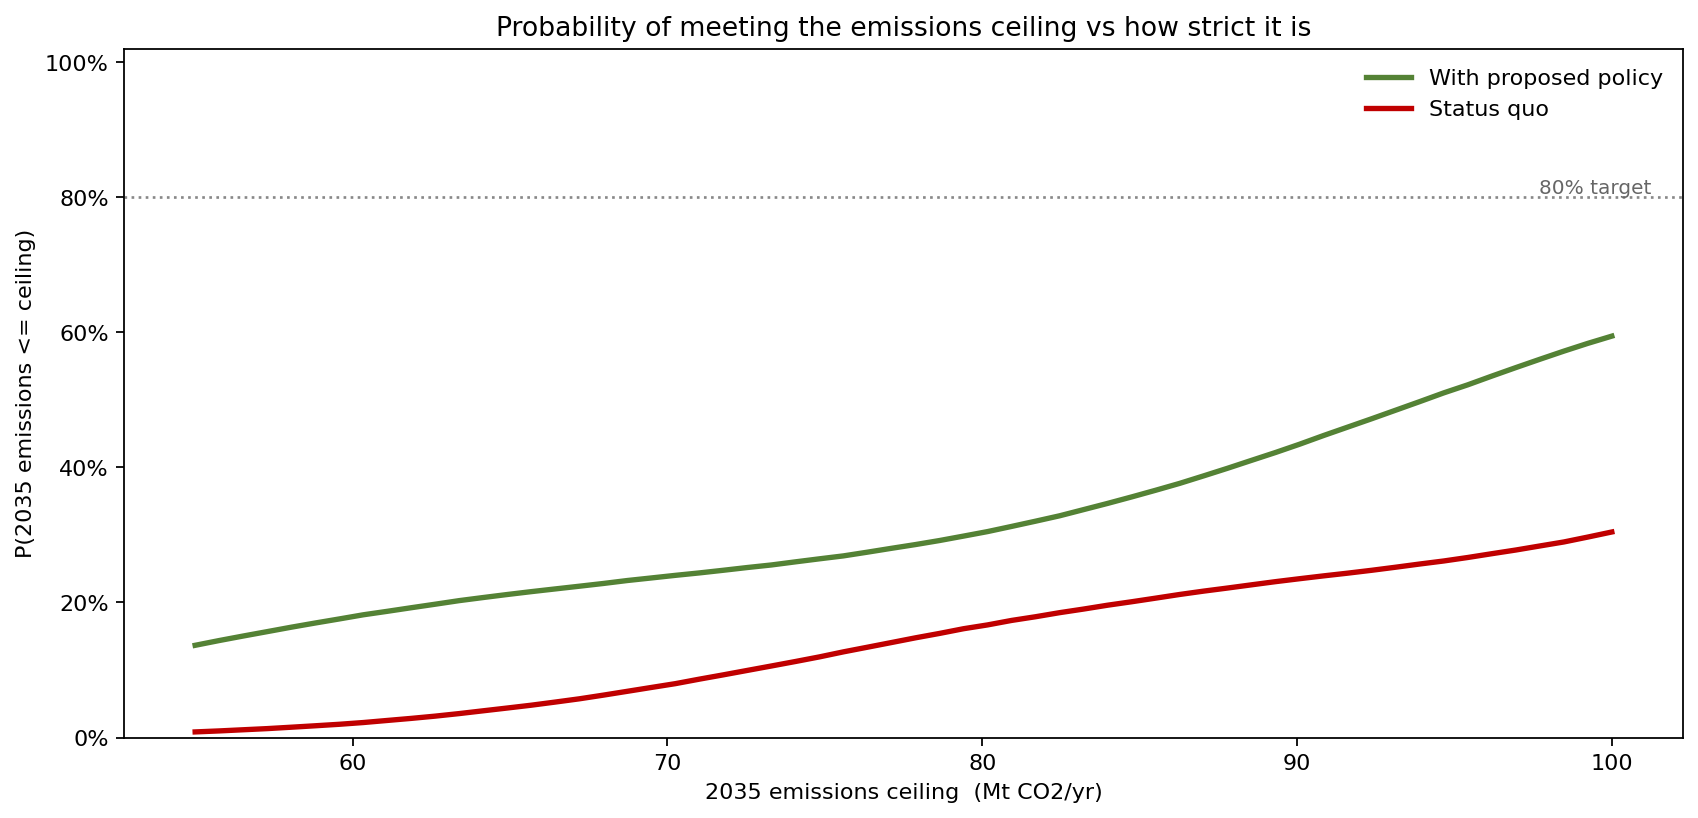
At the statutory 70 Mt ceiling the policy reaches 23.9% versus 7.8% status quo. At 80 Mt the gap widens to 30.3% versus 16.5%, and at 90 Mt to 43.3% versus 23.5%. The vertical distance between the two curves is what the package actually buys at any level of ambition; the curves' steepness shows how much a few points of slack in the legislated ceiling change the odds of compliance.
What the model changed
The deterministic assessment offered a single 92 Mt figure that looked like a near-miss and invited a "tighten it a little" response. The simulation reframed the choice three ways. First, it put a probability on the statutory promise — 24% — and made clear that passing this package alone gives the legislature a one-in-four chance of meeting a law it is simultaneously writing. Second, it showed that success is governed by the macro scenario (0% in Slow, 93% in Rapid), so the package must be coupled with grid and demand measures rather than relied on alone. Third, the tornado showed the ministry's most visible lever — low-emission zones — is also its weakest, redirecting attention to EV uptake and grid decarbonisation.
ModelRisk functionality used
- Monte Carlo simulation of 2035 emissions over 100,000 trials, producing the headline forecast distribution (mean 91.9 Mt, P90 126.3 Mt) instead of a single 92 Mt figure.
- Scenario-conditioned common-factor sampling — one discrete macro scenario per trial driving EV share, demand, and grid together, preventing the central-limit collapse that independent inputs would have caused.
- Beta and Triangular distributions for the bounded policy inputs (EV share, modal shift, rebound), keeping every uncertain quantity inside its physical range.
- Scenario CDF comparison quantifying the target-hit probability per macro world (0.0% / 2.1% / 92.6%).
- Tornado (rank-correlation) sensitivity ranking the five drivers and exposing that EV uptake (±24.7 Mt) and grid cleanliness (±24.6 Mt) dominate the controllable low-emission zones (±2.1 Mt).
- Threshold sweep of P(meet ceiling) against the legislated emissions cap, with a status-quo counterfactual showing exactly what the policy adds.
For a proposed policy, the right deliverable is not "the policy gets us to 92 Mt" but "the policy has a 24% chance of meeting the law — and that number lives or dies on the macro path, not the legislation."