

Industry: Government and Public Sector
Product: ModelRisk
Application: Infrastructure resilience
One Bad Storm Season Can Knock Out Six Components at Once — and the Failure-by-Failure Model Never Sees It
A regional distribution network — 14 substations, pumps, trunk mains and feeders serving roughly a million customers — was assessed component by component. Each asset's annual failure probability looked manageable in isolation: a few percent here, a fifth there. The agency summed the expected outages and concluded the network met its resilience standard. Then it rebuilt the assessment in ModelRisk with one shared storm-season hazard driving every component together, and the answer changed shape. In the worst 5% of storm seasons, six components fail in the same year, and annual service loss reaches 17.7 million customer-hours at the P95 — against a mean of just 4.4 million. The component-by-component view, which implicitly treats failures as independent, simply cannot produce that clustered tail.
Why a point estimate hides the resilience problem
Resilience is a tail property, not an average. The expected annual service loss (4.4 million customer-hours) is a number you can plan around; the problem is the 1-in-20 storm season that takes out a third of the network at once and overwhelms the restoration crews. A model that fails components independently — multiplying small probabilities as if each asset lived in its own weather — produces a thin, well-behaved tail and a comforting average. A model where the same storm season raises every exposed component's failure odds together produces the fat, clustered tail that the resilience standard actually exists to guard against. The difference is not cosmetic: it is the difference between a network that meets its standard and one that breaches it 15% of the time.
A shared hazard, not 14 independent dice
Each of the 14 components carries a base fragility (its failure probability in an average storm year, ranging from 3% for the underground ring main to 24% for the exposed overhead-line corridor) and a hazard sensitivity (how strongly storms scale that fragility). The mechanism that couples them is a single annual hazard intensity drawn once per simulated year from a Gamma distribution (shape 2.0, mean 1.0, heavy right tail for severe seasons). That one draw scales the failure odds of every component in the same direction: a benign year leaves most assets standing; a 1-in-20 season pushes the whole network toward simultaneous failure.
When a component fails, its restoration time is a LogNormal draw (medians from 11 hours for a feeder cluster to 60 hours for the slow-to-repair underground ring main), itself mildly lengthened in severe seasons because crews are stretched. Service loss is then customers served × downtime, summed across all failed components — the customer-hours metric regulators care about.
The shared hazard is what makes this a resilience model rather than a reliability spreadsheet. With it in place, the failure count is 1.7× more variable than an independent-hazard world (P95 of six components down simultaneously), and the two most storm-exposed assets — the overhead-line corridor and the river pump station — show a pairwise failure correlation of 0.32. They go down together because the same storm takes them both, which is exactly the co-failure an independent model scores as a vanishingly rare coincidence.
What the hardening program does to the distribution
The agency proposed hardening the five most exposed and highest-consequence components — the overhead-line corridor, river pump station, both coastal substations and the switching yard — cutting their fragility ~60% and their restoration time ~35% through spares, sectionalizing switches and faster crews. Running the network before and after puts the value of that program in customer-hours.
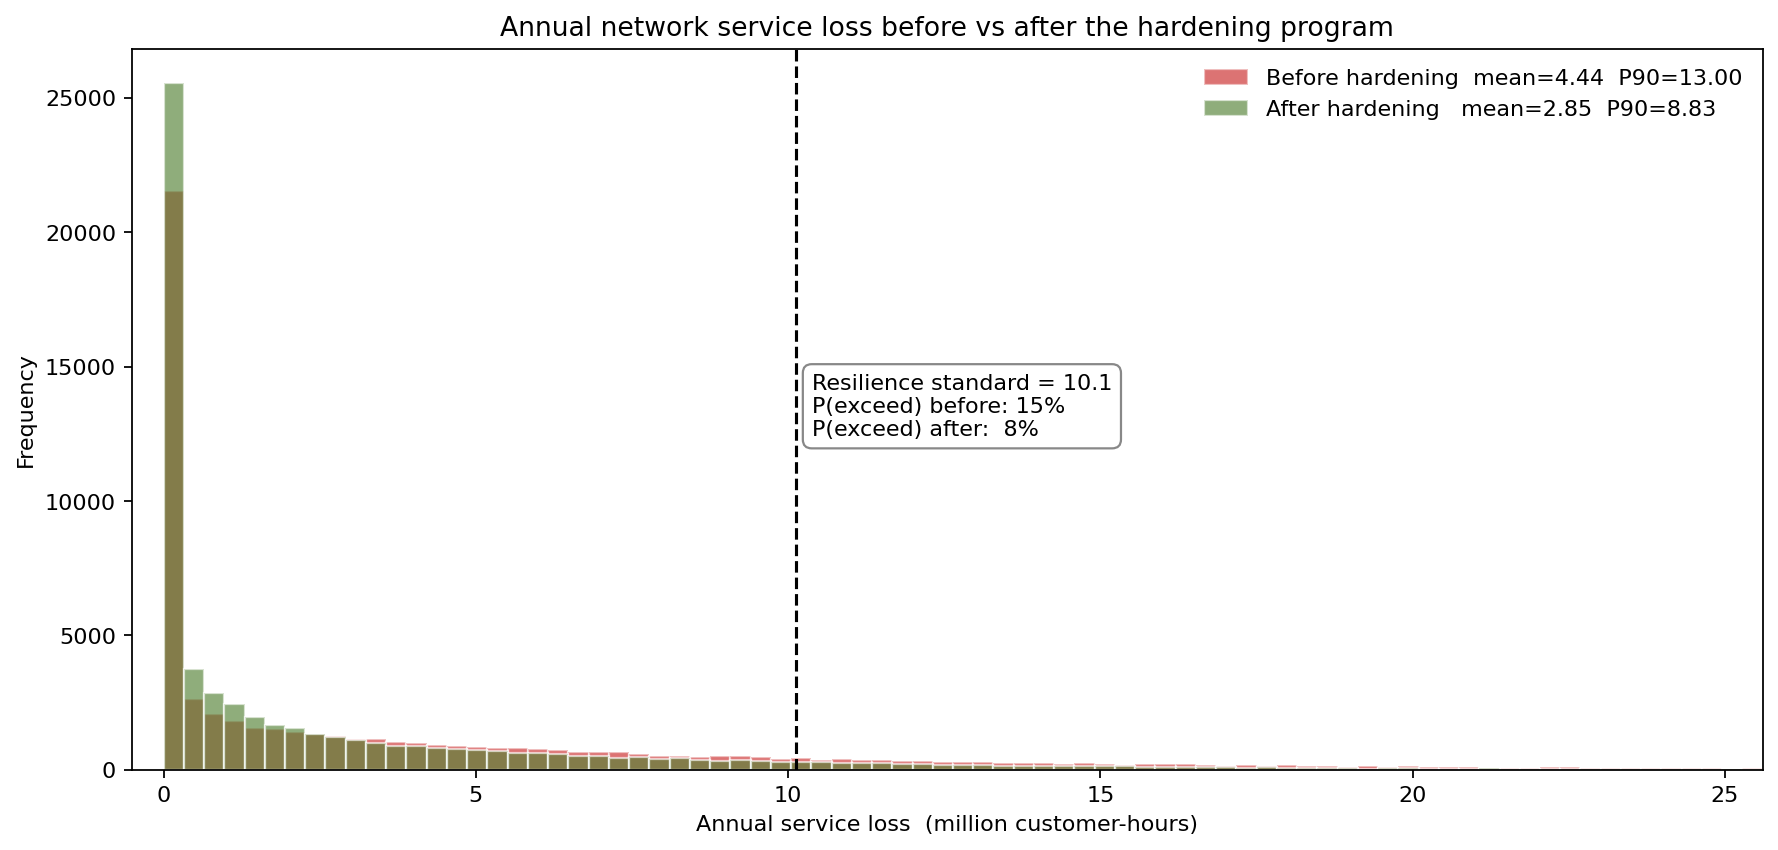
The hardening pulls the mean service loss from 4.4 to 2.9 million customer-hours and the P90 from 13.0 to 8.8 million. Against the resilience standard (set at 10.1 million customer-hours, the network's pre-hardening P85), the probability of a breach falls from 15% to 8%. The whole distribution shifts left and thins, but — crucially — it does not vanish: the tail beyond the standard is reduced, not eliminated.
How much hardening buys how much resilience
Sweeping the hardening program from zero to its full $90M scope traces the spend-versus-security curve the budget committee needs.
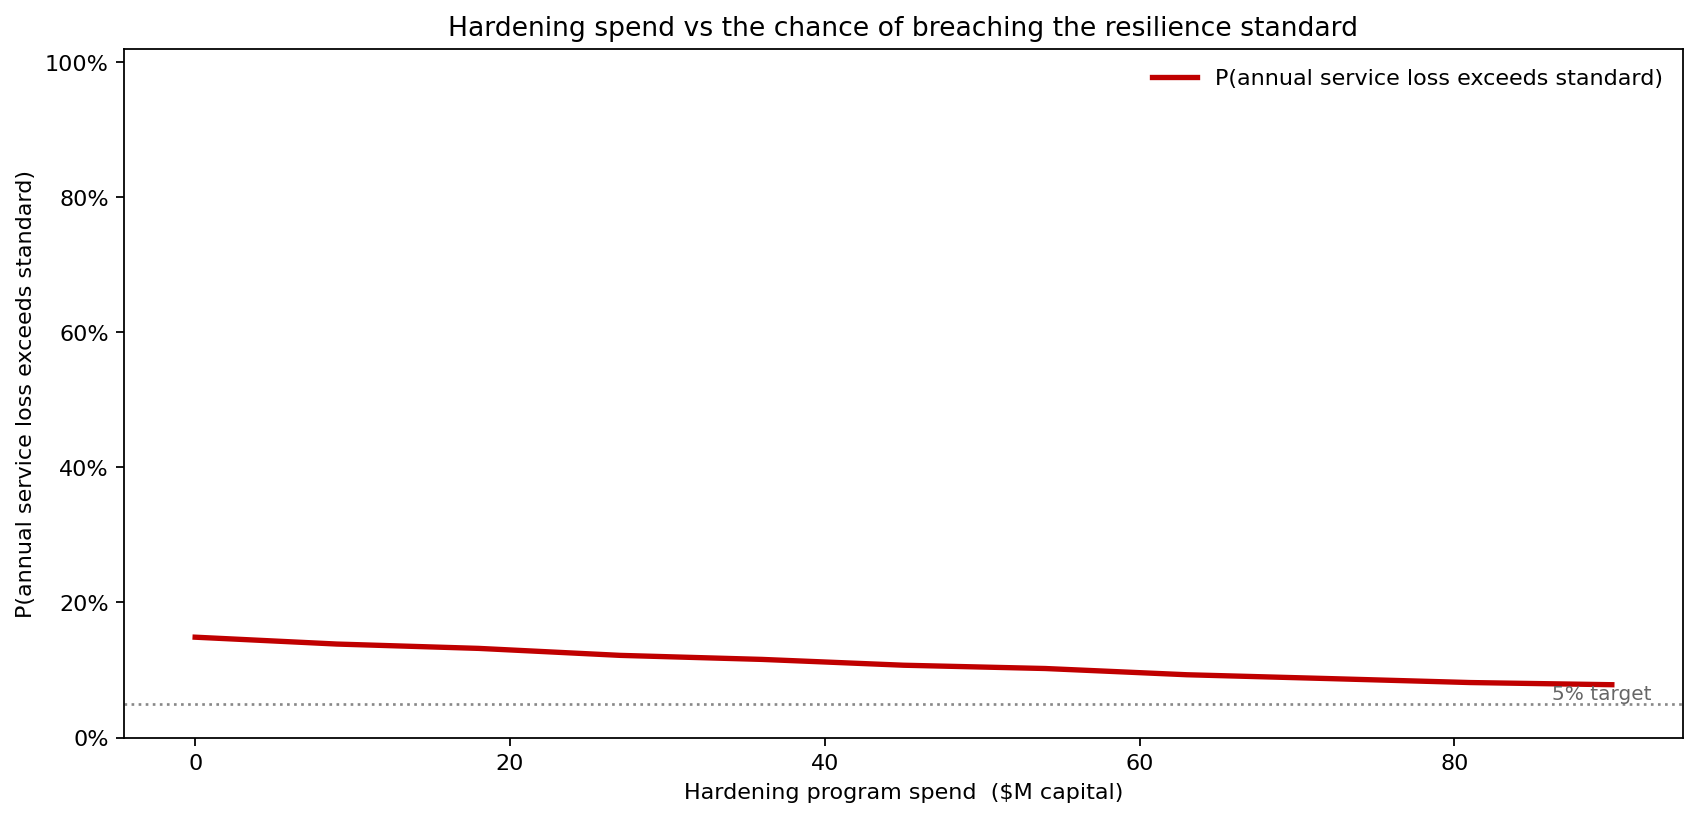
The curve is honest about diminishing returns. Breach probability falls from 15% at zero spend to 8% at the full $90M — but it flattens, and even the complete program does not reach a 5% standard. The reason traces straight back to the shared hazard: hardening five components shrinks their contribution, but a severe-enough storm season still fells enough of the unhardened network to breach the standard. The model's verdict is one a point estimate could never deliver: this hardening package is worth funding, and it is not sufficient on its own — the remaining tail requires either a wider hardening scope or a faster network-wide restoration capability.
Where the customer-hours are lost
A Pareto of expected annual service loss by component shows where the program's money should go first.
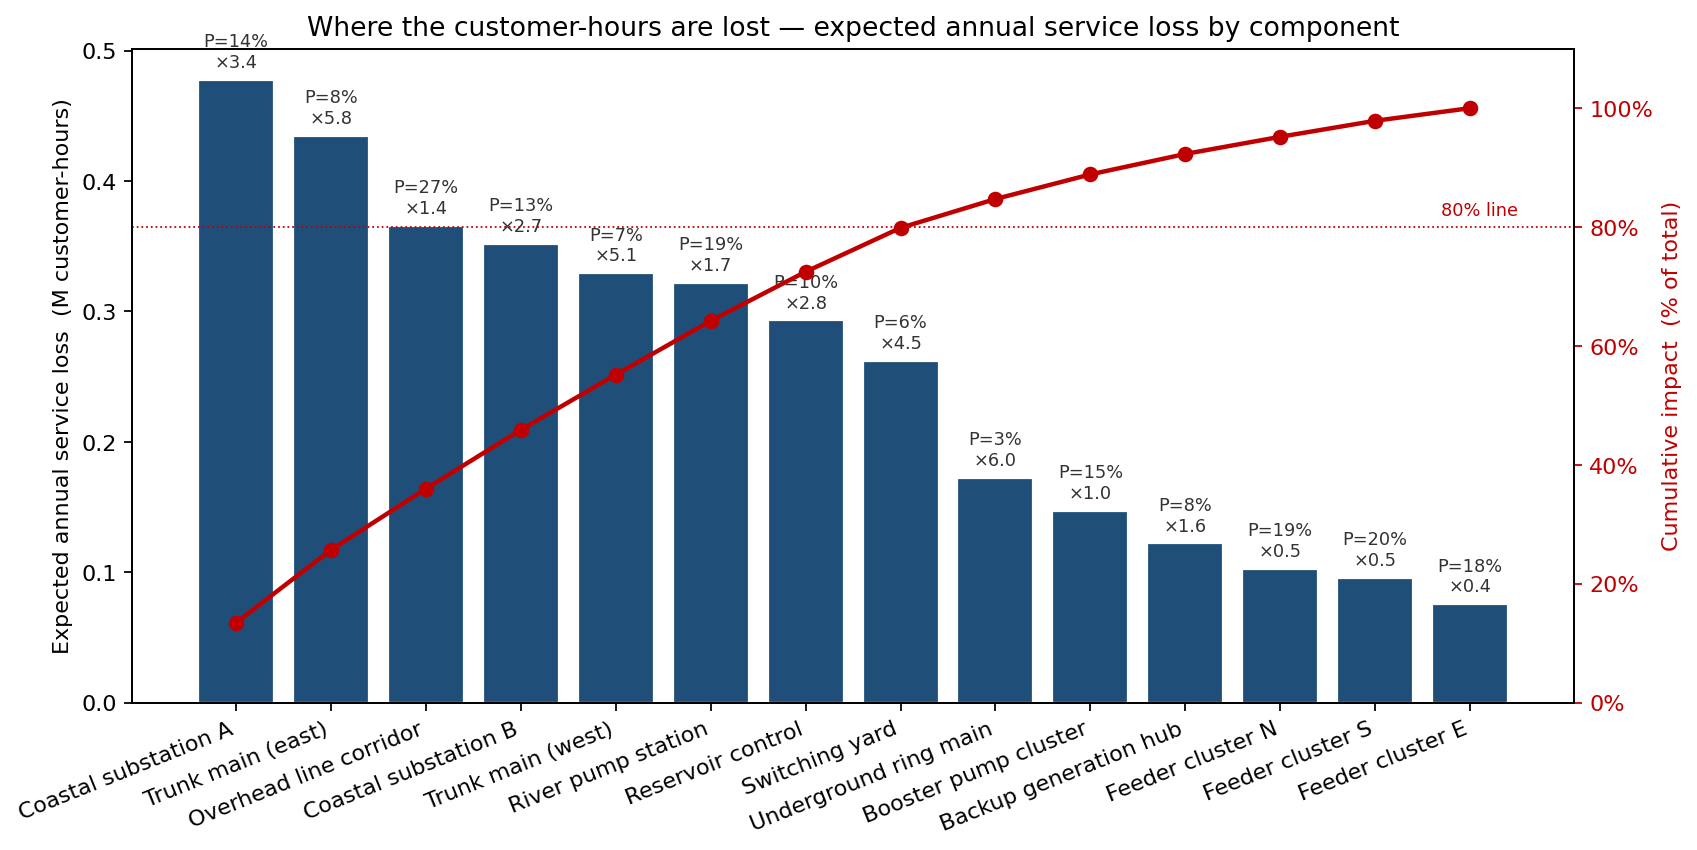
The ranking blends frequency and consequence. The overhead-line corridor fails most often (27% per year) but is quick to restore; the coastal substations and trunk mains fail less often but each failure costs far more customer-hours. The top six components together dominate the expected loss, and the program's five hardening targets are drawn from exactly this head of the distribution — frequency alone, or consequence alone, would have picked the wrong assets.
What actually drives the P95 service loss
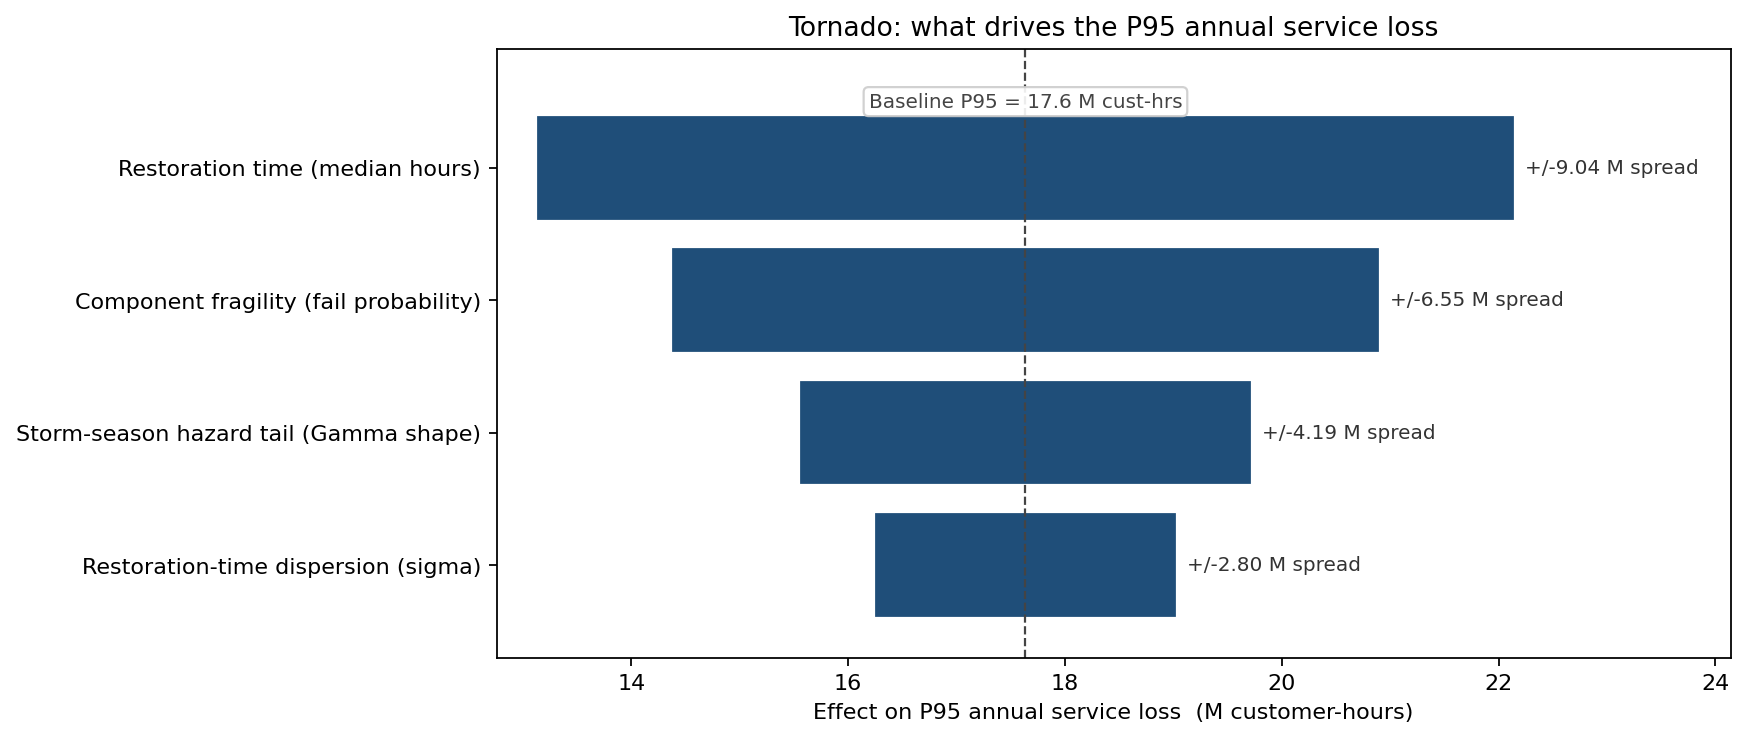
Tornado analysis on the P95 service loss ranks the levers. Restoration time is the single largest mover (±4.5 million customer-hours across its plausible range), ahead of component fragility (±3.3 million) and the storm-season hazard tail (±2.1 million). This reorders the agency's instinct: the temptation is to spend entirely on making assets less likely to fail, but the tail is driven at least as much by how long failures last. A dollar spent on restoration capacity — pre-positioned spares, mutual-aid crews, sectionalizing switches that shrink the affected customer count — moves the P95 more than the same dollar spent shaving fragility.
What the model changed
- The hardening scope was repriced honestly. At a 15% baseline breach probability and a program that only reaches 8%, the agency stopped presenting the $90M package as "meeting the standard" and instead funded it as the first of two stages, with a network-wide restoration upgrade as the explicit second stage.
- Investment shifted toward restoration speed. Because the tornado put restoration time ahead of fragility, the agency reallocated part of the capital budget from asset-strengthening to spares, mutual-aid agreements and sectionalizing switches — the levers that shorten the customer-hours clock.
- Co-failure entered the emergency plan. The 0.32 overhead-line/river-pump failure correlation and the P95 of six simultaneous failures sized the crew and mutual-aid requirement for a bad season, replacing a staffing plan built on the average year.
ModelRisk Functionality Used
- Shared hazard common factor — one Gamma-distributed storm-season intensity per iteration scaling all 14 components' failure odds together, producing the 0.32 co-failure correlation and 1.7× failure-count clustering an independent model cannot represent.
- Bernoulli failure with LogNormal restoration — per-component failure draws conditioned on the shared hazard, each failed asset carrying its own right-skewed restoration time, combined into the customer-hours service-loss metric.
- Before/after distribution comparison — quantifying the hardening program as a shift in the full loss distribution (mean 4.4 → 2.9 M cust-hrs, breach probability 15% → 8%) rather than a single expected-saving figure.
- Hardening-spend sweep — tracing breach probability across the $0–$90M program to expose the diminishing-returns flattening and prove the package, alone, cannot reach a 5% standard.
- Pareto and tornado — ranking components by expected customer-hours and ranking drivers of the P95, which together redirected spend toward restoration speed over raw fragility.
For critical infrastructure, resilience is not the average year — it is the storm season that fails six things at once. ModelRisk is what makes that clustered tail visible, and once it is visible the budget argument moves from "is the network reliable?" to "how cheaply can we reshape its worst 5%?"