

Industry: Government and Public Sector
Product: ModelRisk
Application: Emergency response planning
An Eight-Ambulance Fleet Meets the 8-Minute Target — Until the Shift Gets Busy
A city EMS dispatch center runs eight ambulance units across a 12-hour shift, fielding around 54 emergency medical calls. On a calm shift the units handle the load comfortably: the median call reaches the patient in under five minutes, well inside the 8-minute response target written into the service-level agreement. The planning spreadsheet, working from the average call rate and the average unit-busy time, reports a system that meets the target with room to spare.
Simulating the same fleet against realistic, bunched demand tells a different story. Across 8,000 simulated shifts the mean response time is 6.9 minutes, but the distribution is sharply right-skewed: the 90th-percentile response is 8.9 minutes and the 95th is 18.5 minutes. Overall the eight-unit fleet misses the 8-minute target on 11.8% of calls — and on a surge shift it misses nearly one call in four. The average looks fine; the tail is where patients wait.
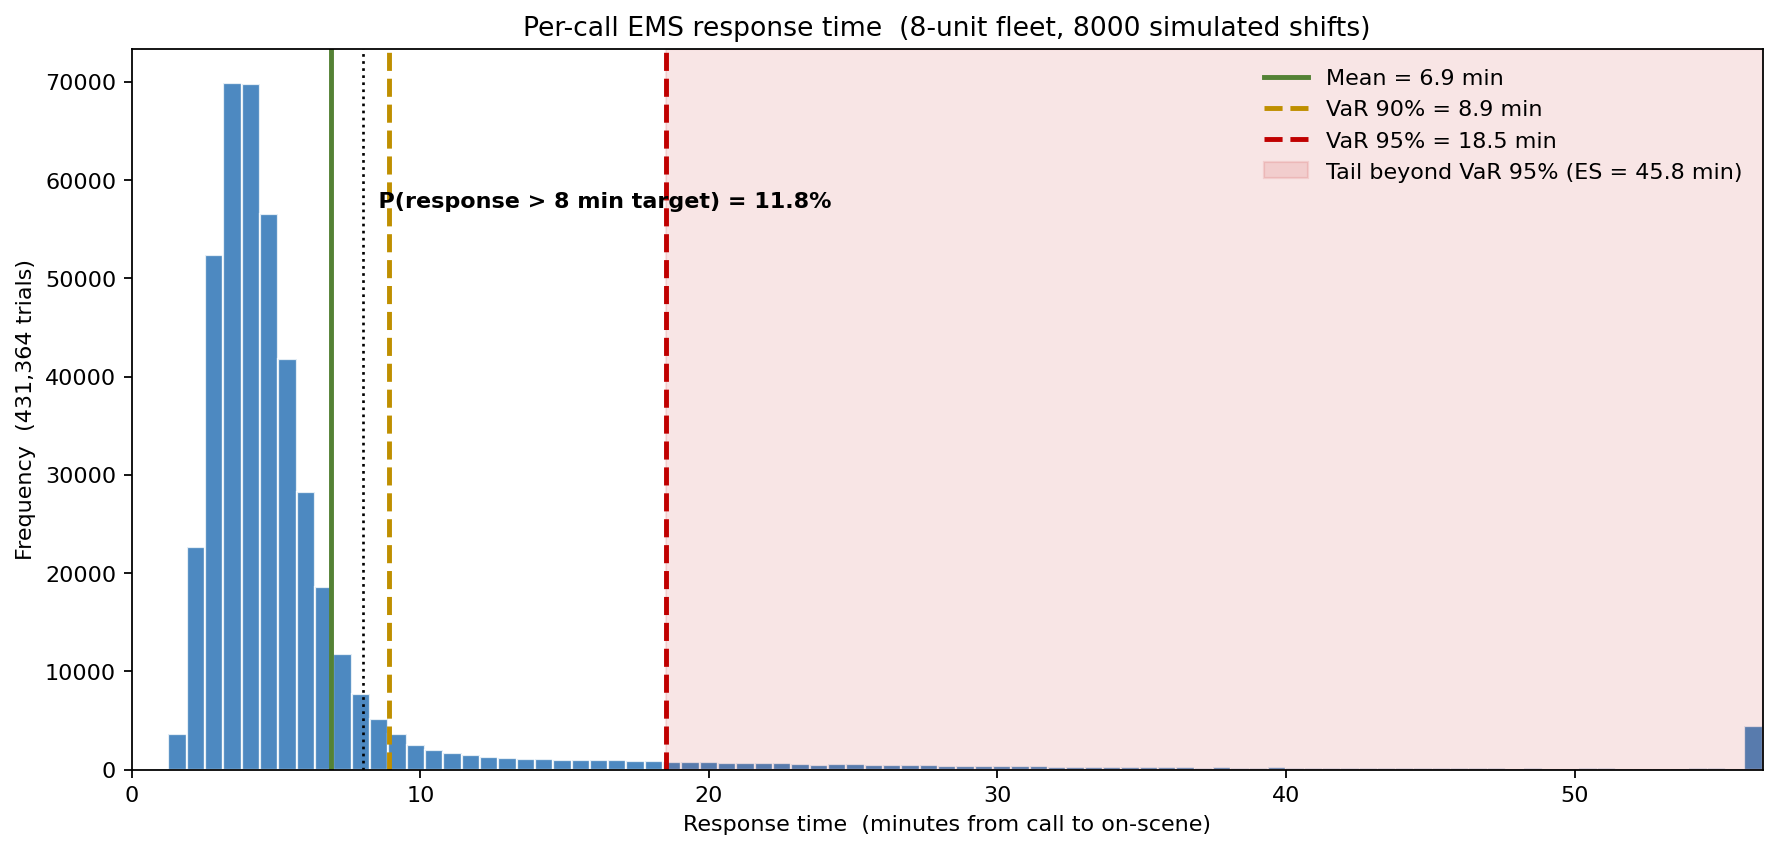
A multi-jurisdiction emergency-services authority rebuilt its staffing plan in ModelRisk after a season of target breaches that the deterministic model never predicted. The mandate: size the fleet against the probability of a late response under stochastic demand, not against the average load on a quiet Tuesday.
Why a point estimate fails
Response time is a queue. When all eight units are busy, the next call waits — and the wait depends on the interaction of how calls arrive and how long each unit stays committed, not on either average alone. A deterministic "calls per hour ÷ units" calculation cannot represent three things that drive the breaches:
- Calls do not arrive evenly. They follow a Poisson process, and the mean rate itself varies shift to shift — a shared "shift-intensity" factor (heatwaves, multi-casualty events, flu surges) lifts every call's wait together. This over-dispersion is what stops the variance from averaging away.
- Service times have a heavy tail. Each call ties up a unit for a LogNormal time (median 42 min: travel, on-scene care, transport, hospital handoff). A few long transports pull multiple units off the board at once.
- The breach lives in the tail. A 6.9-minute mean is irrelevant to a target defined on the upper percentiles of the response distribution.
The model is a multi-server FIFO queue simulated per shift: Poisson arrivals under a Gamma shift-intensity multiplier, LogNormal unit-busy times, and a LogNormal travel-to-scene time added to any queue wait to give the patient-experienced response.
How many ambulances does the target actually require?
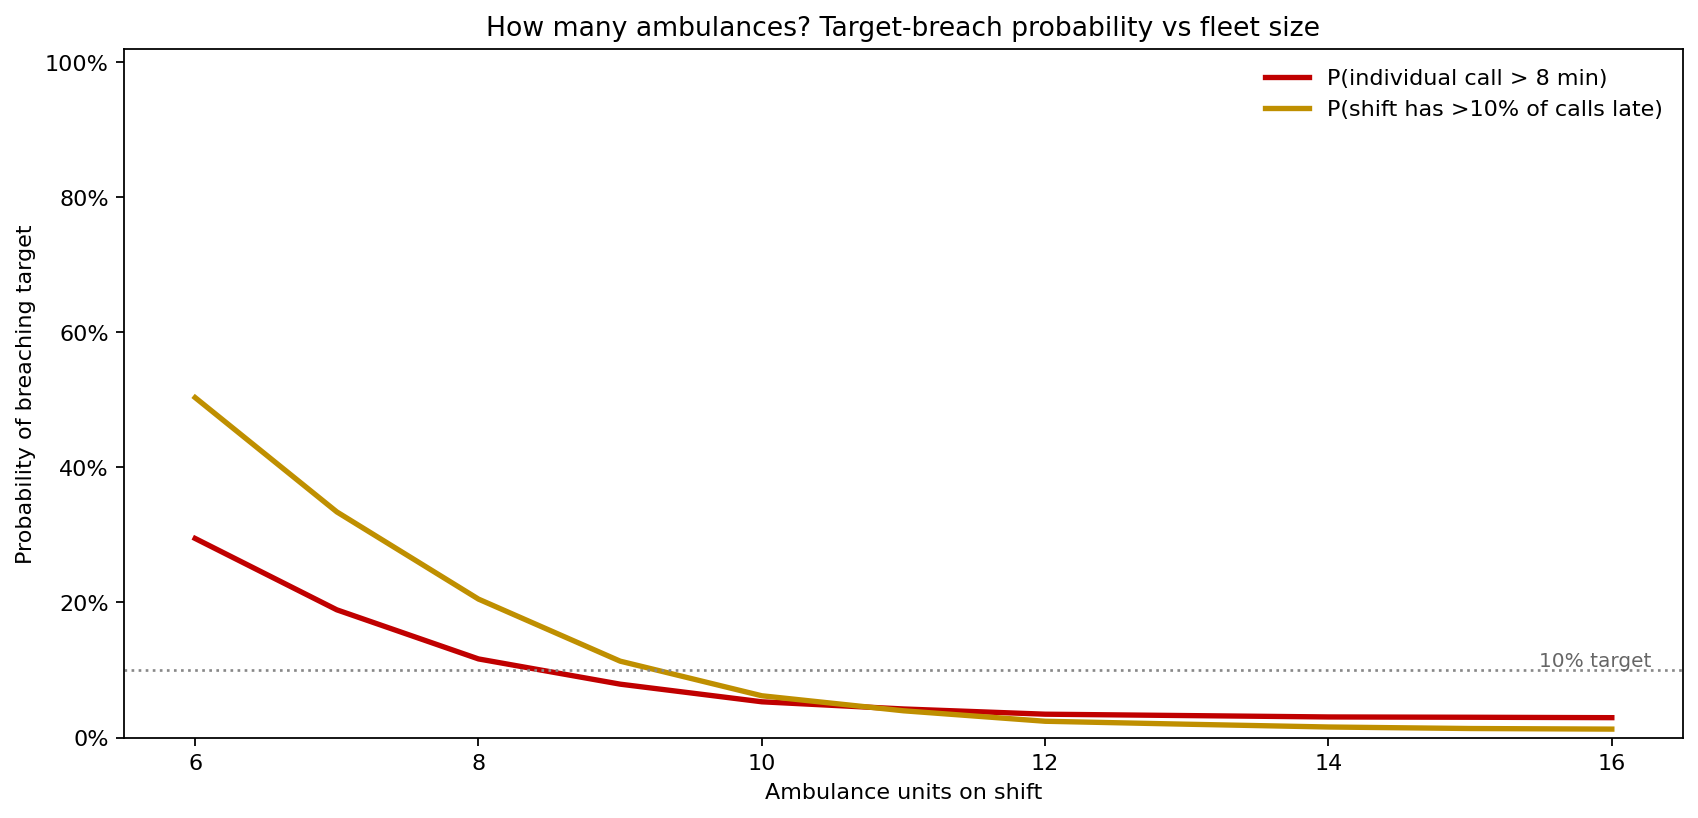
Sweeping the fleet from 6 to 16 units turns the SLA into a staffing number:
- 6 units: 29.5% of calls breach 8 minutes; half of all shifts run more than 10% of calls late. Untenable.
- 8 units (current): 11.6% of calls breach; mean response 6.7 minutes.
- 9 units: the per-call breach rate drops below the 10% line to 7.9%.
- 10 units: the shift-level reliability target is met — only 6.2% of shifts run more than 10% of calls late, and per-call breach falls to 5.3%.
So the smallest fleet that meets the target for the individual call is 9 units, and the smallest fleet that holds the line shift-by-shift is 10 units — one to two units above the deterministic plan's eight. Beyond 11 units the curve flattens: extra ambulances buy almost no further reduction (the residual breaches are travel-time, not queueing). That diminishing return is the budget argument.
Why the average lies: calm shifts versus surge shifts
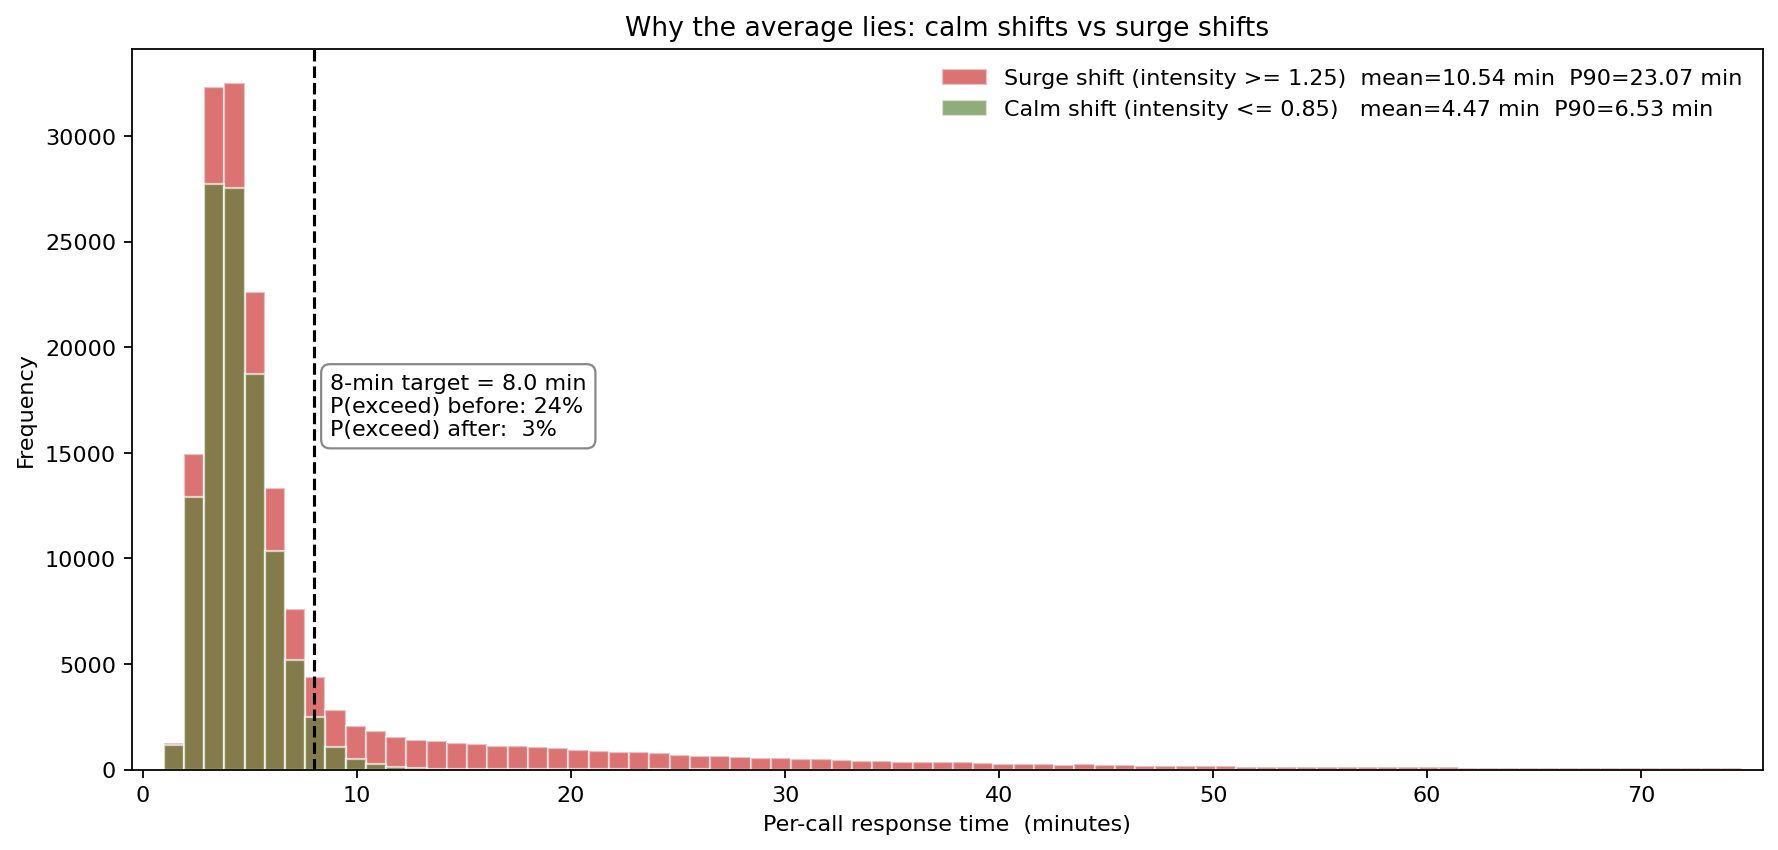
Splitting shifts by their intensity draw shows the shared-factor effect directly. On a calm shift (low intensity) the eight-unit fleet has a mean response of 4.5 minutes and breaches the target on just 3% of calls. On a surge shift the mean climbs to 10.5 minutes, the 90th percentile to 23 minutes, and 24% of calls run late. The same fleet, the same target — the entire distribution slides right when demand bunches. Planning to the blended average plans for a shift that rarely occurs.
What drives the breach rate
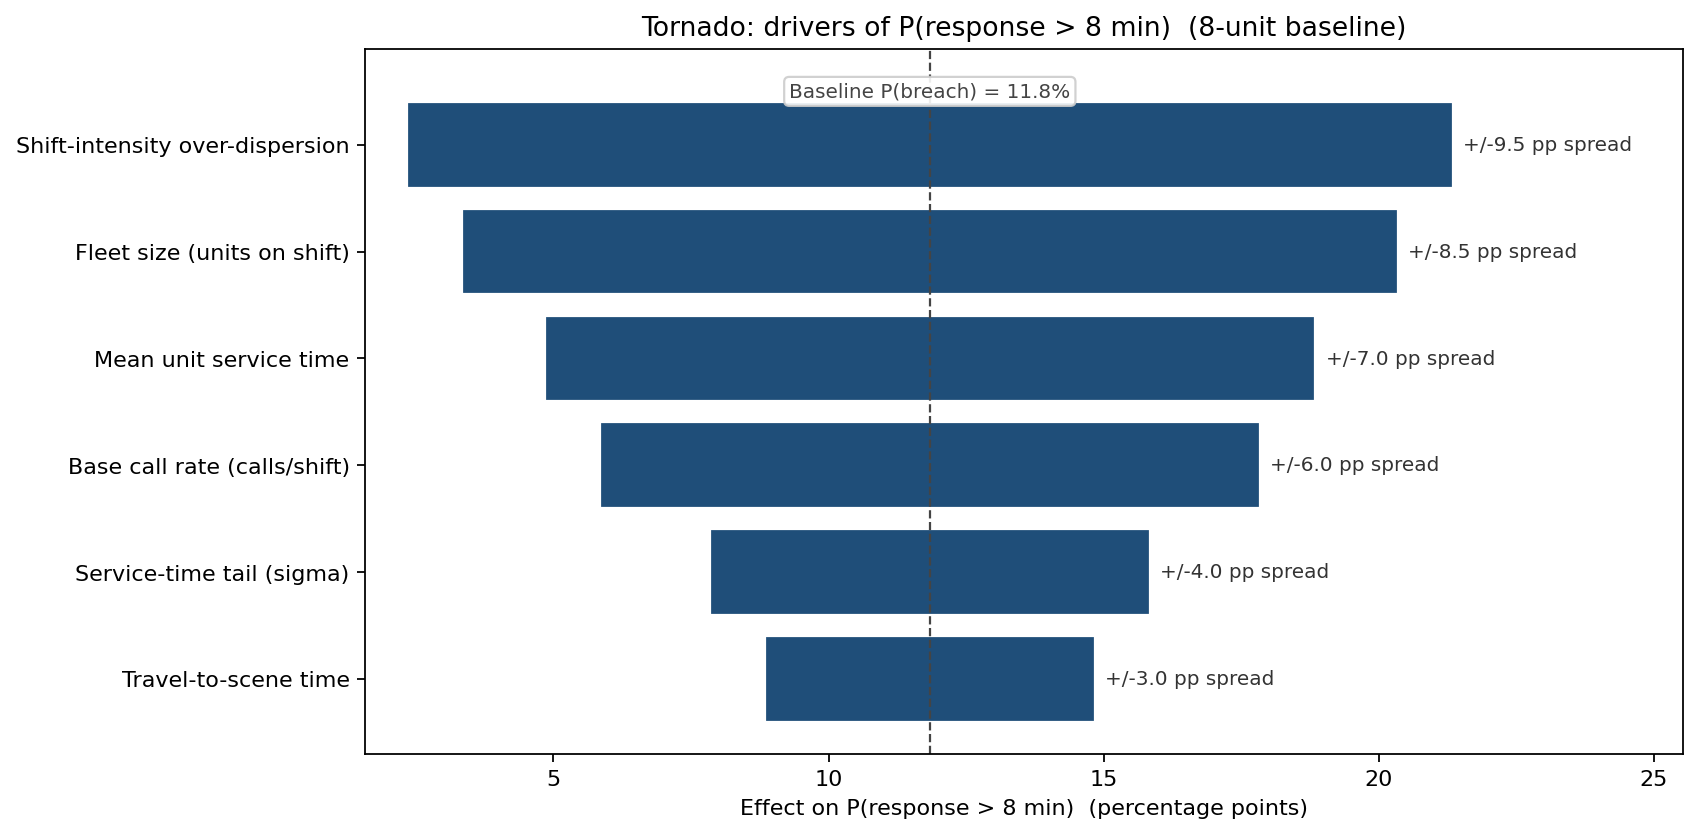
Around the eight-unit baseline (P(breach) = 11.8%), the largest single lever is shift-intensity over-dispersion — the bunching of demand — followed closely by fleet size and mean unit service time. The base call rate matters; the service-time tail and travel time matter less. The ranking is the operational playbook: smoothing demand peaks (dynamic deployment, mutual-aid surge units) and shortening unit-busy time (faster hospital turnaround) move the breach rate as effectively as buying ambulances — and often more cheaply.
What the model changed
- Shift fleet raised from 8 to 10 units on the high-demand watches, sized to hold the shift-level reliability target rather than the calm-day average — the simulation showed eight units breaching 12% of calls where the deterministic plan predicted comfort.
- A two-unit surge tier activated by a real-time intensity trigger, targeting the surge shifts that carry 24% of the breaches rather than over-staffing every shift.
- Hospital-handoff reduction program prioritized after the tornado ranked mean service time alongside fleet size — cutting unit-busy time frees capacity without new vehicles.
- The SLA was re-expressed probabilistically — "P(response > 8 min) below 10%" — so future budgets are argued against the breach curve, not a single average.
ModelRisk functionality used
- Discrete-event multi-server queue simulation across 8,000 shifts — Poisson arrivals under a Gamma shift-intensity factor, LogNormal service and travel times — producing the full response-time distribution the deterministic model cannot.
- Fleet-size sweep generating the breach-probability-versus-units curve directly from one engine, locating the 9- and 10-unit thresholds and the point of diminishing return.
- Conditional (calm vs surge) distribution comparison isolating the shared-intensity effect that drives the tail.
- Tornado sensitivity ranking demand bunching, fleet size and service time as the controllable levers.
A fleet sized to the average call rate is a fleet sized for the shift that never tests it. ModelRisk is what shows that the eight ambulances that look sufficient on paper run one call in nine past the target — and that the fix is one or two units, plus the smoothing of the peaks that cause the misses.