

Industry: Environmental
Product: ModelRisk
Application: Quantifying the impact of sustainable practices under uncertainty
The Energy-Efficiency Audit Promised $5.8M a Year -- the Program Has Only a 72% Chance of Clearing the $4.0M KPI
A multinational manufacturer's sustainability team assembled a six-measure resource-efficiency program -- LED and lighting controls, an HVAC retrofit, motor variable-speed drives, process heat recovery, water reuse, and building-management optimisation. The engineering audit added up the claimed annual savings to $5.8M a year against roughly $9.9M of capex, implying a simple payback under two years. On that single line the board approved the program and committed publicly to a $4.0M/yr savings KPI and a 3-year payback target. The flaw was the word claimed: audited savings are what a measure delivers if it is commissioned perfectly, tuned, and never drifts. Real programs realise a fraction of the audit, and they do so coherently -- a poorly-run rollout under-delivers on every measure at once.
The team rebuilt the program in ModelRisk as a portfolio of measures, each with an uncertain capex, an uncertain audited saving and a realisation factor, all scaled by a shared execution-quality factor. The first output was the distribution of total realised savings against the KPI.
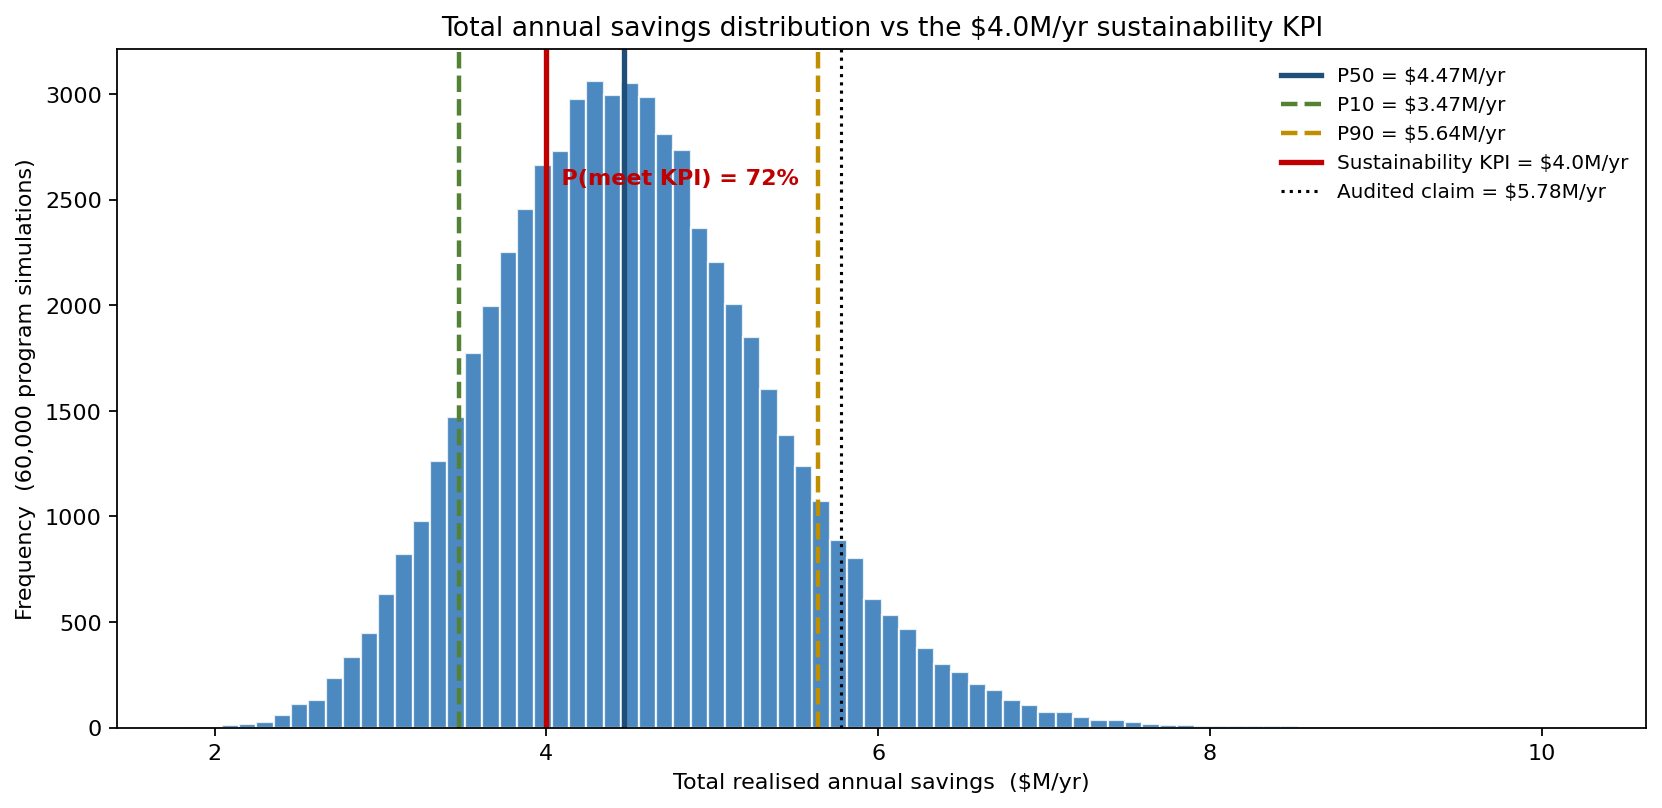
Against the audited claim of $5.8M/yr, the realised total lands well short: P50 = $4.47M/yr, with a band from P10 = $3.47M to P90 = $5.64M. The mean realised saving is 78% of the audited claim -- a 22% realisation haircut the single line never showed. And against the public KPI: the probability of clearing $4.0M/yr is only 72% -- better than even odds, but a long way from the certainty the audit implied.
Why a point estimate fails
A deterministic program plan sums the audited savings and divides by capex. That treats every measure as a sure thing and, worse, as independent: if one underperforms, surely another over-delivers and it washes out. Neither holds. Each measure has its own spread -- a heat-recovery saving is far less certain than an LED retrofit -- and they do not wash out, because a single force drives all of them together: execution and commissioning quality. A program that is rushed, under-resourced or poorly verified under-delivers on lighting, HVAC, motors and controls simultaneously. The model draws a shared execution-quality factor once per program and scales every measure's realisation factor by it. The check confirms the coupling matters: the execution factor correlates +0.57 with the total saving. That common factor is what stops the portfolio total from collapsing to a tight mean -- and it is why the downside is a genuine $3.47M P10, not a statistical artefact a few tenths below the claim.
The payback test against the 3-year target
The board's second commitment was payback. Dividing total capex by total realised saving per simulation gives the program-level simple payback distribution against the 3-year target.
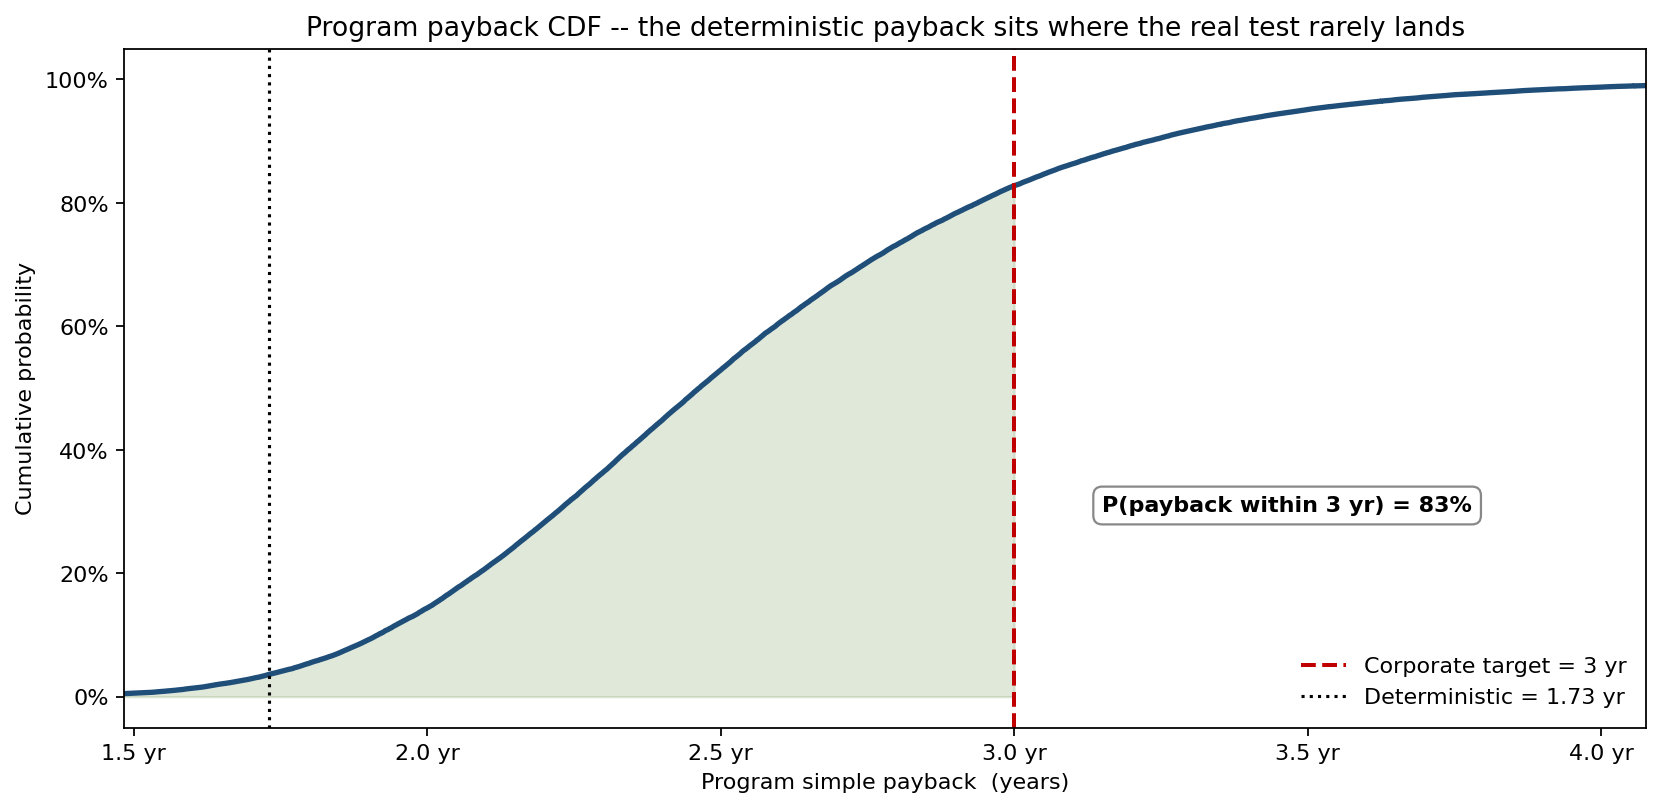
The deterministic payback was a reassuring 1.73 years. The realised distribution tells a tougher story: P50 payback = 2.46 years, with a P90 stretching to the target line, giving an 83% probability of paying back within the 3-year target. The deterministic 1.73 sits far to the left of where the real test lands -- a 17% chance the program breaches its own payback commitment, invisible to the single-point case.
What drives the savings spread
The tornado ranks the one-at-a-time P10-to-P90 swing of each input on total annual savings.
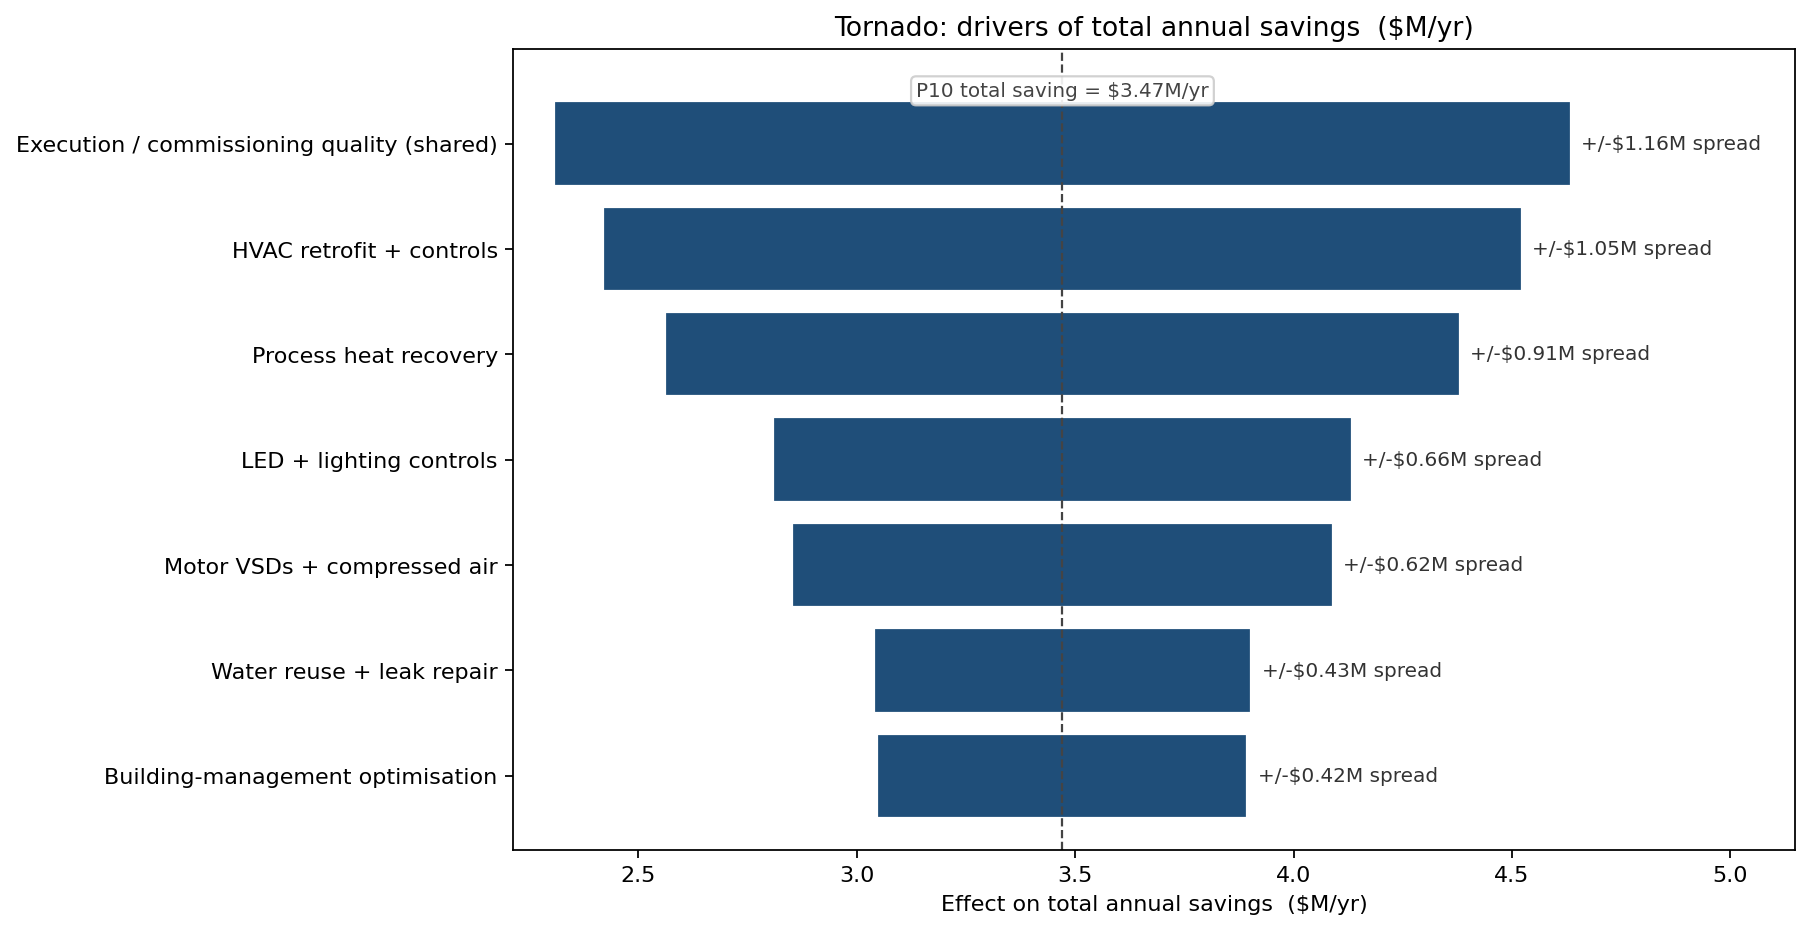
The shared execution-and-commissioning quality is the single largest driver, moving total savings by $1.16M across its range -- larger than any individual measure -- followed by the HVAC retrofit ($1.05M) and process heat recovery ($0.91M), the two measures with the most uncertain savings. The finding is directly actionable: the highest-return risk control is not picking different measures, it is investing in commissioning, verification and tuning that lifts execution quality across the whole portfolio at once.
Where the realisation haircut falls
Averaging the realised saving against the audited claim for each measure shows where the 22% gap concentrates.
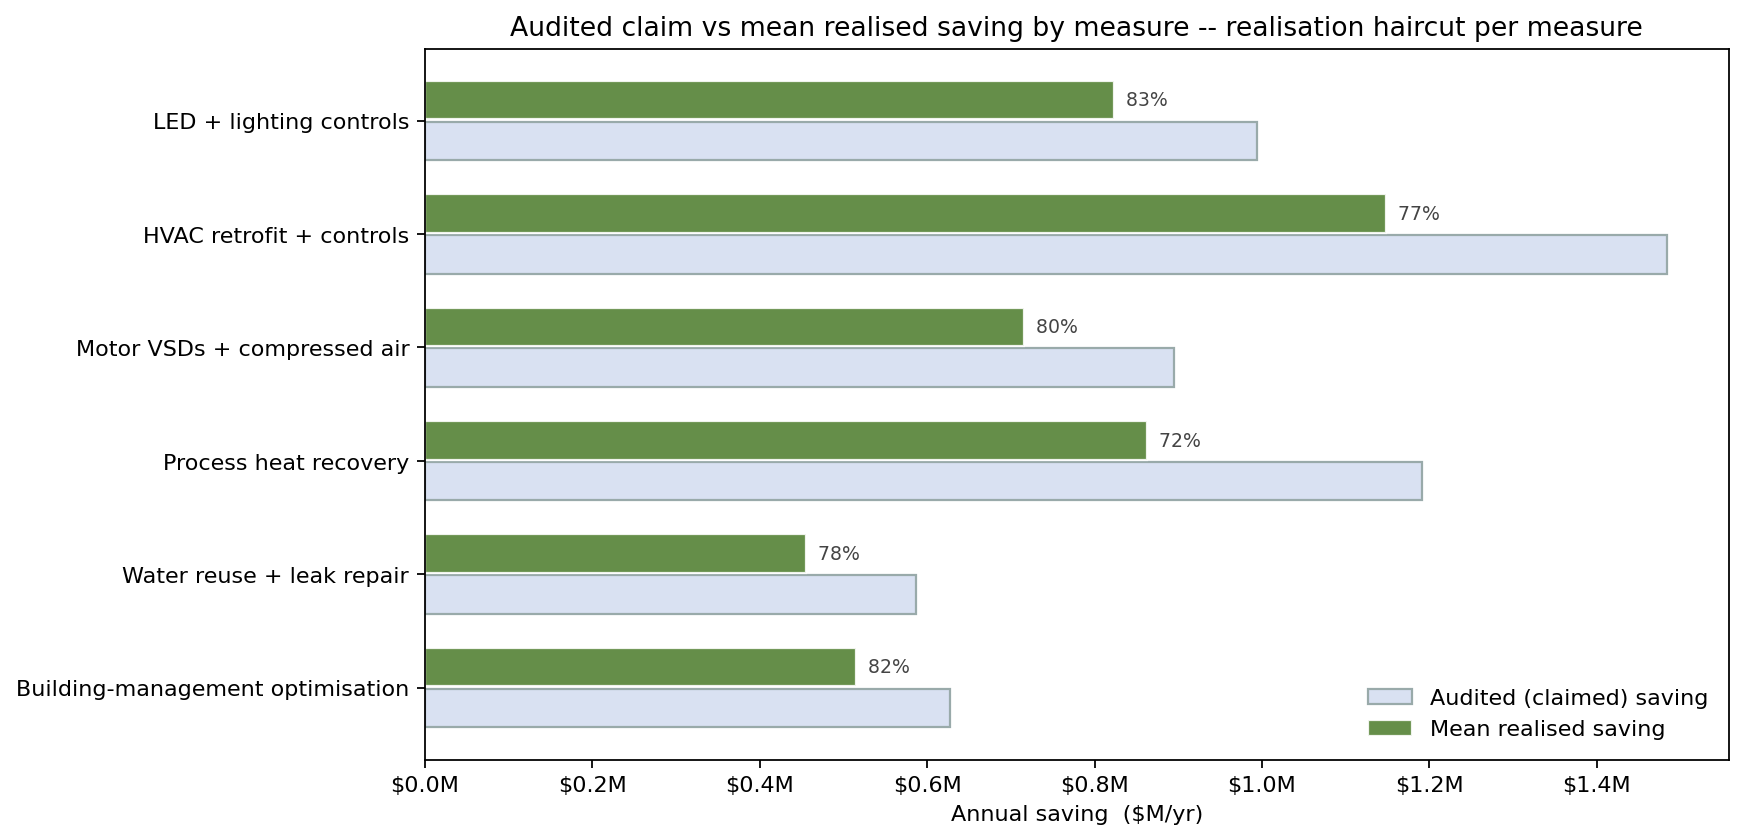
The realisation rate ranges from 83% on LED and lighting controls -- the most predictable measure -- down to 72% on process heat recovery, with HVAC at 77% and water reuse at 78%. The measures with the most complex commissioning lose the most against their audit, which is exactly where the verification budget should be concentrated rather than spread evenly.
What the model changed
- The board KPI is now reported with its 72% achievement probability and the $4.47M P50, replacing the $5.8M audited headline.
- A 22% realisation haircut is applied by default to audit-claimed savings in the business case, calibrated per measure rather than program-wide.
- Commissioning and verification spend was increased, because execution quality is the single largest savings driver in the tornado.
- The verification budget was concentrated on heat recovery and HVAC, the measures with the largest realisation haircut, rather than spread evenly across the portfolio.
ModelRisk Functionality Used
- Monte Carlo simulation of a six-measure efficiency program across 60,000 program simulations, each measure with uncertain capex, audited saving and realisation factor.
- A shared execution-quality factor scaling every measure's realisation together, so the portfolio total retains its spread rather than collapsing to the mean.
- Distribution choices matched to each input -- LogNormal audited savings, Triangular capex, Beta realisation factors -- with a derived program payback.
- Threshold probabilities for the $4.0M/yr KPI and the 3-year payback target, turning two public commitments into quantified probabilities.
- Tornado sensitivity and an audited-vs-realised decomposition to rank the drivers and locate the realisation haircut by measure.
For an efficiency program, the audit total is a ceiling, not a forecast -- and the 22% gap between the claimed $5.8M and the realised $4.47M P50 is the difference between a KPI that looks locked in and one with a real one-in-four chance of being missed.