

Industry: Environmental
Product: ModelRisk
Application: Pollution control and discharge-permit compliance under uncertainty
The Design Sheet Said 2.6 mg/L. The Plant Still Breached the Permit on 13 Days a Year.
An industrial wastewater plant discharges through a three-stage treatment train — primary clarifier, biological secondary, tertiary polishing — under a permit that caps the effluent at 12 mg/L on any single day. The design spreadsheet takes the nominal influent concentration, applies each stage's nameplate removal efficiency, and reports an effluent of 2.6 mg/L: less than a quarter of the limit, comfortably compliant, no upgrade justified.
Simulate the same train day by day with realistic variability in influent load and removal performance — and with the coupling that a high-load shock day raises the influent and degrades every stage at once — and the average effluent is still a reassuring 3.6 mg/L, but the plant breaches the 12 mg/L daily limit on 13 days a year on average, with a 55% chance of exceeding its enforcement budget. The operator rebuilt the compliance assessment in Vose Software's ModelRisk, because a permit is enforced on the plant's worst days, not its average one.
Why a point estimate fails here
Effluent concentration is multiplicative: C_eff = C_influent × (1 − r₁) × (1 − r₂) × (1 − r₃). A point estimate plugs the mean influent and the mean removals into that product and reports a single low number — but discharge limits bite in the upper tail, where a high influent coincides with depressed removals. The two are not independent. A storm inflow, a batch dump or a toxic upset simultaneously raises the influent load and knocks back the biological stage's removal fraction: the plant is hit from both sides on exactly the days it can least afford it. A model of independent stages averages those shocks away and reports a tail far thinner than the regulator will observe.
The team modelled influent as LogNormal, each stage's removal efficiency as a Beta distribution in [0, 1], and introduced a shared daily load/upset regime factor that both lifts the influent and degrades every stage's removal on the same day. Imposing that common factor produced a same-day influent-to-effluent correlation of 0.39; rebuilding the effluent with an independent regime for the removal stages dropped it to 0.24. The shared shock is the mechanism that makes bad days genuinely bad — the dependence a stage-independent model washes out.
The distribution behind the design number
Simulating the train across 40,000 plant-years — roughly 14.6 million plant-days — gives the headline.
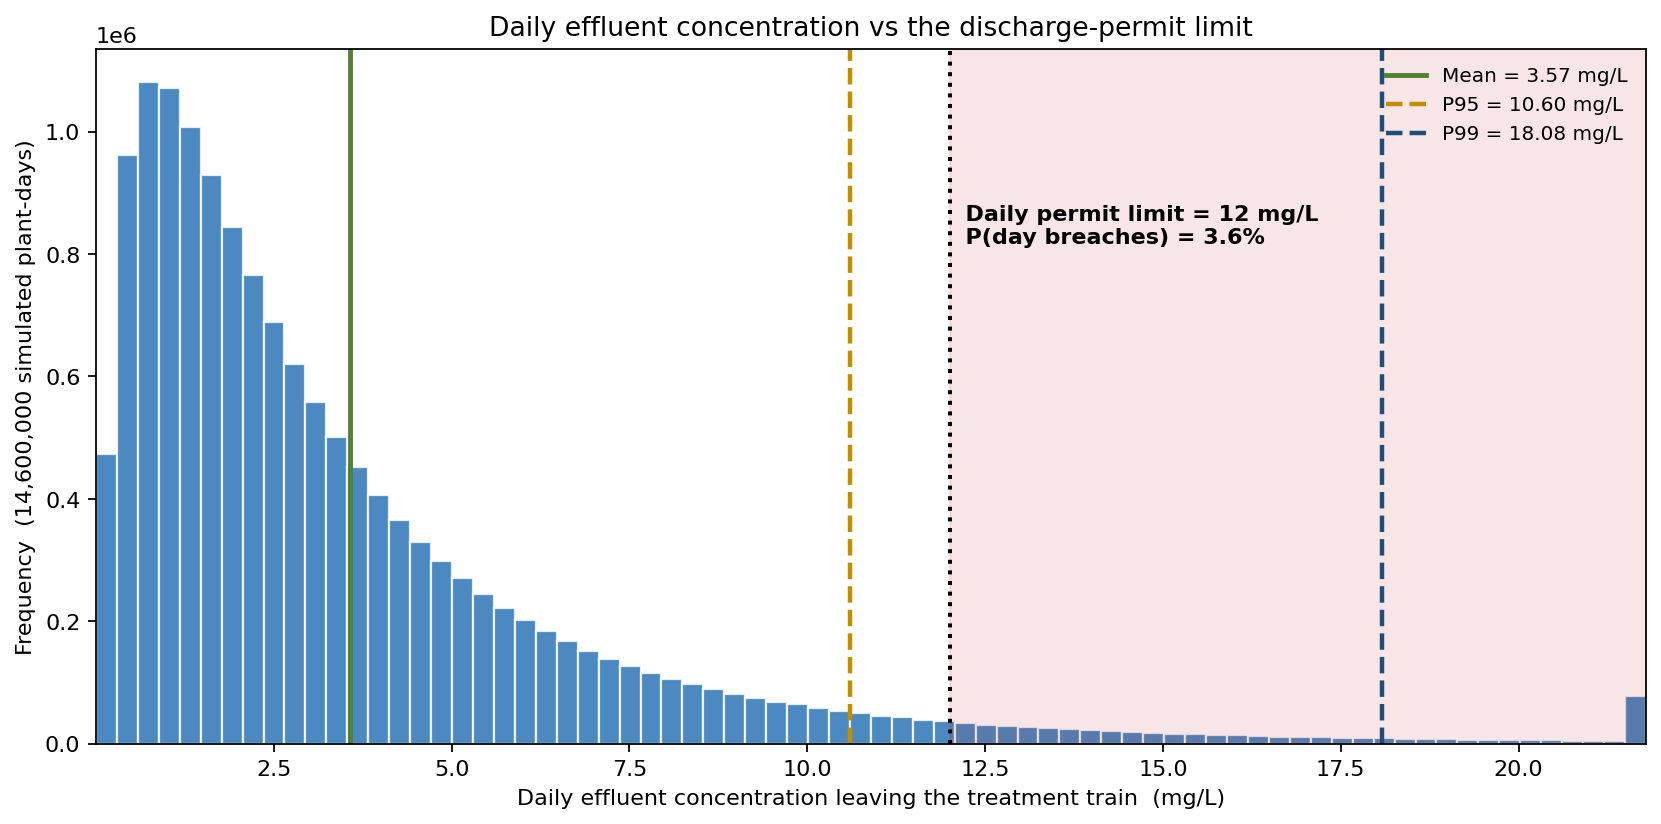
Daily effluent averages 3.57 mg/L (median 2.42), but the distribution is sharply right-skewed: the P95 is 10.60 mg/L and the P99 is 18.08 mg/L, well above the 12 mg/L permit. The probability that any given day breaches the limit is 3.6%. The deterministic design estimate of 2.61 mg/L sits near the median and reports the plant compliant — while saying nothing about the tail that the permit actually polices. The average effluent is comfortably legal; the plant is not.
How often the permit is breached
Translating the daily tail into the regulator's unit — breach days per year — gives the enforcement picture directly.
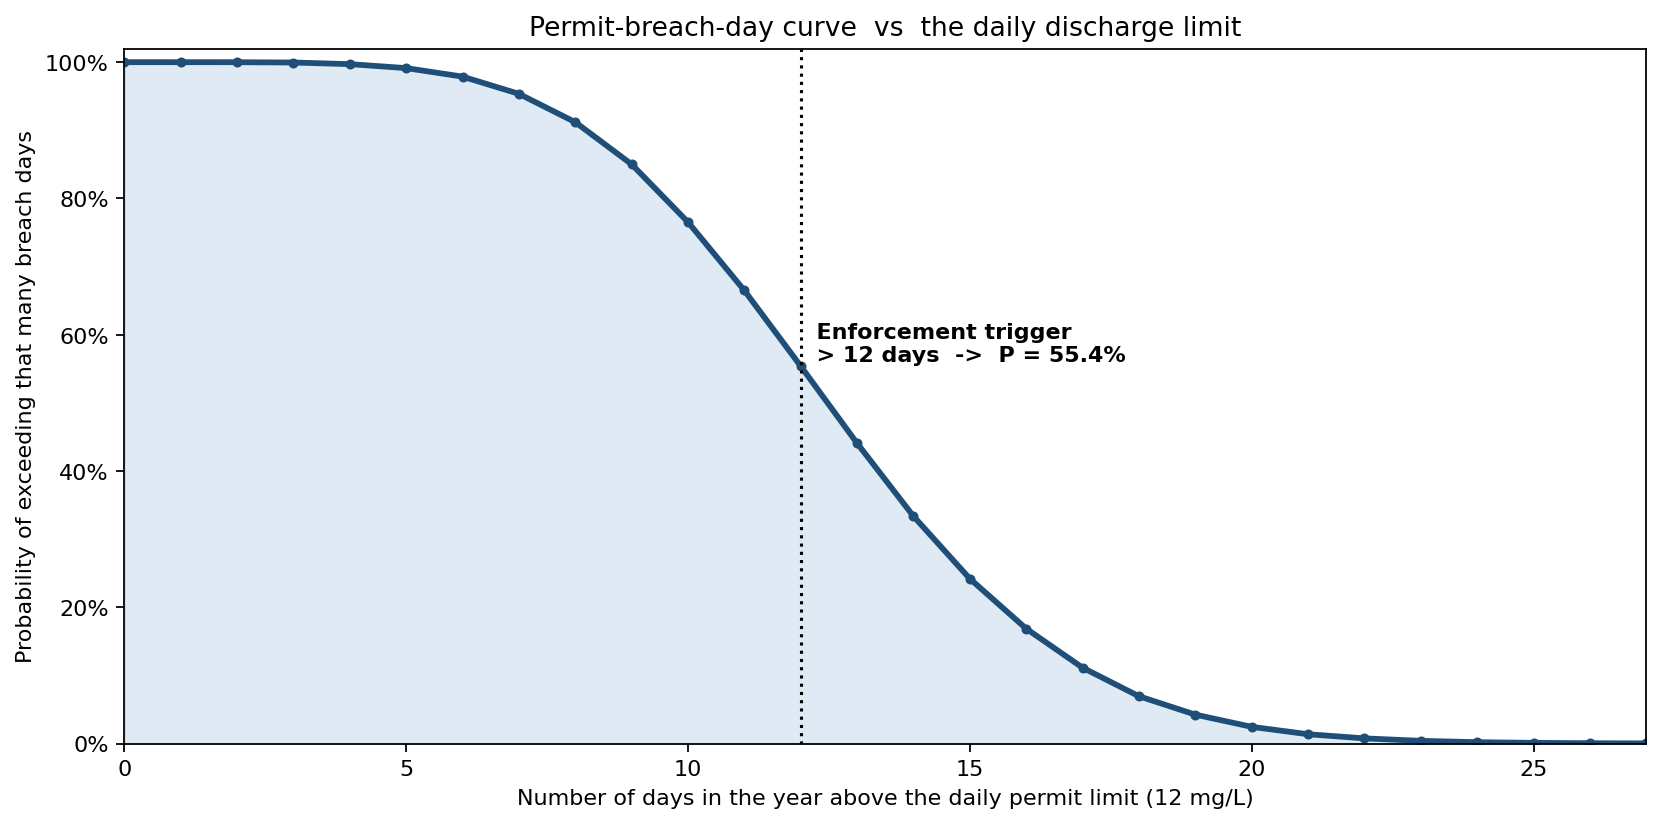
The plant averages 13.1 breach days per year, with a P90 of 18 and a P99 of 22. Reading the curve: there is a 99.1% chance of more than 5 breach days, a 76.5% chance of more than 10, and only a 2.5% chance of more than 20. Against an enforcement budget of more than 12 breach days, the probability of exceeding it is 55% — a coin flip on whether the plant draws regulatory action in a given year. The 30-day rolling-average limit of 8 mg/L, by contrast, is essentially never breached: averaging smooths the spikes, which is exactly why the daily limit, not the monthly average, is where the risk lives.
What an upgrade would actually buy
Re-running the train with each upgrade option turns capital choices into shifted distributions rather than single promised numbers.
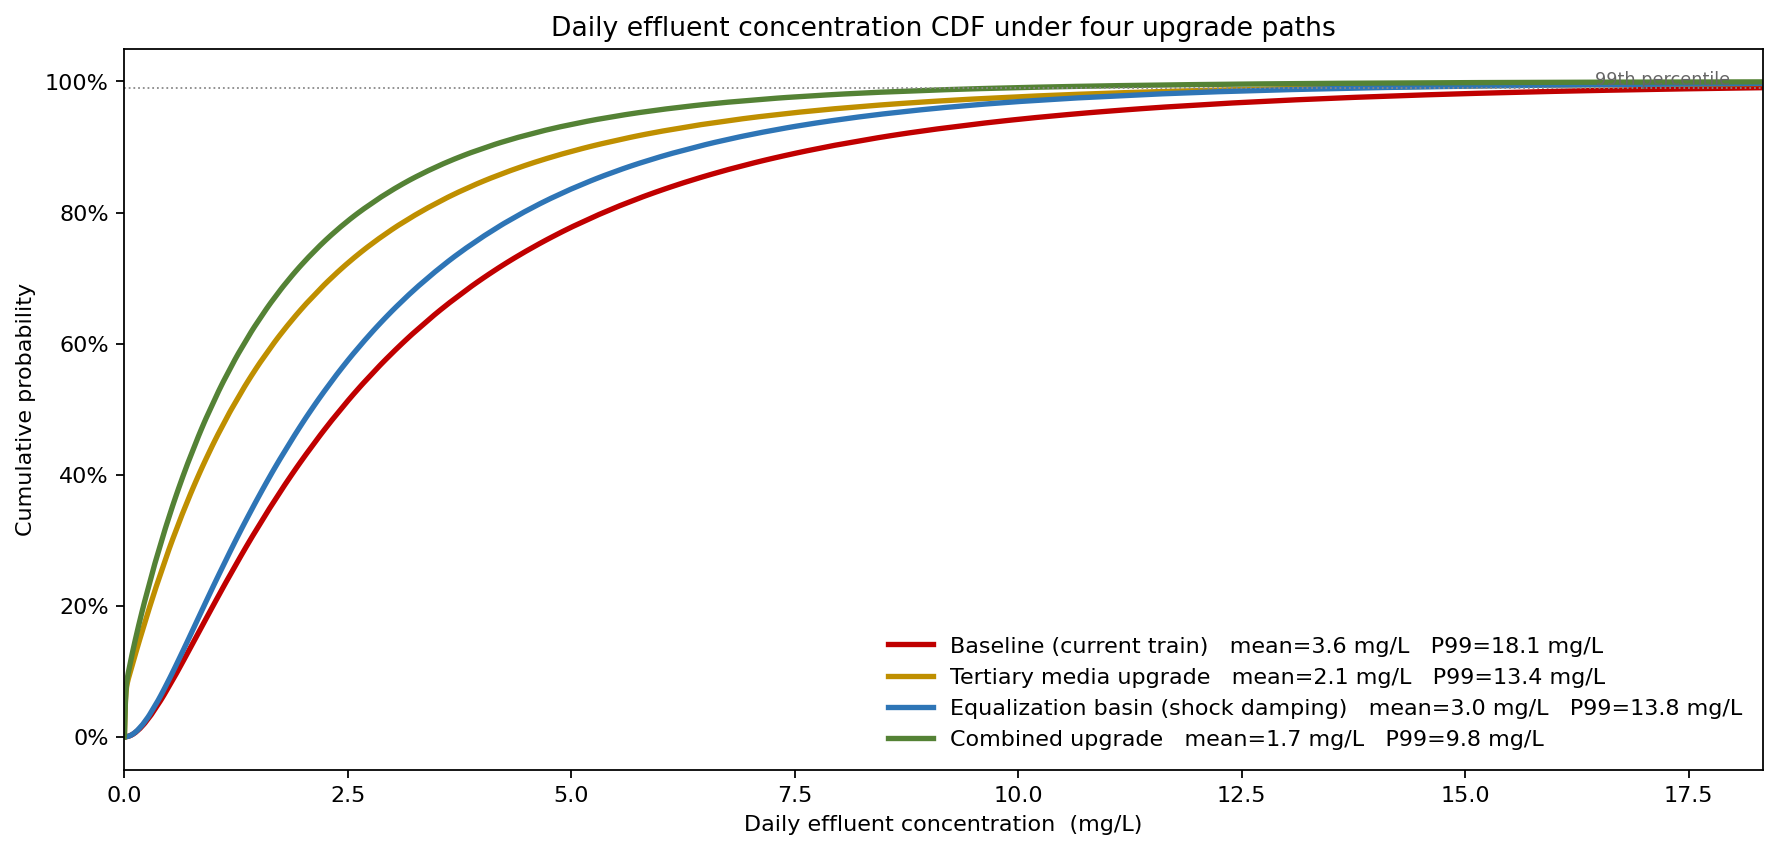
Upgrading the tertiary media cuts the daily-breach probability from 3.6% to 1.4% and the P99 from 18.1 to 13.4 mg/L. Adding an equalization basin to damp the load shocks reaches a 1.7% breach probability and a P99 of 13.8 mg/L — attacking the tail directly by smoothing the common-cause regime. The combined upgrade drives the breach probability to 0.48% and the P99 to 9.83 mg/L, finally pulling the 99th percentile under the permit limit. The CDF let the operator cost each option against the breach risk it removes, not against a design-sheet number that already looked safe.
Which assumptions move the tail
Sensitivity ranking on the P99 daily effluent shows where the breaches come from.
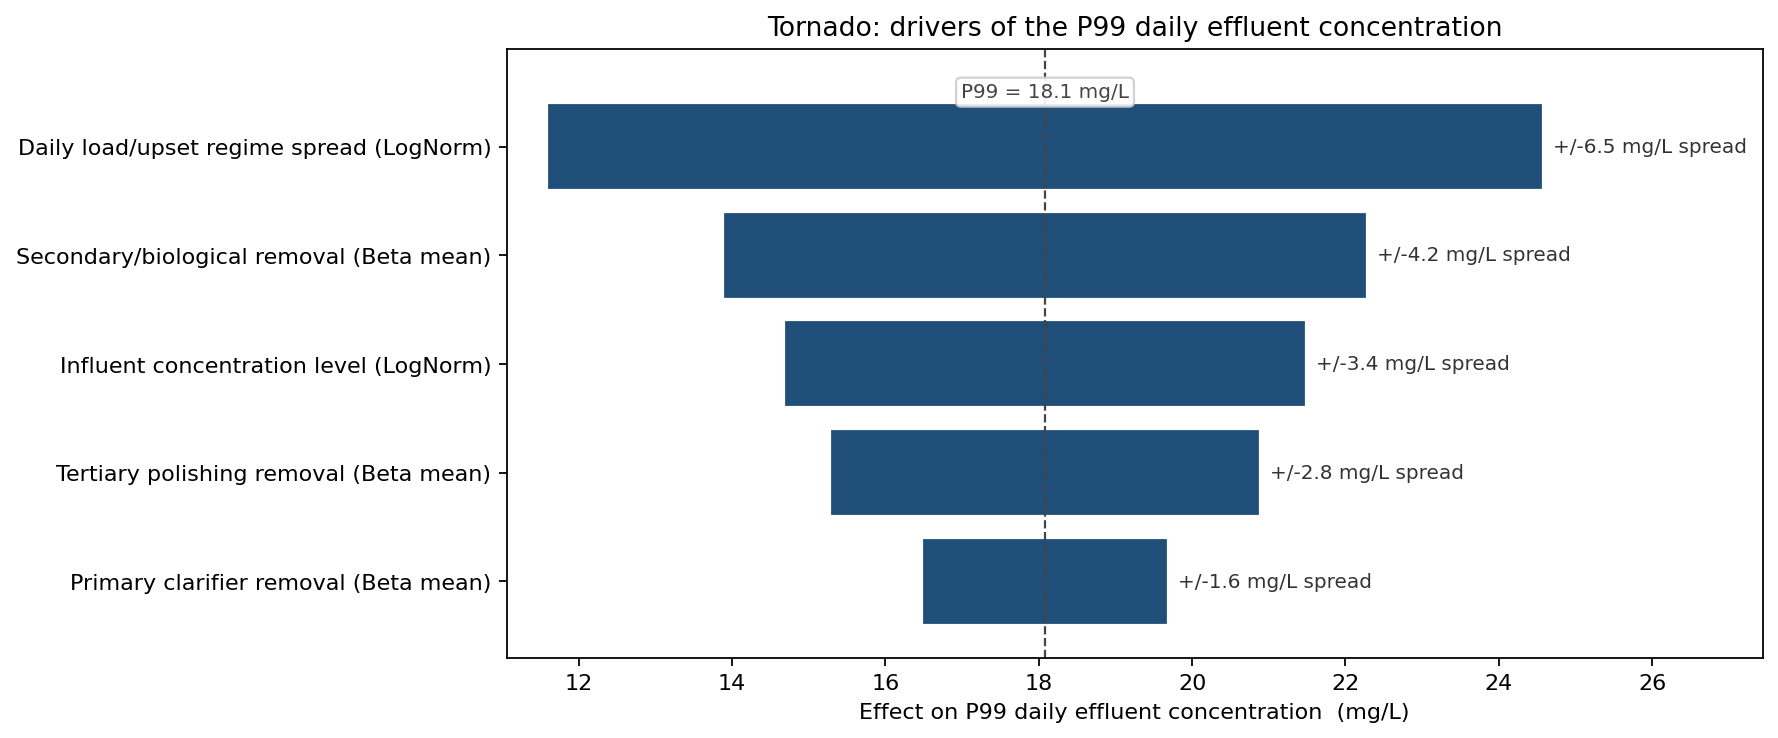
The dominant driver is the daily load/upset regime spread — the variability of the shock days themselves — at roughly ±3.2 mg/L around the 18.1 mg/L P99. The secondary/biological removal efficiency comes next, then the influent level. Because the regime factor is what couples influent and removals, it moves the tail more than any single stage's nominal performance. That ranking is why the equalization basin, which targets the regime shock rather than any one stage, is so effective in the scenario CDF.
What the model changed
- Reported compliance flipped from "safe" to "55% chance of an enforcement breach." The deterministic 2.6 mg/L design number sat far under the limit; the simulation surfaced 13 breach days a year and a coin-flip on the enforcement budget.
- The right limit was identified. The daily maximum, not the comfortably-met 30-day average, is where the risk concentrates — refocusing the operator on spike control.
- Capital was directed at the shock, not just the stages. Because the upset regime drove the tail, the equalization basin (shock damping) earned its place alongside the tertiary-media upgrade; only the combined package pulled the P99 under 12 mg/L.
- The stage-independence shortcut was retired. Coupling influent and removals through a shared regime raised the influent-effluent correlation from 0.24 to 0.39 — the difference between a tail the regulator sees and one the old model hid.
ModelRisk Functionality Used
- Monte Carlo simulation of 40,000 plant-years of daily operation, propagating influent and per-stage removal variability through a serial treatment train to the effluent concentration.
- LogNormal influent and Beta removal efficiencies keeping concentrations non-negative and every stage's removal fraction within [0, 1], with a shared daily regime factor coupling influent and removals on shock days.
- Exceedance / threshold outputs computing P(daily effluent > 12 mg/L), the full breach-day-count distribution, and the worst-month rolling-average test.
- Scenario comparison running four upgrade configurations through the identical engine to produce the side-by-side effluent CDF.
- Tornado sensitivity ranking the drivers of the P99 effluent and isolating the load/upset regime as the dominant tail driver.
A treatment train assessed on its average effluent is a forecast of one well-behaved day. Assessed as a distribution in ModelRisk, it forecasts the worst days a permit is written to catch — and the capital required to keep them inside the line.