

Industry: Environmental
Product: ModelRisk
Application: Contaminated-site remediation cost and schedule against budget and the regulatory deadline
A $21.6M, 1.9-year cleanup plan had a 44% chance of busting its $26M budget — and cost and schedule went bad together
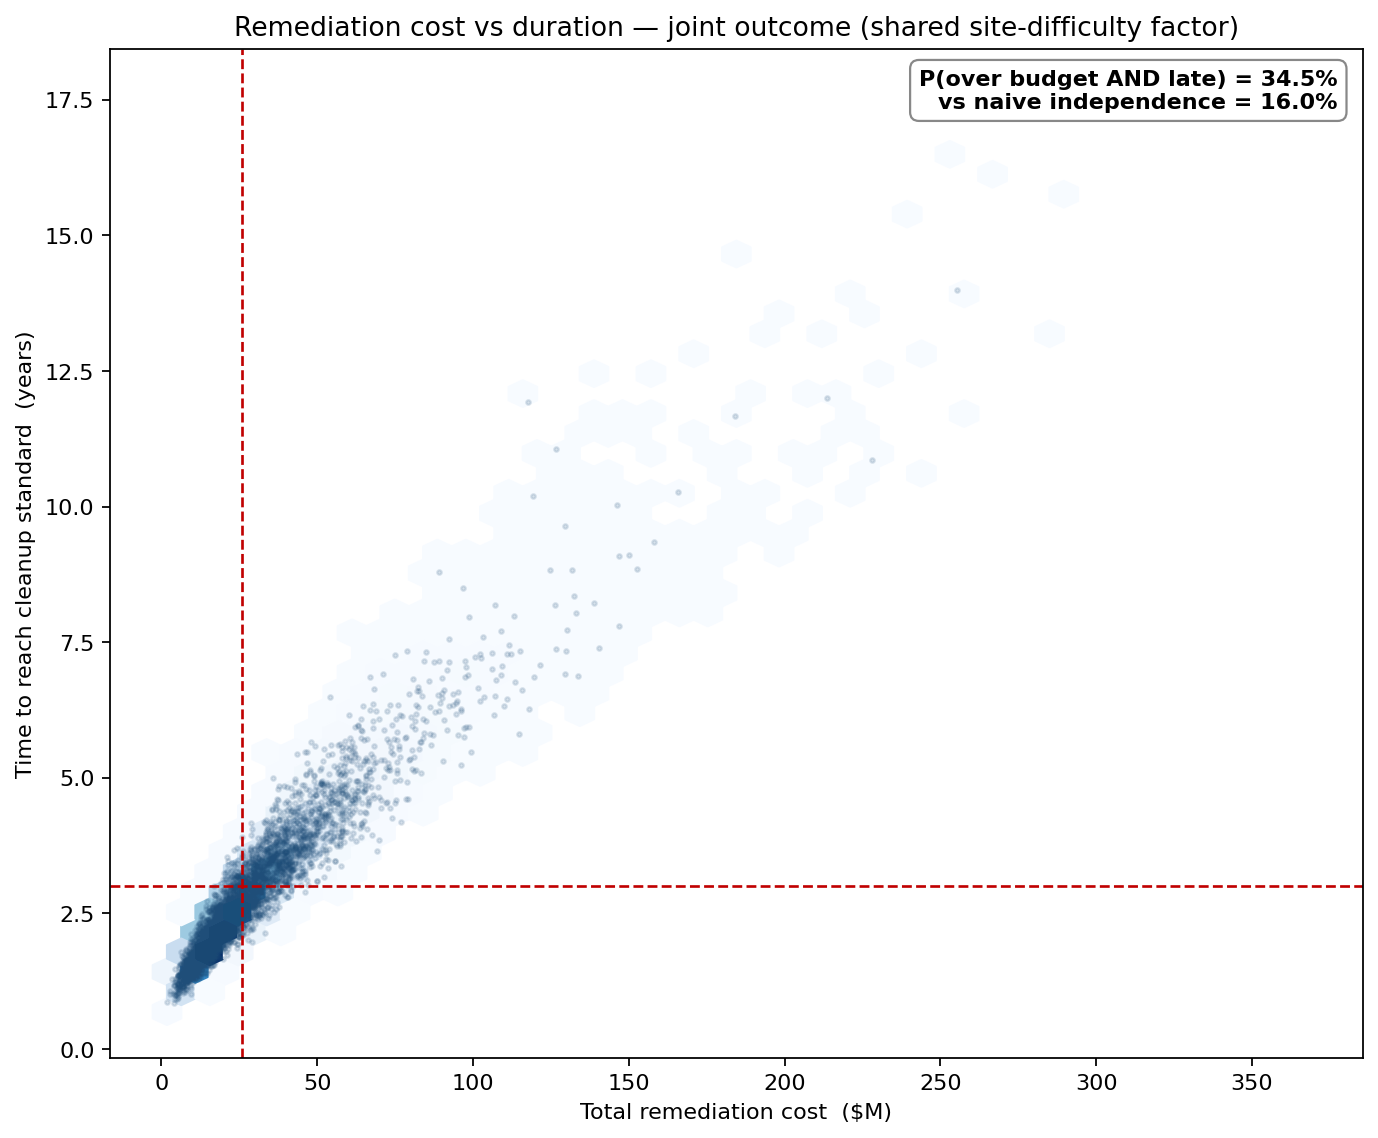
A consulting firm bid a contaminated-site remediation at a deterministic $21.6M over 1.9 years: roughly 120,000 m³ of impacted soil and groundwater, treated at 250 m³/day at $180/m³. Against a $26M budget and a 3.0-year regulatory deadline, the plan looked safe on both axes. A Monte Carlo model of the uncertain volume, treatment rate, unit cost and rework risk put the mean cost at $29.1M — already over budget — with a 44% probability of exceeding the $26M budget and a 36% probability of missing the 3.0-year deadline. Worse, the two failures were not independent: the probability of being over budget AND late at the same time was 34.5%, more than double the 16.0% that independence would predict.
Why two separate point estimates miss the real exposure
The temptation is to estimate cost and schedule as two independent figures. But on a remediation site they are driven by the same hidden variable: how geologically difficult the site turns out to be once excavation starts. A hard site is bigger than delineated, dearer per cubic metre to treat, slower to process, and more likely to fail confirmation sampling and require a rework pass — all at once.
We made that explicit with a single per-project site-difficulty factor (LogNormal, sigma_log 0.28) that scales the contaminated volume, the unit treatment cost, and the rework probability together, and slows the treatment rate. Volume itself is LogNormal around 120,000 m³ (subsurface plumes are routinely under-delineated, so the tail is long); unit cost is Triangular(150, 180, 240) $/m³; treatment rate is Triangular(180, 250, 300) m³/day; and a difficulty-dependent Bernoulli rework triggers a dearer second pass over a Triangular(10%, 25%, 45%) fraction of the volume. The shared factor produces a verified Spearman correlation of 0.95 between final cost and final duration — so the joint tail, where both blow out together, is 2.1× fatter than a naive independent-risk register would show. That joint tail is precisely where contractual penalties, regulatory escalation and reputational damage all land at once.
The cost tail the bid didn't price
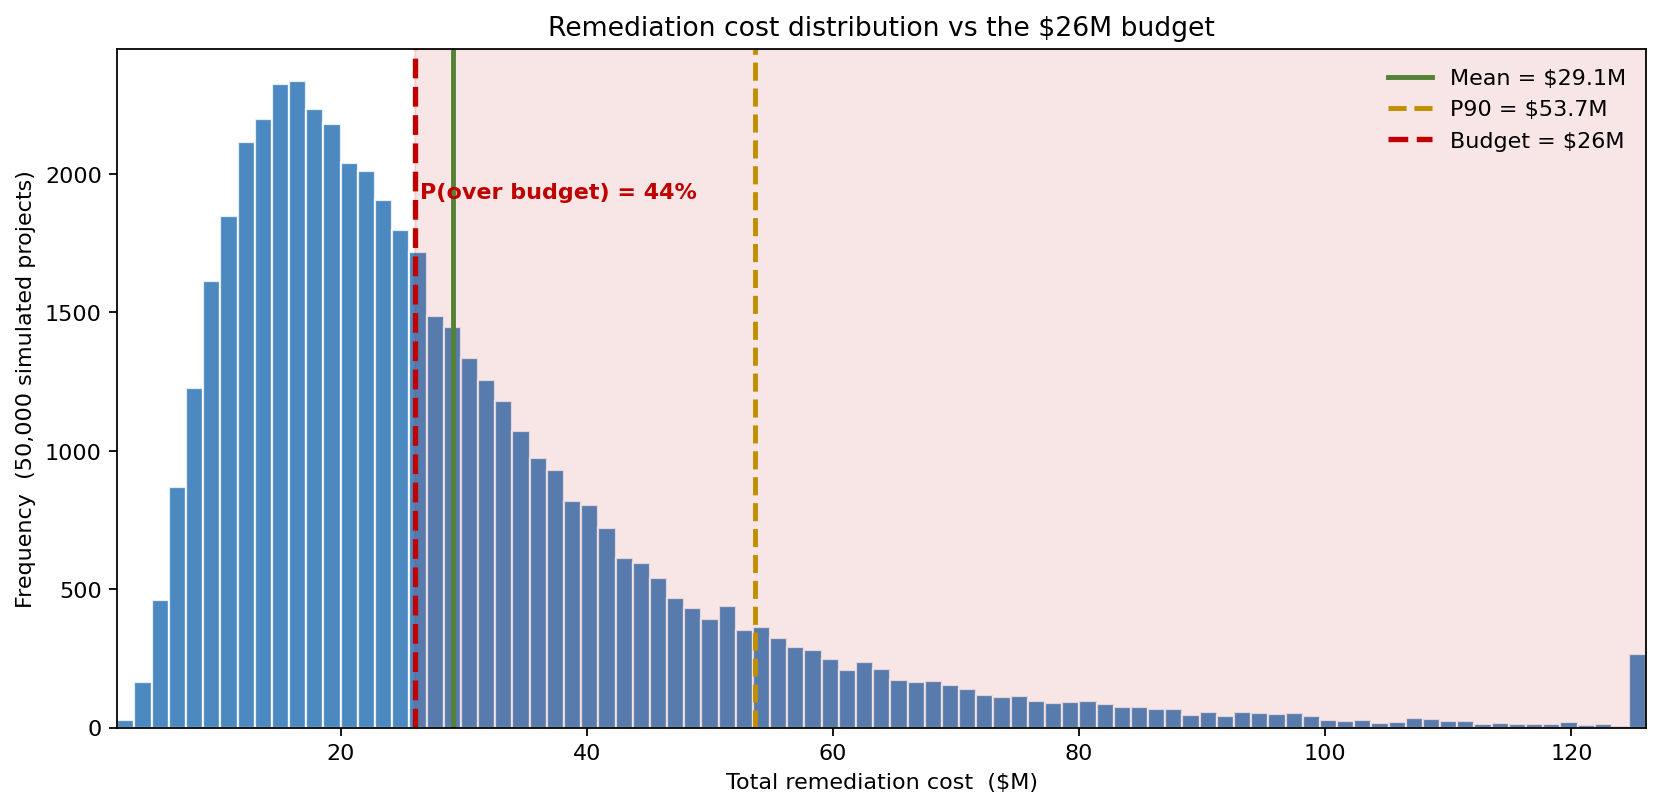
The cost distribution is heavily right-skewed: a median of $23.7M sits below the $29.1M mean, and the P90 reaches $53.7M — more than double the deterministic bid. The shaded region beyond the $26M budget line is the 44% over-budget probability. The skew is the signature of the shared difficulty factor compounding through volume, unit cost and rework simultaneously; a symmetric "±10%" contingency on the $21.6M point estimate would have covered almost none of it.
When does the site actually meet the standard?
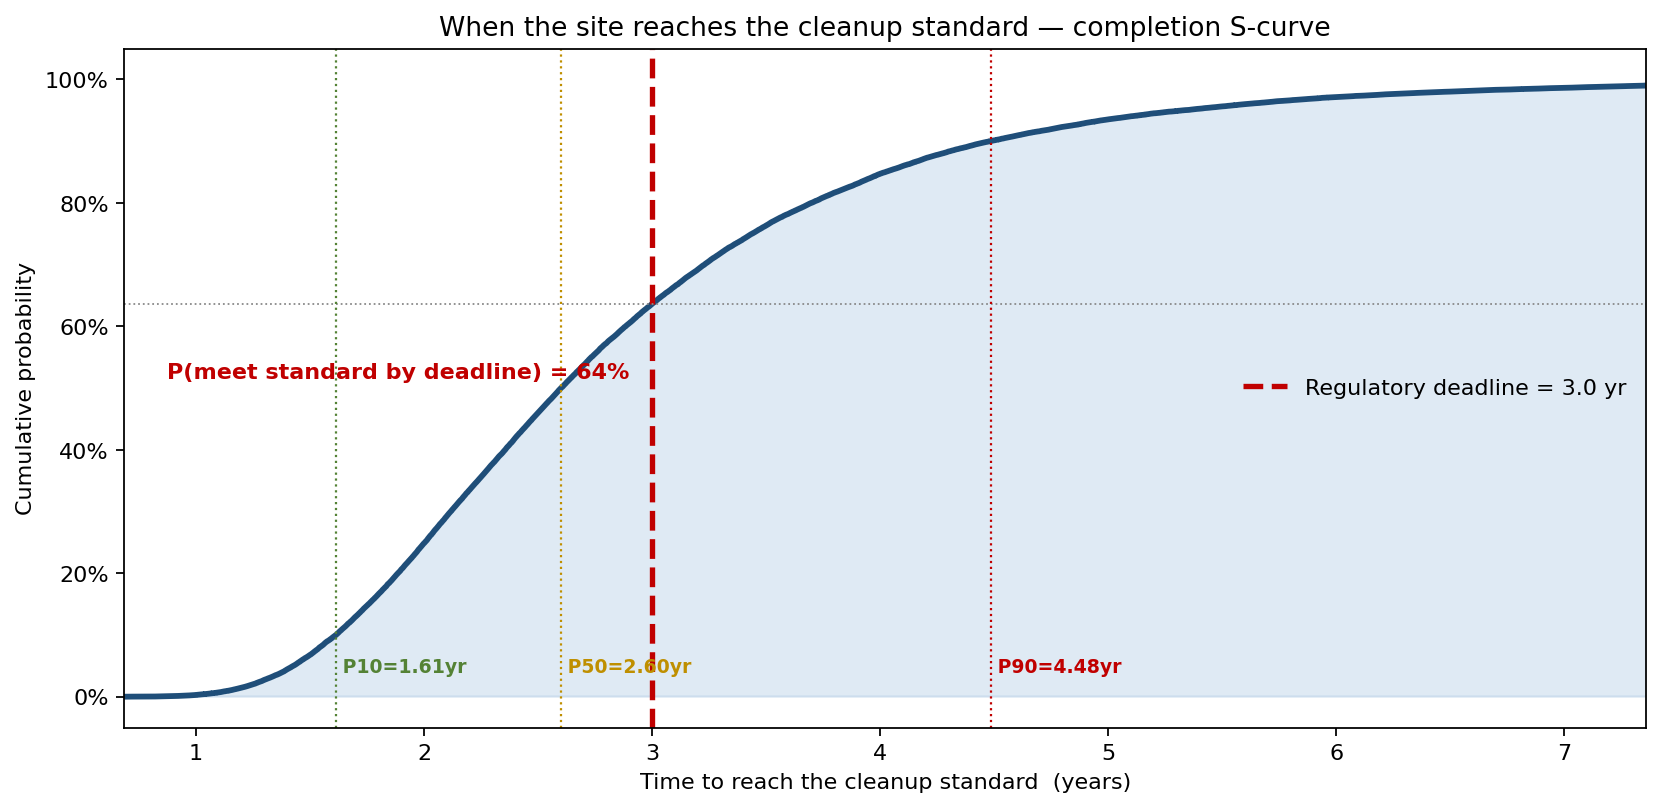
Time to reach the regulatory cleanup standard runs P10 1.61 years, P50 2.60 years, P90 4.48 years against the 3.0-year deadline. Read off the S-curve, only 64% of projects meet the standard by the deadline — the gap between the 1.9-year plan and the 2.60-year median is the rework passes and mobilisation/permitting time the deterministic schedule simply omitted. The long right tail beyond the deadline is the same hard-site population that drives the cost overruns, which is exactly why the over-budget and late outcomes coincide.
What drives the cost
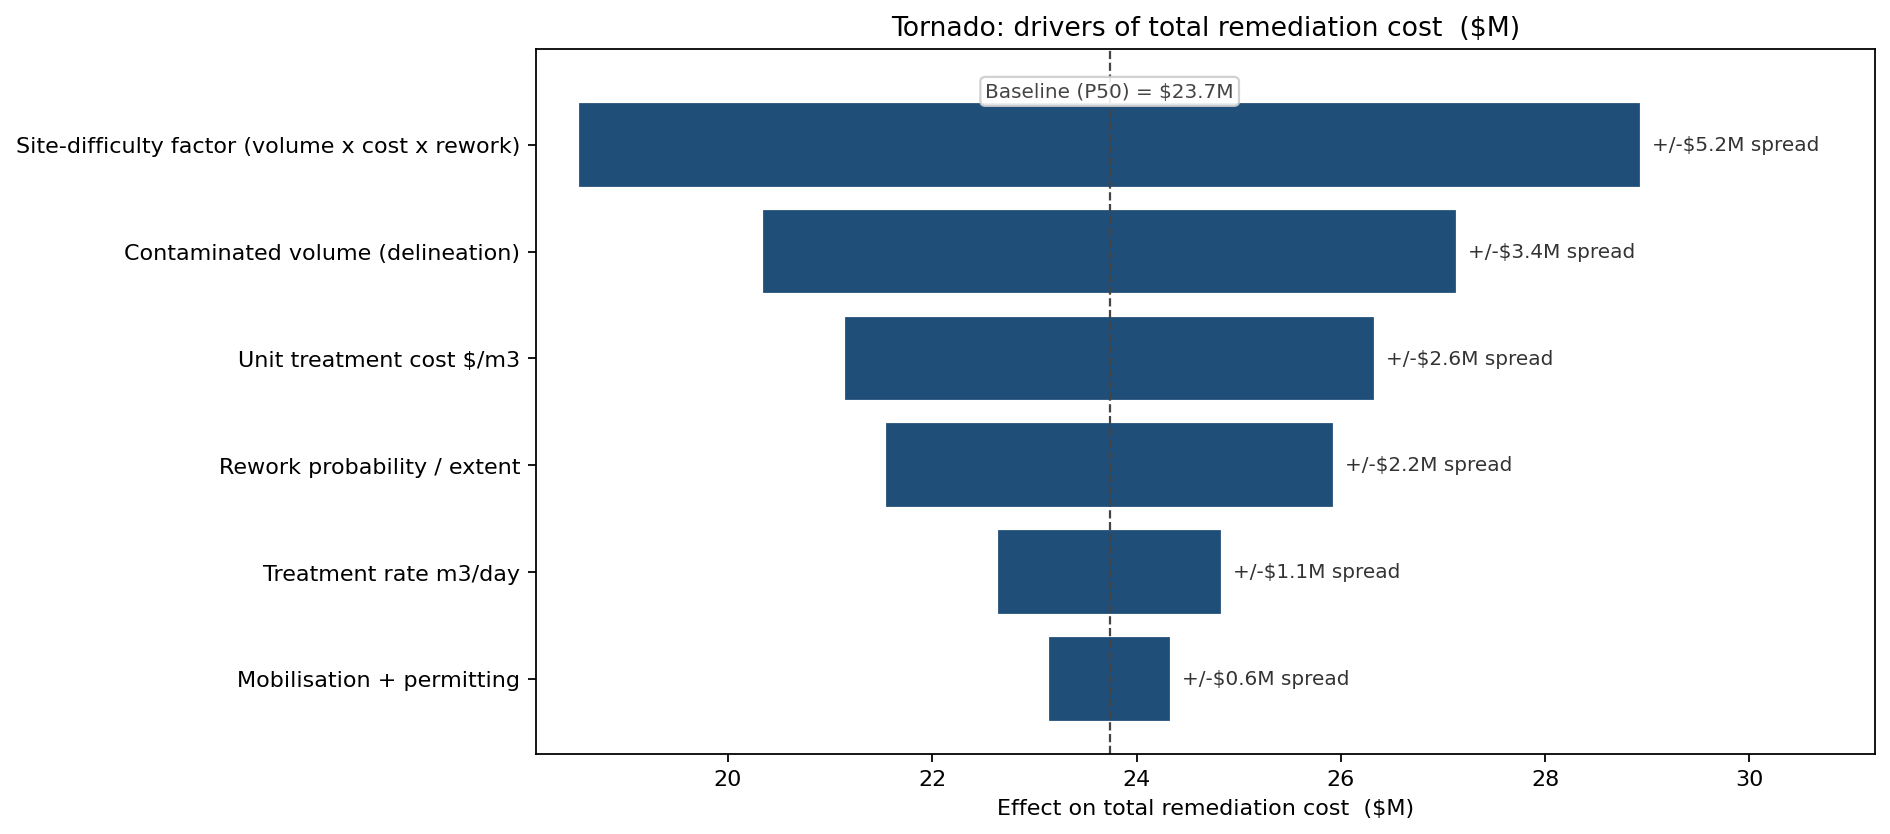
Against the $23.7M P50 cost, the site-difficulty factor is the dominant driver (±$2.6M) — because it moves volume, unit cost and rework in the same direction at the same time, it carries more spread than any single physical input. Contaminated volume (delineation quality) is second, unit treatment cost third, rework risk fourth. Treatment rate and mobilisation barely affect cost (they drive schedule, not dollars). The ranking tells the firm where pre-bid investigation pays for itself: better delineation and a site-difficulty appraisal shrink the dominant uncertainty, where shaving the daily treatment rate does not.
What the model changed
- The firm re-bid against the P70 cost (~$33M) rather than the $21.6M point estimate, and negotiated a contingency allowance sized to the joint over-budget-and-late tail rather than a flat percentage.
- A pre-construction site-difficulty investigation (additional borings and a treatability study) was commissioned specifically to shrink the LogNormal difficulty factor — the single input the tornado identified as carrying the most spread.
- The schedule submitted to the regulator carried the P80 duration with an explicit rework contingency, replacing the 1.9-year plan that had only a 64% chance of meeting the deadline.
- Cost and schedule are now reported as a joint distribution, so the board sees the 34.5% probability of both failing together — the exposure that two separate estimates had hidden entirely.
ModelRisk Functionality Used
- Single shared site-difficulty factor (LogNormal) scaling volume, unit cost, rework probability and treatment rate together — producing a verified 0.95 cost-to-duration correlation and a joint failure tail 2.1× fatter than independence.
- LogNormal volume and Triangular cost/rate inputs capturing the right-skew of under-delineated plumes and the bounded ranges of unit costs and processing rates.
- Difficulty-dependent Bernoulli rework with a Triangular reworked-fraction, adding the dearer second pass that the deterministic plan omitted and pushing the median duration from 1.9 to 2.60 years.
- Joint cost-versus-duration density quantifying P(over budget AND late) = 34.5% against a naive-independence 16.0% — the headline result of the analysis.
- Tornado analysis ranking the shared difficulty factor and delineation quality above all physical rates, directing pre-bid spend toward site investigation rather than productivity assumptions.
On a remediation site, cost and schedule are two readouts of one unknown — how hard the ground turns out to be — and pricing them as independent risks understates the probability of the only outcome that really hurts: blowing the budget and the deadline at the same time.