

Industry: Environmental
Product: ModelRisk
Application: Quantifying uncertainty in ecosystem restoration outcomes
The Plan Promised Recovery in 9 Years; the Simulation Gave the Year-15 Milestone Only a 63% Chance
A restoration consultancy has nine years on its planting schedule. The degraded site starts at 12% of the reference community — the intact, target ecosystem it is meant to become — and the deterministic plan, run at mean succession and mean planting survival with no setbacks, crosses the 70%-of-reference success criterion in year 9. The grant agreement, written against that plan, sets a year-15 reporting milestone and treats it as a formality with six years to spare.
The deterministic schedule assumes every year is an average year and no weeds ever take hold. Real restoration sites do not behave that way: a drought year stalls every cohort at once, planting survival is variable, and invasive incursions periodically knock the community back. Run the site 40,000 times in ModelRisk and the comfortable nine-year plan becomes a distribution. The median recovery takes 13 years, the P90 takes 23 years, and the probability of meeting the success criterion by the year-15 milestone is only 62.8% — better than a coin flip, but nowhere near the certainty the schedule implied. There is a 5% chance the site never reaches 70% of reference within 30 years at all.
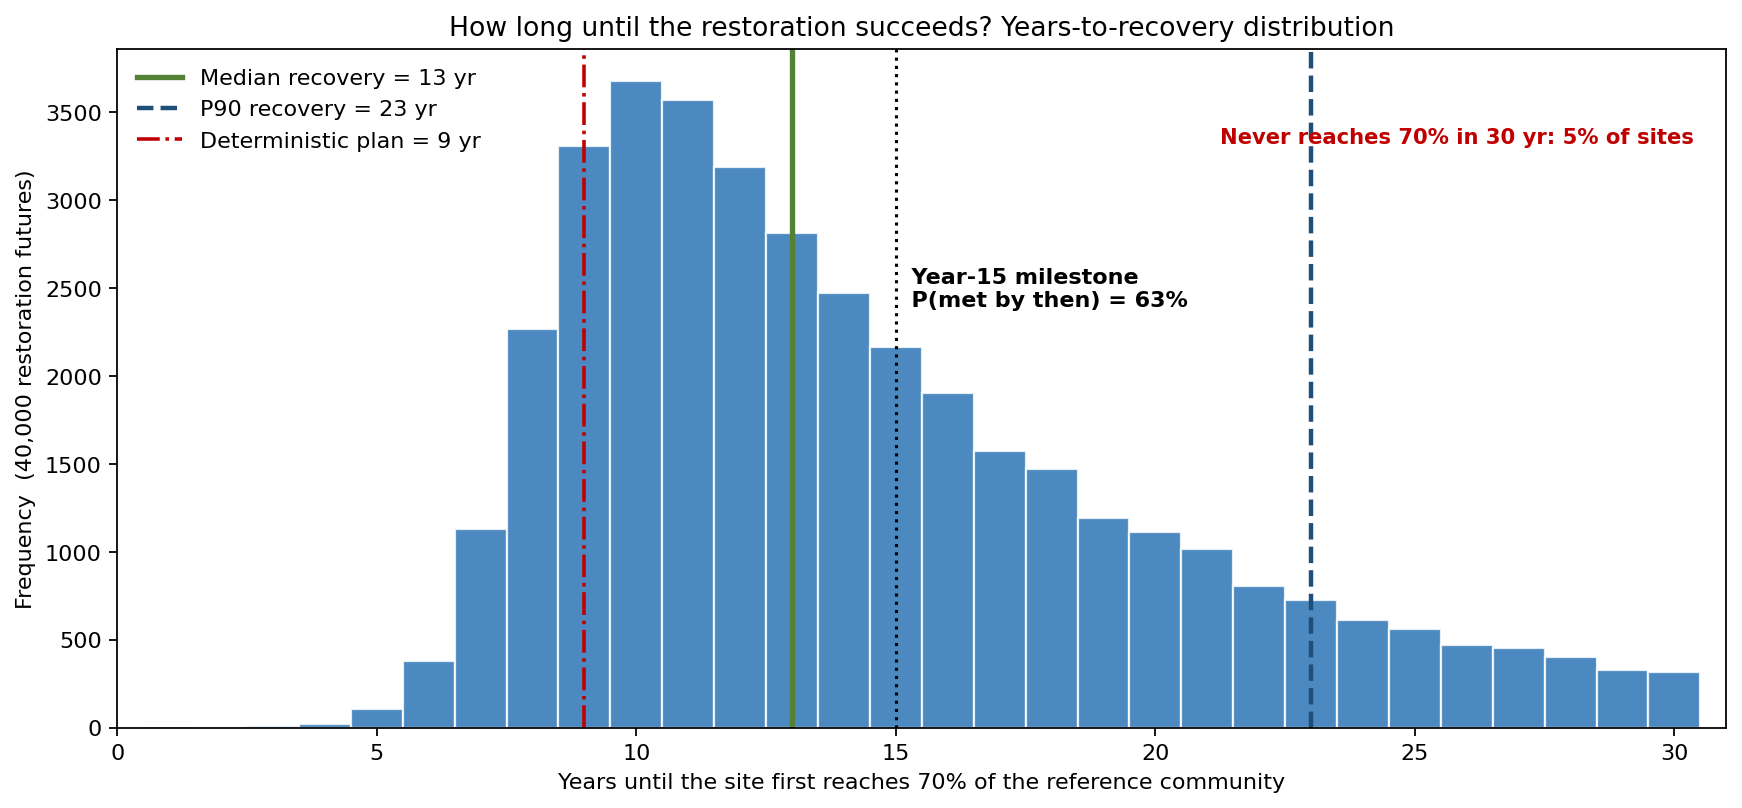
Why a single recovery date fails here
Recovery is a path, and the date you cross the finish line depends on the whole sequence of years that got you there — not on what an average year looks like. Three sources of uncertainty stretch the recovery-time distribution far past the deterministic point, and a single date hides all of them.
The dominant driver is climate variability, and it is also the modelling pitfall. A site is not a portfolio of independent cohorts whose good and bad luck cancels out; a single growing season's rainfall is a shared factor that scales the growth of every cohort together. We apply one lognormal climate multiplier per site-year — standard deviation 0.40 — to the whole community at once, and a check confirms the imposed spread survives (recovered multiplier SD 0.419 against the imposed 0.400). The two other drivers are planting survival, a Beta-distributed establishment fraction averaging about 0.75, and invasive setbacks — incursions that subtract a Beta-distributed share of the community already gained. Crucially, invasive risk is tied to the shared climate factor: a vigorous-growth year also favours weeds, so the model imposes a positive dependence between the climate multiplier and the invasive trigger (realised correlation +0.124). Good years are not unambiguously good.
The recovery trajectory, not the recovery date
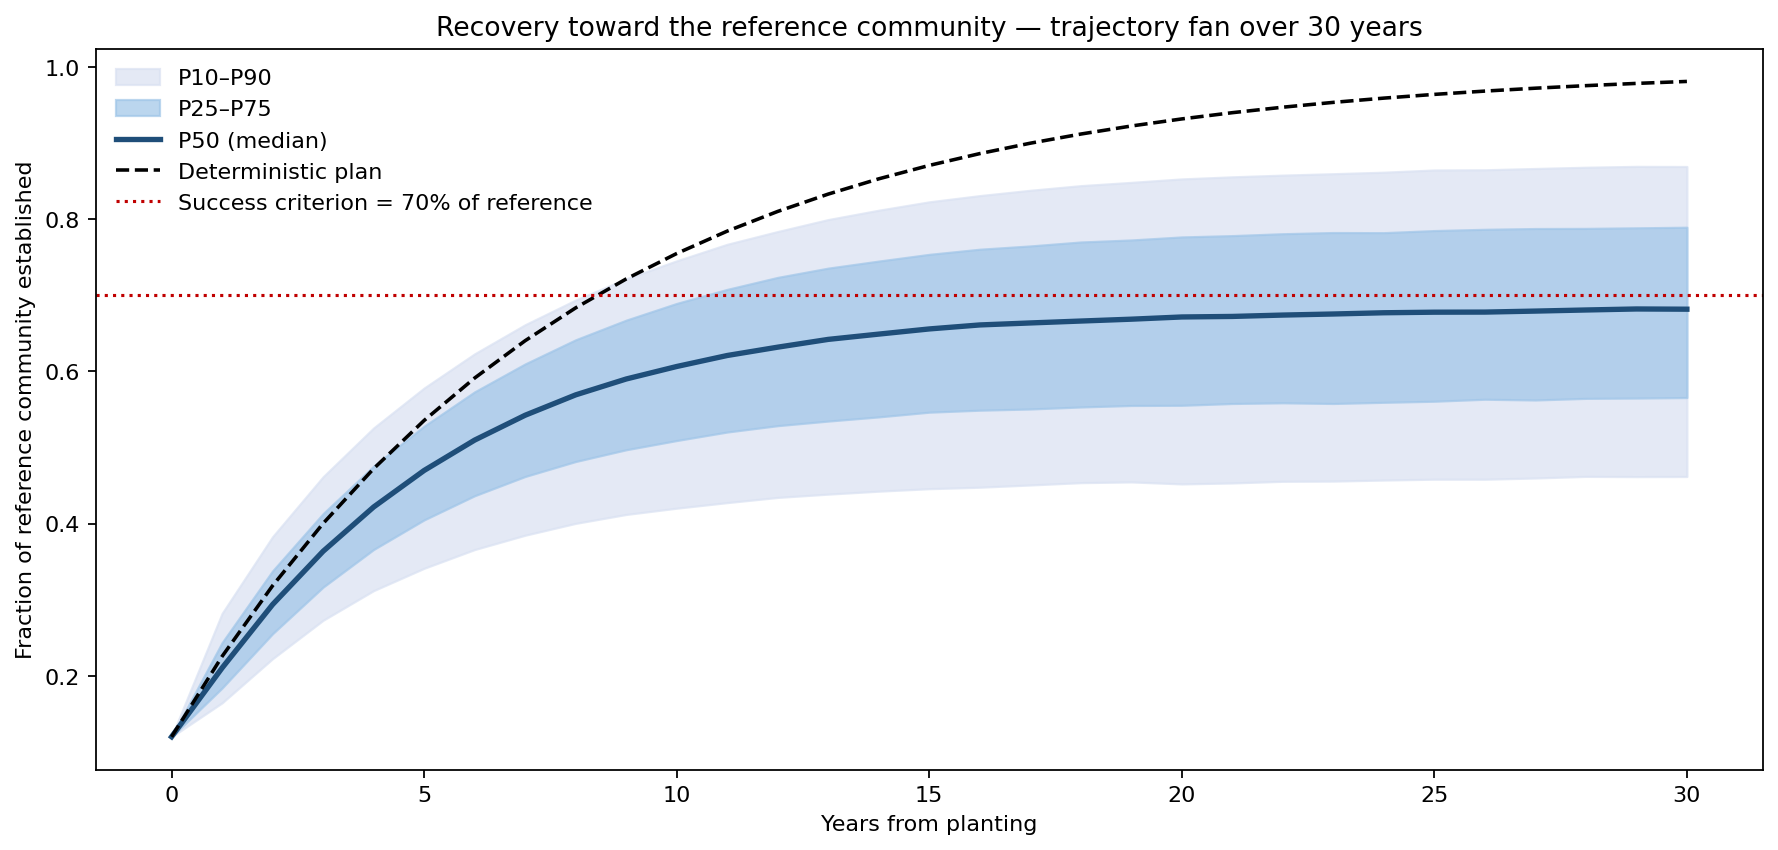
Plotting the fraction of reference community established over time as a fan makes the spread concrete. The deterministic path sails to 0.98 of reference by year 30. The simulated band is far wider: at the year-15 milestone the recovery fraction runs from a P10 of 0.45 through a median of 0.66 to a P90 of 0.82 — the median sitting just below the 0.70 line the milestone demands. Where the deterministic plan shows a site comfortably finished, the distribution shows a site whose on-time success is genuinely in question.
What gets the site recovered on time
The decision is how to spend a finite management budget to lift the probability of on-time success. ModelRisk renders it as a curve for two competing programmes: suppressing invasive incursions, or planting at higher density to raise survival.
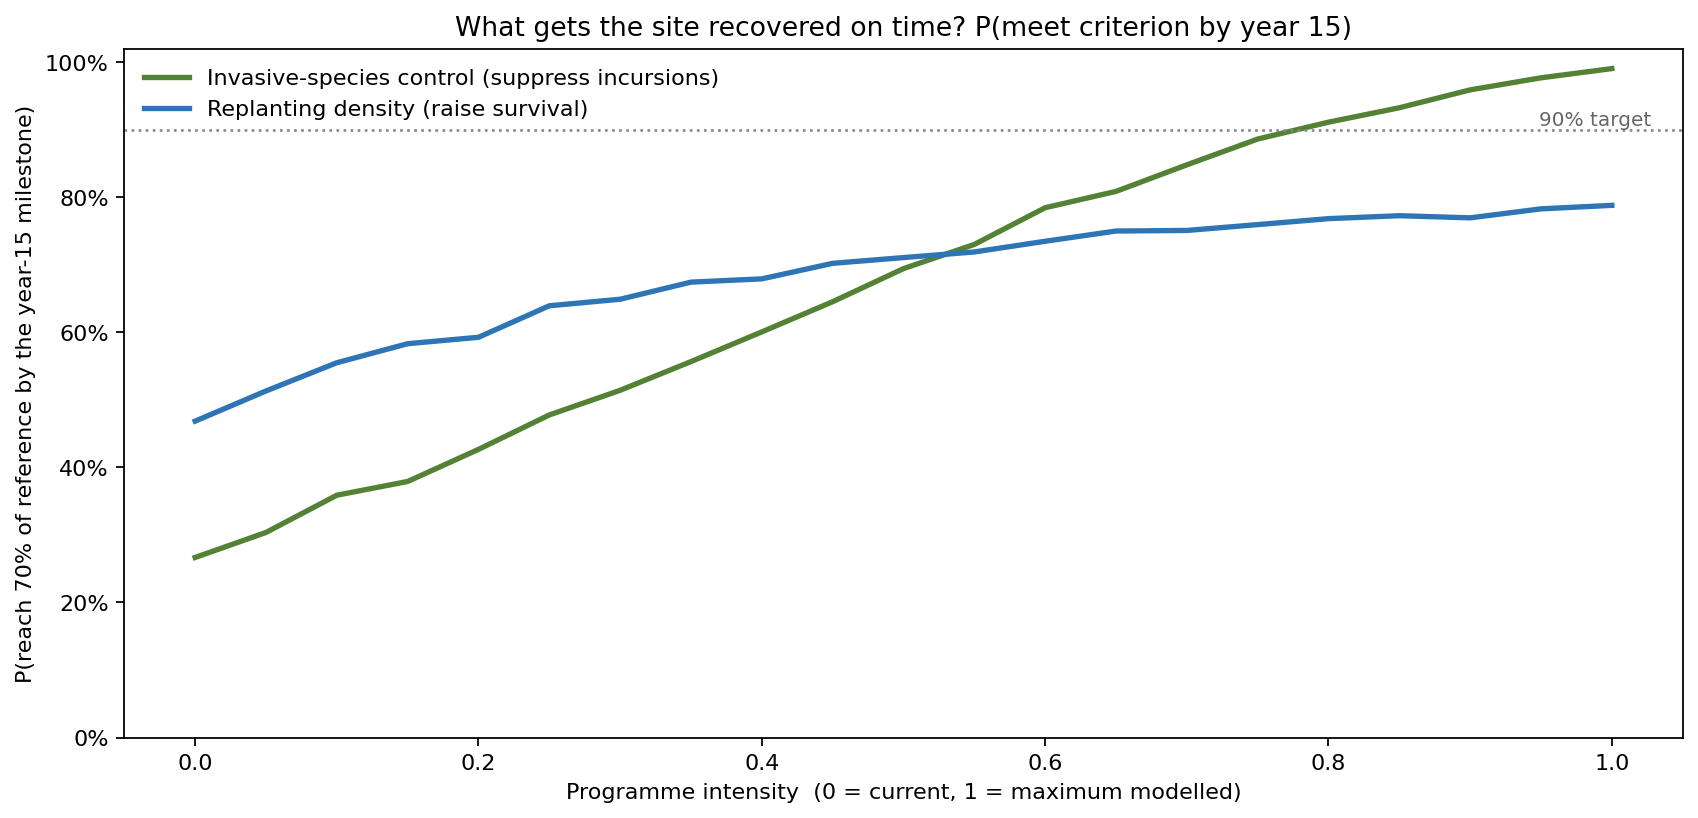
From the base on-time probability of 63%, an aggressive invasive-control programme lifts P(meet the criterion by year 15) to 0.99, crossing the 90% target at about 0.80 of maximum control intensity. A replanting-density programme that raises survival reaches only 0.79 even at full intensity. For this site the binding constraint is weeds, not seedlings — invasive control is the intervention that turns a 63% gamble into near-certainty.
What drives on-time success
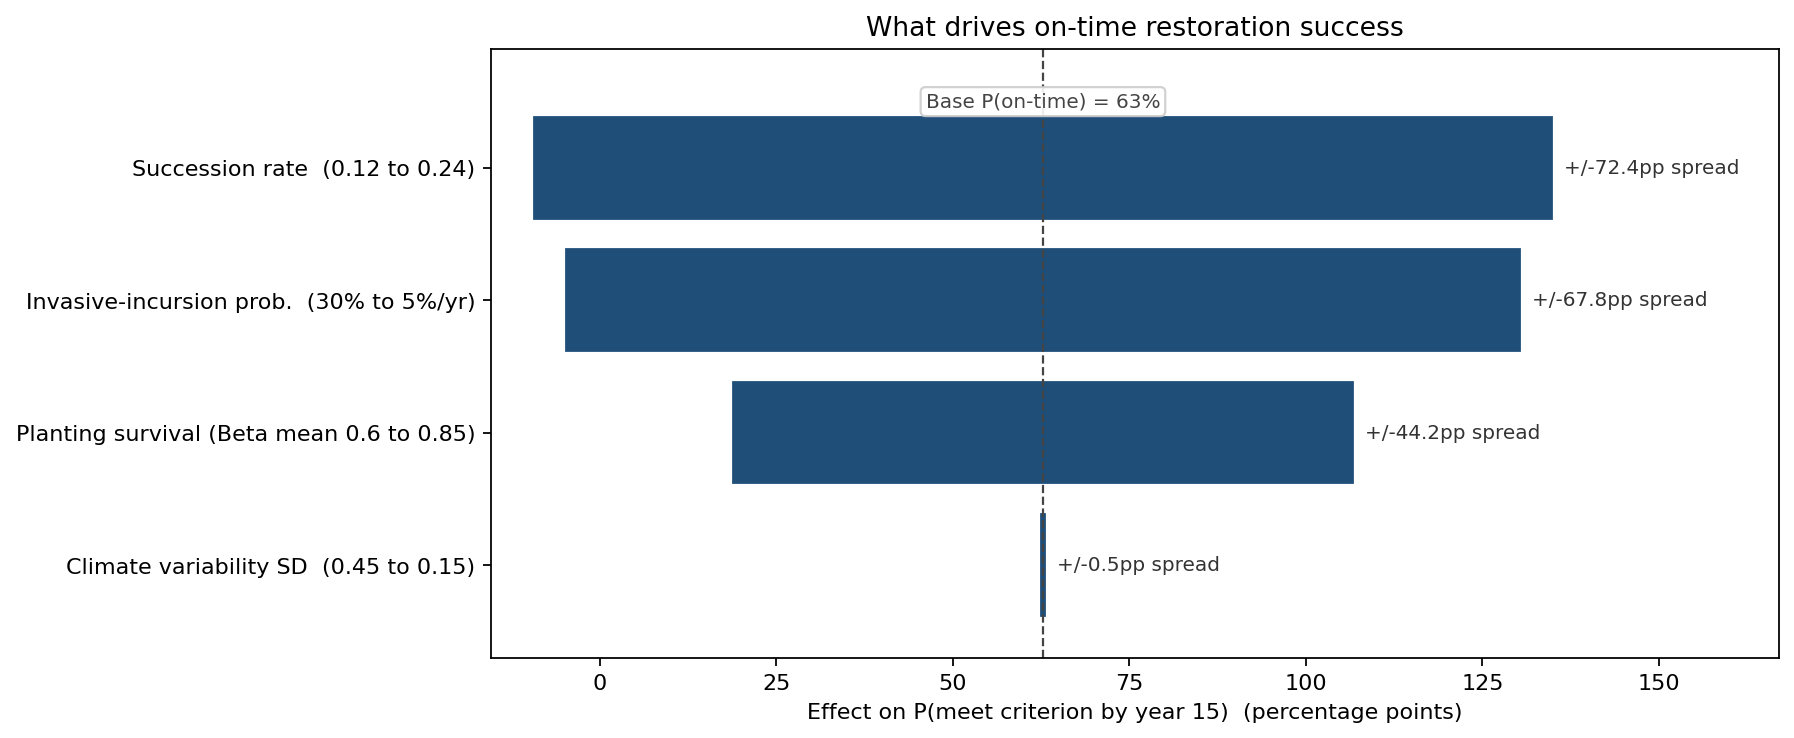
Swinging each input across a plausible range and measuring the effect on P(on-time success) confirms the ranking. Succession rate is the largest single lever at a 72.4 percentage-point spread (from 23.7% to 96.0% on-time), followed closely by invasive-incursion probability at 67.8 points and planting survival at 44.2 points. Climate variability barely moves the milestone probability — a 0.5-point spread — because while it widens the trajectory fan, the median timing is governed by the biological rates. The lesson for the budget: invest in the rates you can manage (site preparation that speeds succession, relentless weed control), not in trying to forecast the weather.
What the model changed
- Reset milestone expectations from the deterministic 9-year finish to a 62.8% chance of meeting the year-15 criterion, prompting a renegotiated grant milestone rather than a near-certain miss.
- Directed the budget to invasive control, the intervention that lifts on-time probability to 0.99, over replanting density, which tops out at 0.79.
- Quantified the trajectory band at year 15 — P10 0.45, median 0.66, P90 0.82 of reference — replacing a single "done by year 9" claim with a defensible range for funders.
- Modelled climate as a shared site-year factor correlated with invasive risk (+0.124), so good-growth years carry their real weed cost instead of being treated as unambiguously favourable.
ModelRisk Functionality Used
- Shared-factor Monte Carlo simulation of 40,000 thirty-year restoration trajectories, with one climate multiplier per site-year scaling every cohort together.
- Time-to-event analysis producing the years-to-recovery distribution (median 13, P90 23) and the probability of crossing the criterion by the year-15 milestone.
- Dependence modelling linking a vigorous-climate year to a higher invasive-incursion probability (realised correlation +0.124) so the loss tail is not understated.
- Intervention sweep comparing invasive control and replanting density as on-time-success curves against a 90% target.
- Tornado sensitivity analysis ranking succession rate, invasive probability, planting survival and climate variability by their effect on on-time success.
A restoration timeline is not a date on a Gantt chart — it is a distribution of years shaped by weather, weeds and survival, and the question worth funding is not "when will it finish" but "how likely is it to finish on time, and what makes that likely".