

Industry: Environmental
Product: ModelRisk
Application: Climate adaptation planning under uncertainty
The Business Case Said the Barrier Breaks Even. It Actually Loses Money 55% of the Time — and the Coin Lands on the Climate
A coastal agency is weighing a city-scale storm-surge barrier to protect a $43bn asset base over a 40-year life. The appraisal runs the standard deterministic cost-benefit: central warming, central build cost, present-value the avoided flood damage, subtract the capital and operating cost, and report a net benefit of -$0.39bn — essentially break-even, the kind of marginal number that gets a mega-project waved through on the argument that "the resilience benefits aren't fully captured."
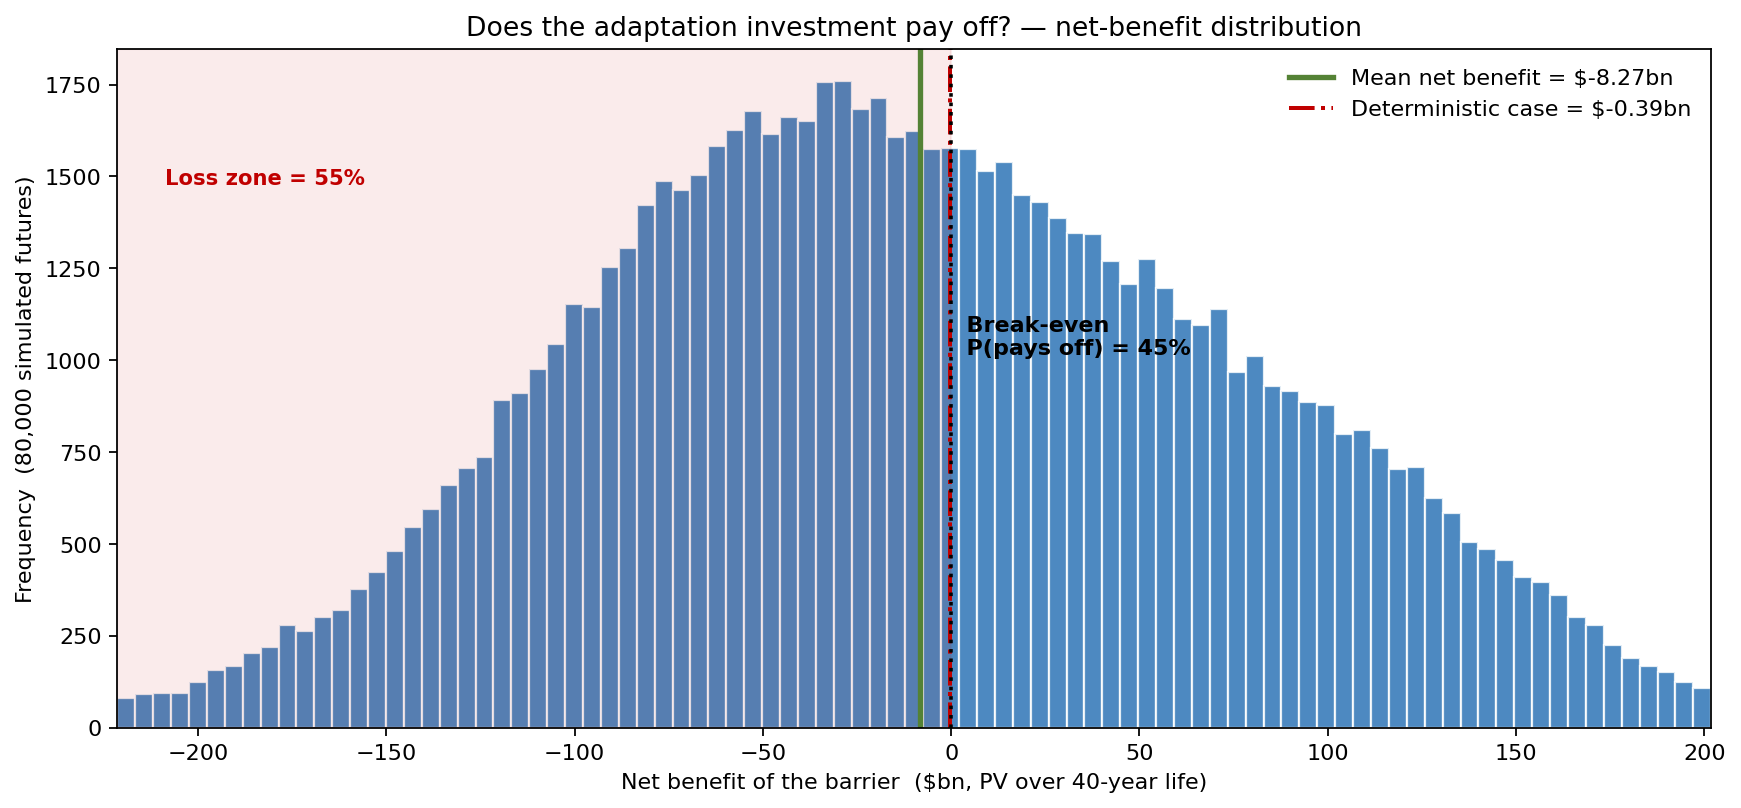
Run the appraisal as 80,000 possible futures in ModelRisk and the marginal verdict turns out to be hiding a coin flip. The mean net benefit is -$8.27bn and the mean benefit-cost ratio is 1.02 — break-even on average, just as the deterministic case said. But the distribution straddles zero: the barrier delivers a net benefit above zero only 45% of the time, and it loses money 55% of the time, with a P10 outcome of -$117.84bn against a P90 of +$111.11bn. This is not a project with a small positive return; it is a $190bn bet whose payoff depends almost entirely on which climate future arrives.
Why a point estimate fails here
The deterministic appraisal collapses two large, uncertain quantities — avoided damage and whole-life cost — onto their central values and reports the difference of two big numbers. When two ~$190bn quantities are each uncertain by tens of percent, the difference between them is dominated by that uncertainty: the avoided-damage present value ranges from a P10 of $92.90bn to a P90 of $289.80bn, and the whole-life cost from $134.38bn to $256.23bn. A single subtraction of two point estimates throws away exactly the spread that decides the outcome.
Worse, the two sides are linked through the climate. Avoided damage is driven by the same shared warming common factor as the underlying flood hazard — one warming draw per future, held across the asset life — so the barrier earns its keep precisely in the hot futures where the flooding it prevents is severe. The model confirms the dependence: the Spearman correlation between the warming level and the avoided-damage present value is 0.95. Build cost, meanwhile, is a Triangular engineering estimate scaled by a LogNormal overrun factor, because mega-projects overrun. The decision lives in the joint behaviour of these, which no central-case number can express.
The adaptation dilemma, made visible
Because the benefit is tied to warming, the answer to "does the barrier pay?" is really three different answers depending on the emissions future the world follows.
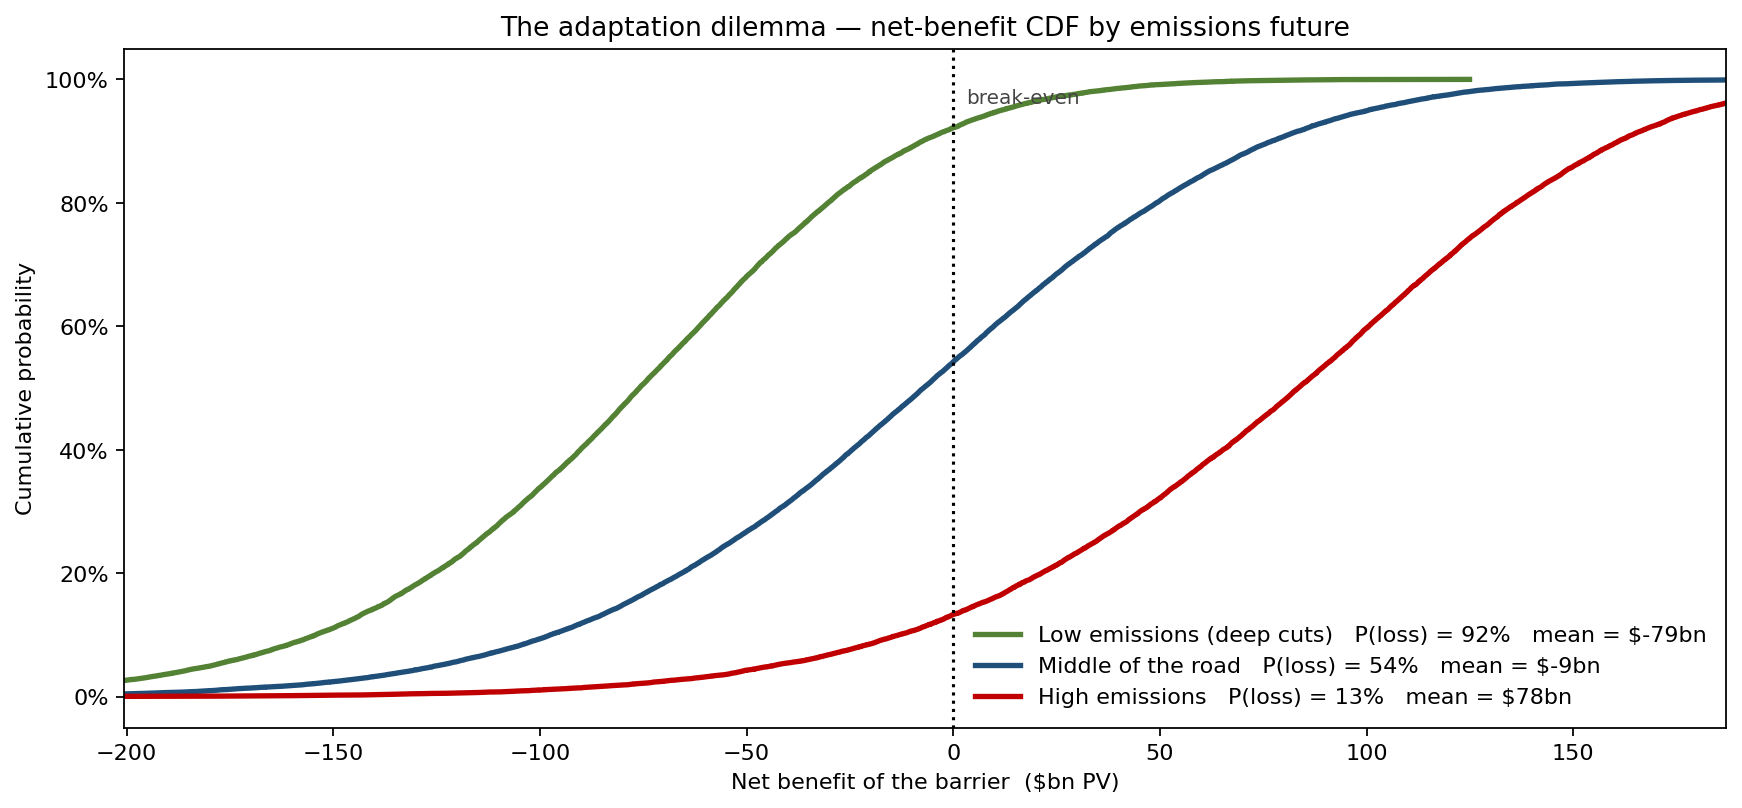
Under a low-emissions future — the world successfully decarbonises — the flooding the barrier was built to stop largely never materialises, and the scheme loses money 92% of the time (mean net benefit -$79bn). Under middle-of-the-road emissions it is a near-perfect coin flip: 54% chance of loss, mean -$9bn. Only under high emissions does the barrier become a clear winner, paying off 87% of the time with a mean net benefit of +$78bn. This is the genuine adaptation dilemma — the measure is most likely to be a stranded over-investment in exactly the future society is trying to bring about, and a bargain only in the future it is trying to avoid. A single expected-NPV figure averages these three worlds into a meaningless break-even.
What drives the net benefit
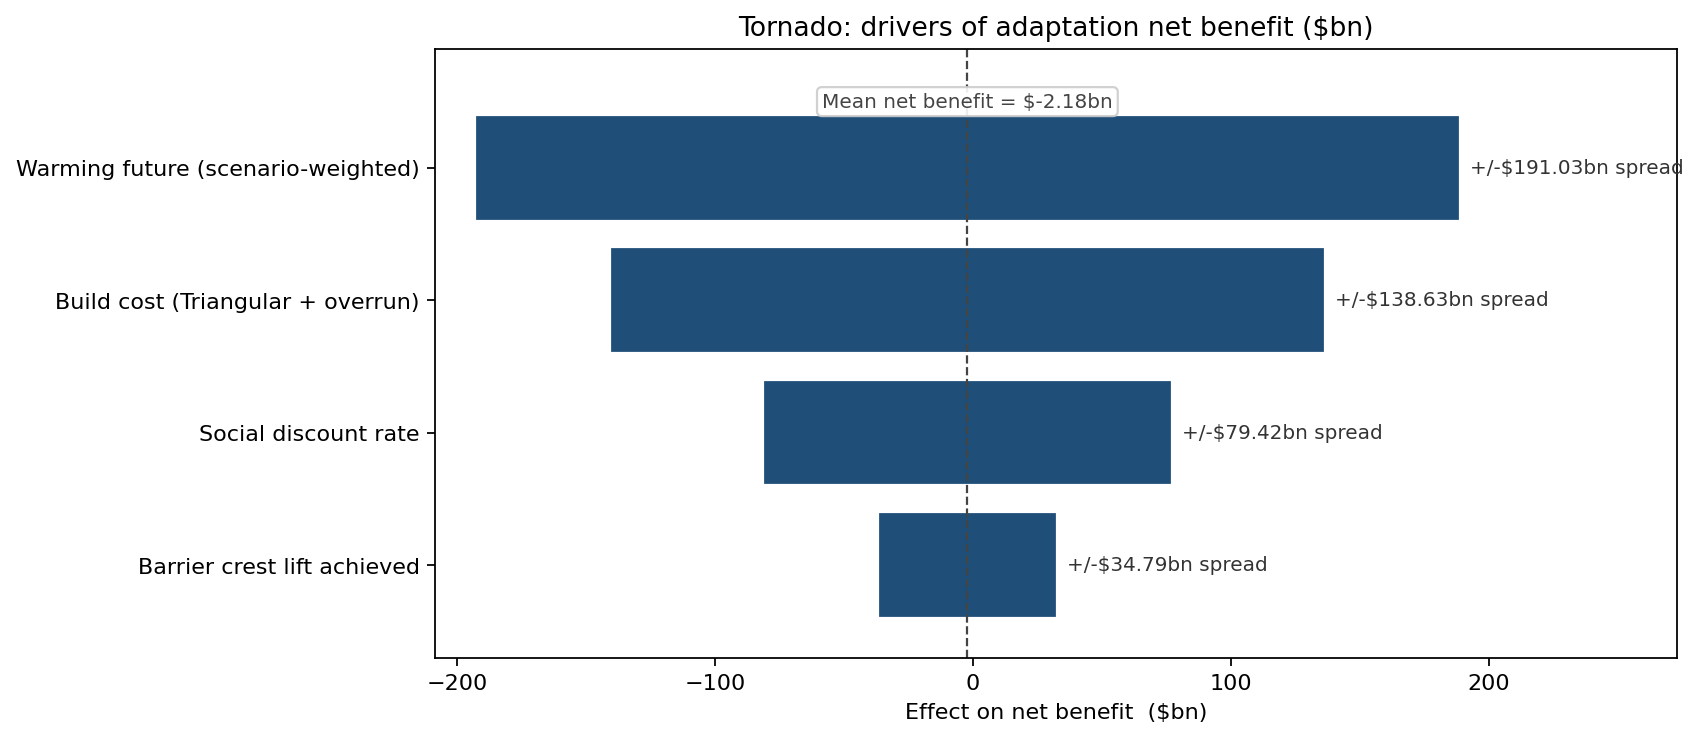
The driver ranking confirms where the risk sits. The warming future dominates at ±$95.52bn of net benefit around the mean — the single biggest source of uncertainty by a wide margin. Build cost (with overrun) follows at ±$69.32bn, the controllable engineering risk that procurement discipline can attack. The social discount rate moves the verdict by ±$39.71bn — a reminder that how the agency values future damages is itself a swing factor — and the barrier crest lift actually achieved contributes ±$17.40bn. Two of the four largest levers (build cost, discount rate) are within the agency's control; the largest is not, which is the case for staging the investment rather than committing the whole sum up front.
At what cost does it still pay?
The decision curve plots the probability the barrier clears a benefit-cost ratio of 1 as the assumed build cost varies, split by emissions future.
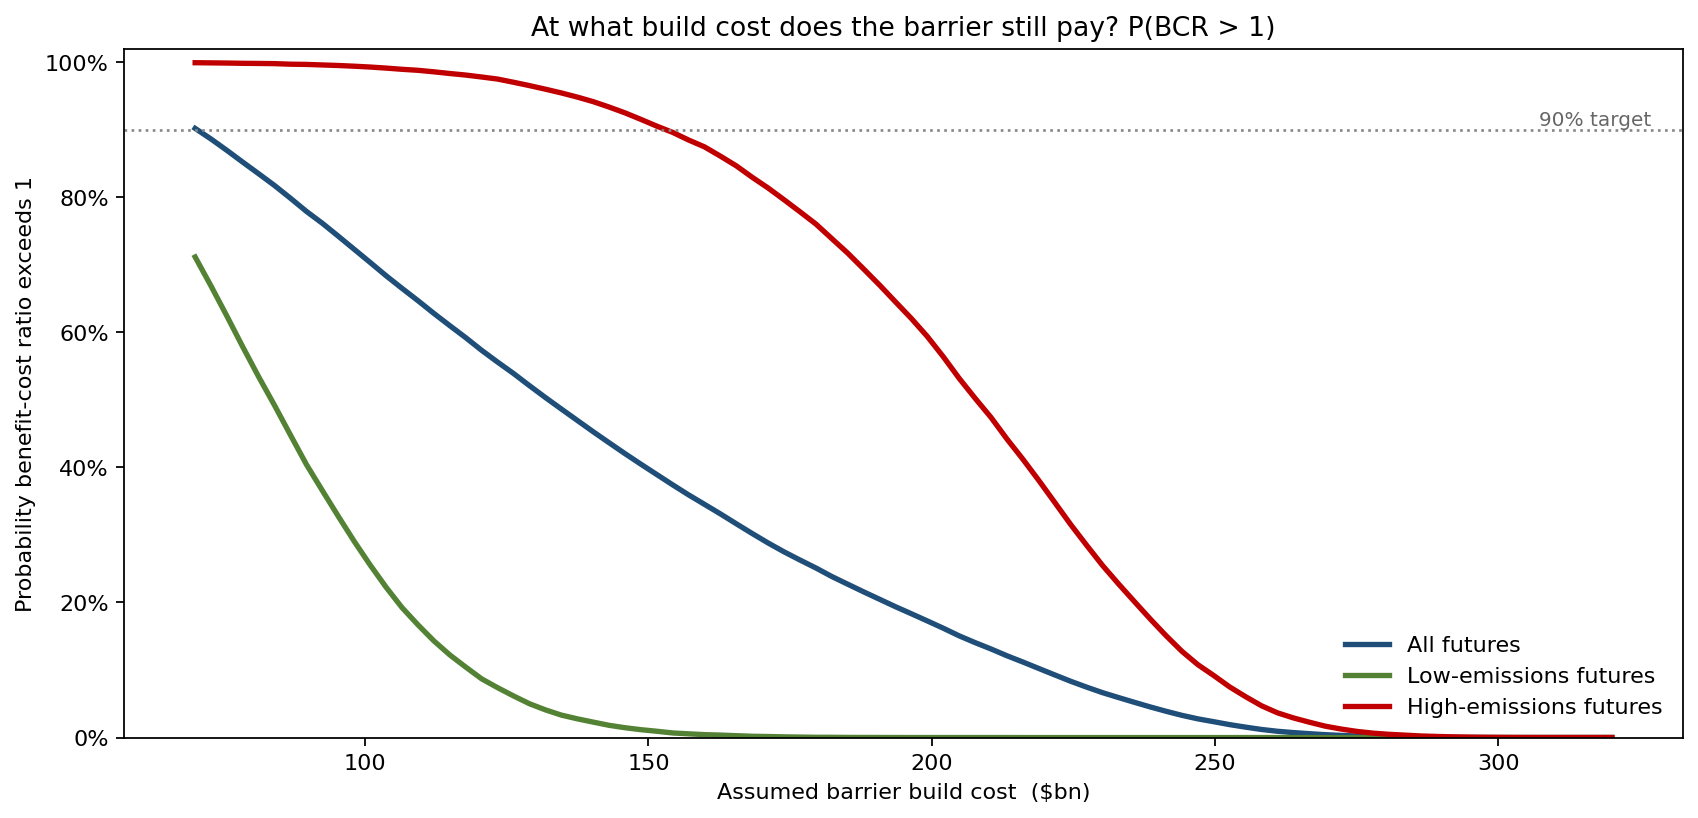
At the central $140bn build cost the barrier clears BCR > 1 only 45% of the time overall — but that splits into 2% under low emissions and 94% under high emissions. The curves cross the 90%-confidence line at radically different costs: in a high-emissions world the agency could justify a far more expensive barrier, while in a low-emissions world almost no build cost is defensible. There is no single "affordable" number; there is an affordable number per climate future, and the curve sizes each.
What the model changed
- A "break-even" verdict was exposed as a coin flip: the deterministic -$0.39bn concealed a 55% probability of net loss and a P10-to-P90 swing from -$117.84bn to +$111.11bn.
- The decision was conditioned on the climate future: the barrier pays off 8% of the time under low emissions versus 87% under high emissions, reframing it as a bet on warming rather than a settled appraisal.
- The investment was staged rather than committed, because the dominant driver (warming, ±$95.52bn) is unknowable up front while build cost (±$69.32bn) is controllable — favouring a phased, adaptive build over an all-at-once commitment.
- Climate-linked benefit was made explicit (warming-to-benefit Spearman 0.95), so the agency stopped treating avoided damage and the need for it as independent of each other.
ModelRisk Functionality Used
- Monte Carlo simulation of 80,000 futures, discounting a 40-year stream of avoided damage against an uncertain whole-life cost.
- Triangular build cost with a LogNormal overrun factor, capturing the systematic cost growth of infrastructure mega-projects.
- Shared common-factor modelling of warming, tying avoided-damage benefit to the climate future so the two are correlated, not independent.
- Scenario analysis decomposing net benefit and the probability of paying off under low, middle and high emissions pathways.
- Tornado sensitivity analysis ranking warming, build cost, discount rate and barrier performance by their effect on net benefit.
- Threshold-sweep / cost-curve output giving the probability the barrier clears a benefit-cost ratio of 1 as the build cost varies, per emissions future.
Whether adaptation pays is not a number, it is a distribution that hinges on the climate that arrives. ModelRisk is what lets an agency see the 55% loss probability behind a break-even business case — and stage its investment accordingly.