

Industry: Environmental
Product: ModelRisk
Application: Carbon footprint quantification under uncertainty
The Reported Footprint Was 52,292 ktCO2e. There Was Only a 20% Chance the True Number Sat Within ±5% of It
A multinational sustainability team adds up its annual greenhouse-gas inventory the way almost every corporate inventory is built: ten line items spanning Scope 1, 2 and 3, each one the product of an activity figure (litres of fuel, MWh of electricity, dollars of purchased goods) and an emission factor (tCO2e per unit). The spreadsheet returns 52,292 ktCO2e, the team rounds it, publishes it, and signs a public commitment to cut 10% off a 52,000 ktCO2e baseline — a target of 46,800 ktCO2e.
Run the same inventory 80,000 times in ModelRisk, letting every activity figure and every emission factor vary across its real uncertainty, and the single number dissolves into a distribution. The mean is 52,342 ktCO2e — the point estimate was not biased — but it is the only thing the point estimate got right. The inventory ranges from a P5 of 37,783 ktCO2e to a P95 of 72,740 ktCO2e. There is only a 34% probability of meeting the stated 46,800 ktCO2e reduction target, and — most damning for a reported figure — only a 20% probability that the true inventory falls within ±5% of the number the company published.
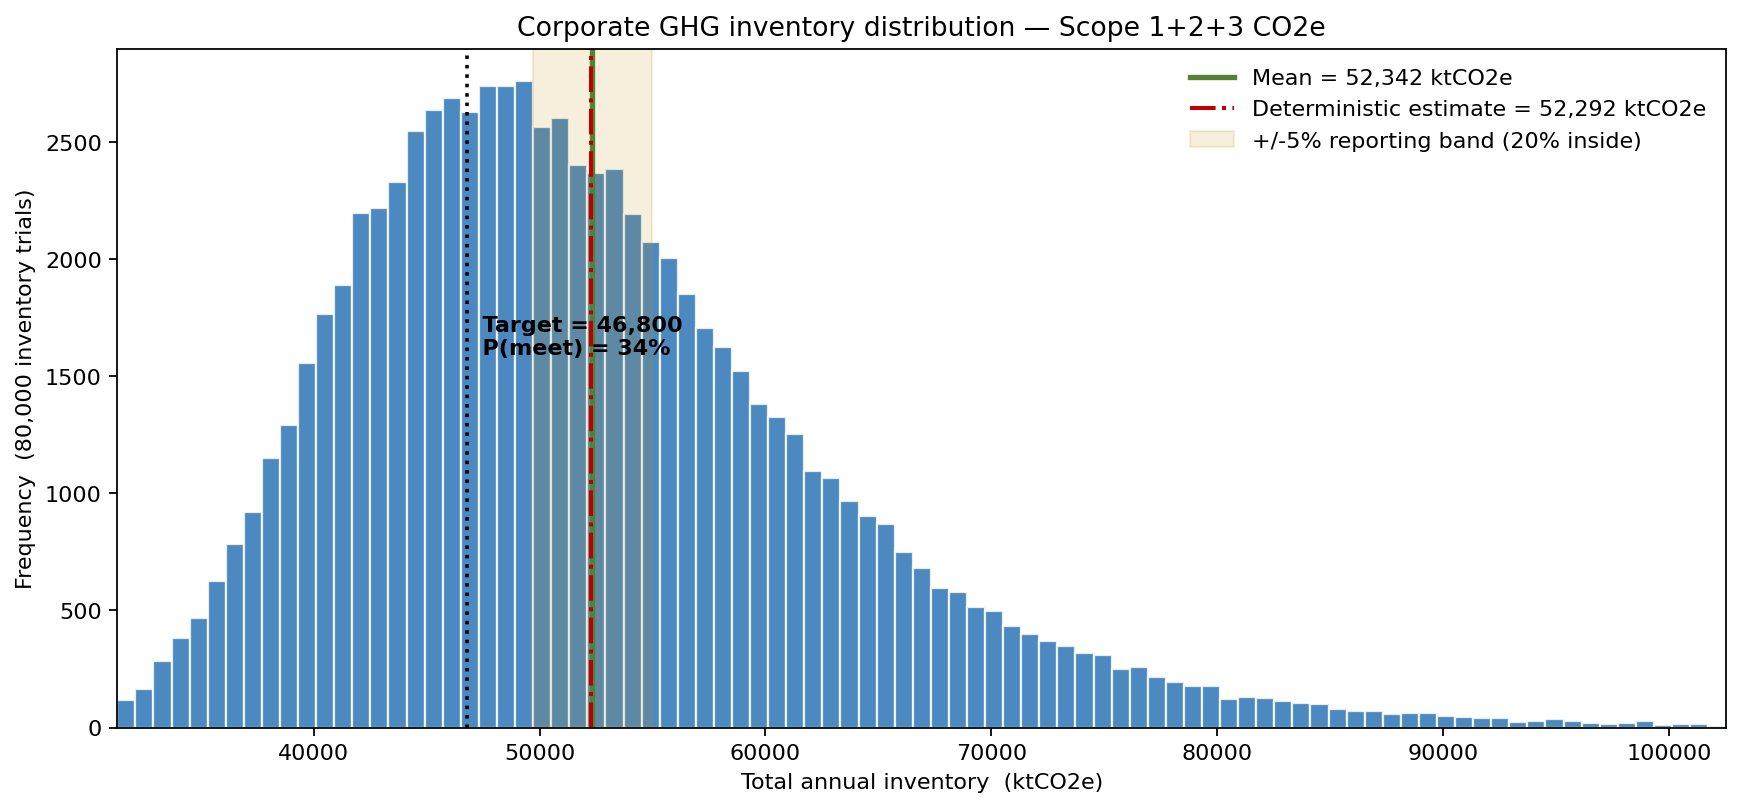
Why a point estimate fails here
A carbon inventory is an accounting sum, and the instinct is to treat a sum of ten line items as essentially certain — the errors "average out". They do not, for two reasons.
First, the dominant uncertainty in any inventory is the emission factors, not the activity data. Activity figures come from meters and invoices and carry small, symmetric measurement noise (modelled as Normal). Emission factors come from published databases, are right-skewed, and can be wrong by tens of percent — so each factor is a LogNormal multiplier, and the products inherit that skew.
Second, and decisively, the factors are not independent. A corporate inventory leans on a shared emission-factor library, and that library is revised as a block: a grid-mix update, a methodology revision, a supplier-data refresh moves a whole family of factors at once. The model captures this with a shared LogNormal regime multiplier per scope, applied to every factor in that scope. A year that runs hot on one Scope 3 factor runs hot on the correlated family — so the line items move together instead of cancelling, and the inventory tail stays fat.
That shared regime is verifiable in the model output: the Spearman correlation between two Scope 3 line items is 0.24 with the shared regime, against -0.01 when the lines are forced independent. The effect on the reported total is material — the inventory standard deviation is 11,029 ktCO2e with correlation versus 9,579 ktCO2e under independence, so an independence assumption understates the spread by 13%. The "errors average out" spreadsheet reports a tighter, falsely confident number.
Where the CO2e — and the uncertainty — live
Splitting the inventory by scope shows that the reporting problem is concentrated, not spread evenly.
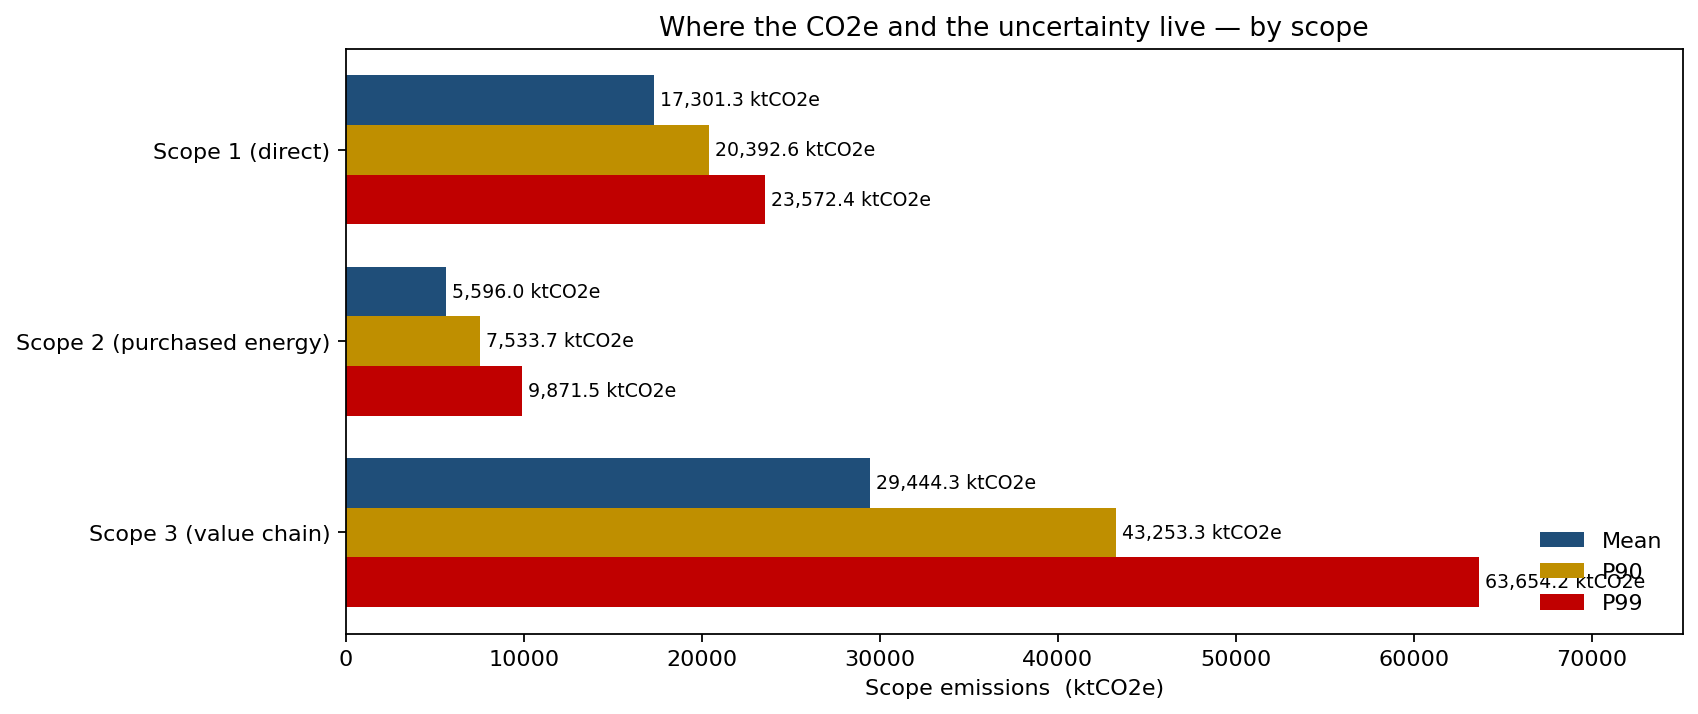
Scope 3 dominates both the magnitude and the uncertainty. Its mean is 29,444 ktCO2e — more than Scope 1 (17,301 ktCO2e) and Scope 2 (5,596 ktCO2e) combined — but the revealing figure is the gap between its central case and its tail: a P90 of 43,253 ktCO2e and a P95 of 49,397 ktCO2e. Scope 1's P90 (20,393) and P95 (21,454) sit close together; Scope 3's are far apart. The value chain is where the inventory is both biggest and least pinned down, which is exactly where assurance effort and supplier engagement earn their keep.
What drives the inventory uncertainty
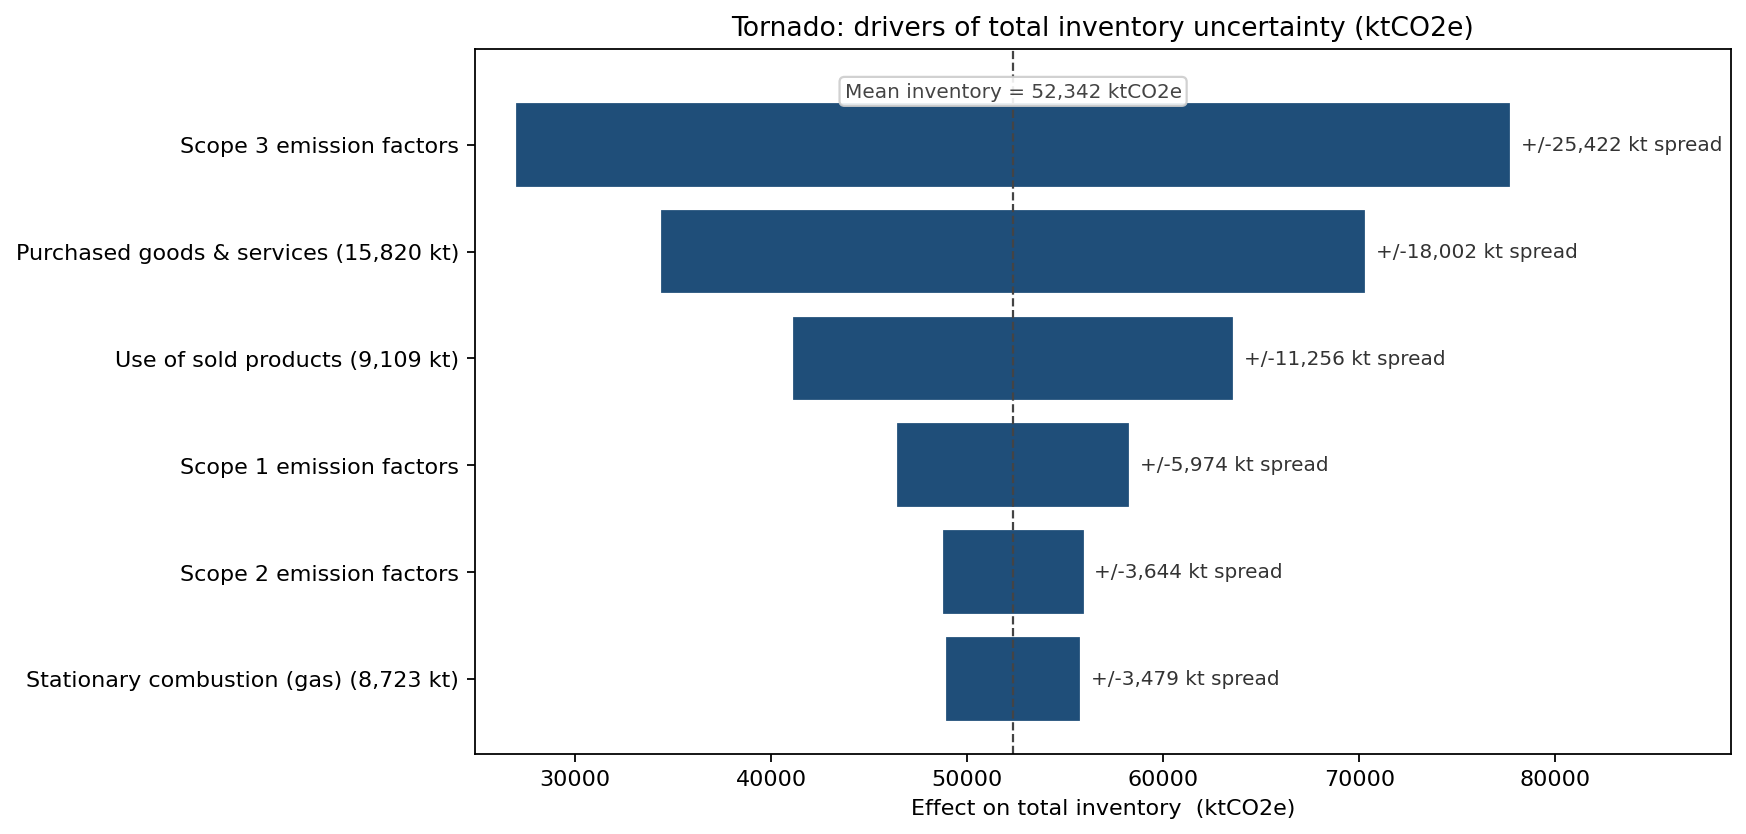
Swinging each input group across its P10–P90 range confirms the ranking. The Scope 3 emission-factor regime is the single largest lever at ±12,711 ktCO2e around the mean. Behind it sit the two largest individual line items — purchased goods and services at ±9,001 ktCO2e and use of sold products at ±5,628 ktCO2e — both Scope 3. The entire Scope 1 factor set moves the total only ±2,987 ktCO2e and Scope 2 just ±1,822 ktCO2e. The combustion line every engineer can measure precisely (±1,740 ktCO2e) is almost irrelevant to the reported uncertainty; the spend-based Scope 3 factors nobody controls are everything.
The credible reporting range
The cumulative distribution turns the inventory into the question an assurance provider actually asks: what range can the company credibly stand behind?
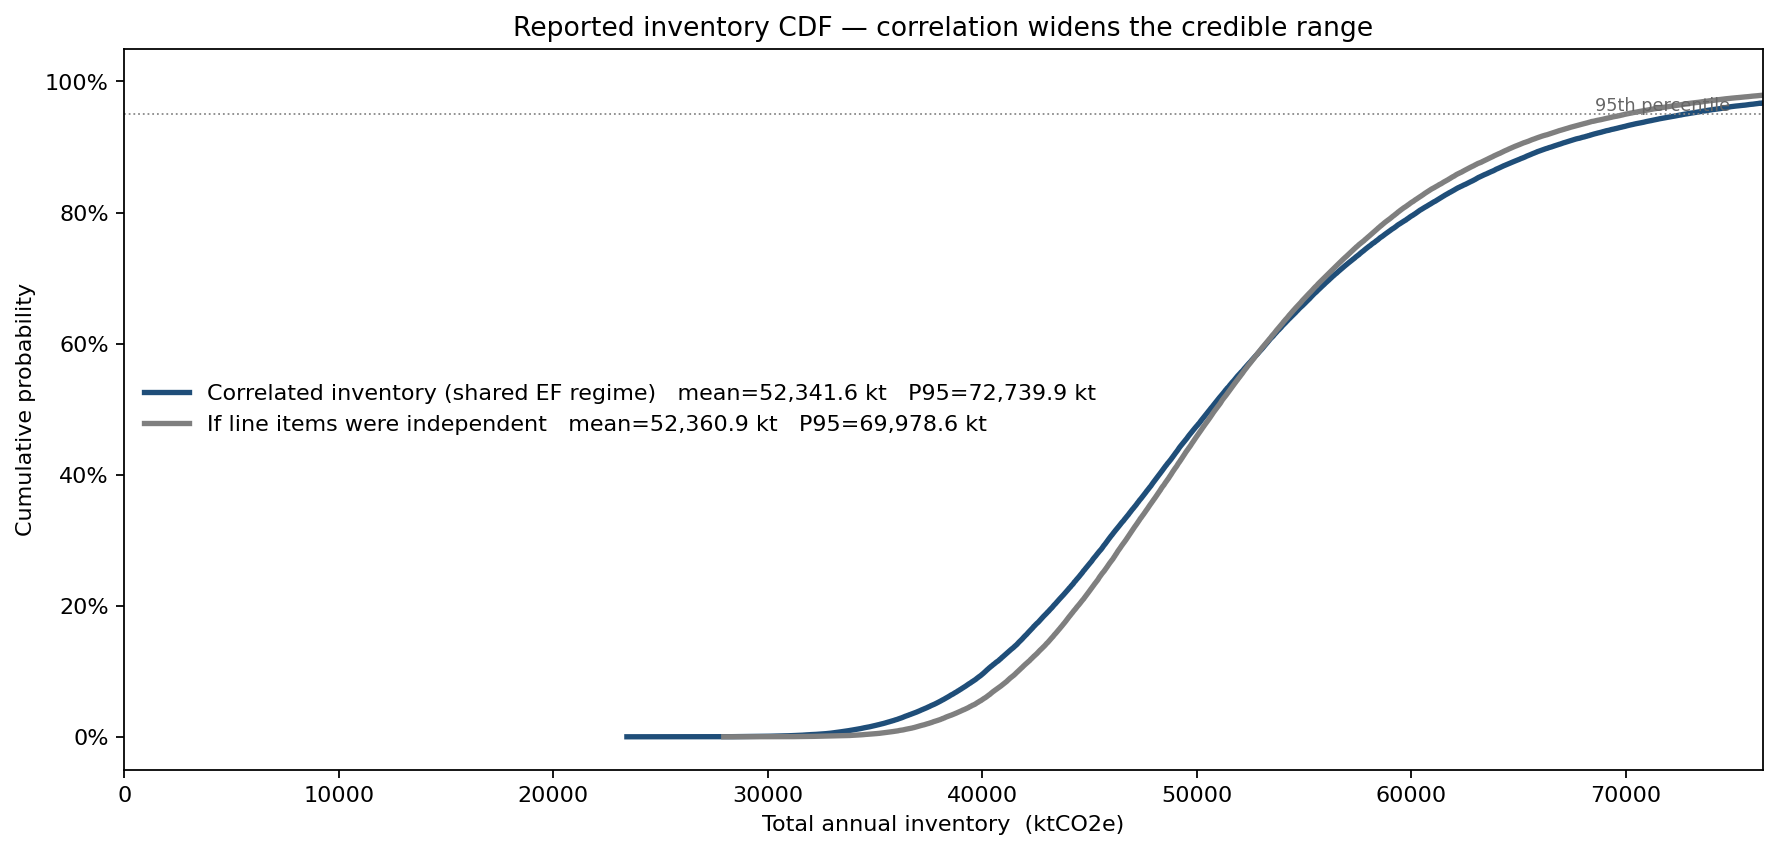
The correlated inventory spans a 90% credible range from 37,783 to 72,740 ktCO2e — a width of 34,957 ktCO2e. Had the line items been treated as independent, that range would read 39,671 to 69,979 ktCO2e, a width of 30,308 ktCO2e — about 15% narrower, and a range the company could not actually defend, because it ignores the shared-library correlation. The honest reporting statement is not "our footprint is 52,292 ktCO2e" but "our footprint is most likely 51,000–52,000 ktCO2e, with a defensible range of roughly 38,000–73,000 ktCO2e, and a one-in-three chance of meeting our reduction target on current trajectory."
What the model changed
- The target was re-framed as a probability: the 46,800 ktCO2e commitment carries only a 34% chance of being met on current trajectory, turning a binary "on track / off track" claim into a quantified shortfall risk.
- The reported figure gained a defensible band: the company now reports a 90% credible range of 37,783–72,740 ktCO2e rather than a false-precision single number that had only a 20% chance of being right to ±5%.
- Assurance effort was redirected to Scope 3, which carries the largest factor uncertainty (±12,711 ktCO2e) and the widest tail, instead of being spread evenly across scopes that are already well measured.
- The shared emission-factor regime was made explicit, recovering 13% of inventory spread that an independence assumption had quietly erased.
ModelRisk Functionality Used
- Monte Carlo simulation of 80,000 inventory trials, propagating activity-data and emission-factor uncertainty through the full Scope 1+2+3 sum.
- LogNormal emission factors and Normal activity data, capturing the right-skewed factor uncertainty that dominates a GHG inventory.
- Shared-regime (common-factor) modelling of the emission-factor library, imposing the within-scope correlation that an independence assumption misses.
- Tornado sensitivity analysis ranking scopes and line items by their effect on total inventory uncertainty.
- Cumulative distribution output giving a defensible credible range and the probability of meeting the reduction target and of reporting within a tolerance band.
A reported footprint is not a number, it is a distribution with a correlated emission-factor tail. ModelRisk is what lets a sustainability team report — and target — against the distribution instead of against a deceptively precise single figure.