

Industry: Environmental
Product: ModelRisk
Application: Biodiversity conservation under uncertainty
A Deterministic Plan Said the Population Would Reach 595; the Simulation Found a 12% Chance It Nearly Disappears
A conservation team manages the last protected population of an endangered, slow-breeding vertebrate: 250 animals today, in a reserve whose carrying capacity is about 600. The recovery plan is built on a logistic projection at the mean intrinsic growth rate — r = 0.10 — and that projection is reassuring. Run forward 50 years it climbs smoothly to 595 animals, comfortably full and apparently safe. On the strength of that single curve the population is classified as "recovering" and monitoring effort is scaled back.
The mean-growth curve is not wrong about the expected trajectory. It is silent about the only outcome the team is actually paid to prevent: the population quietly falling to a level from which it cannot return. Run the same population 40,000 times in ModelRisk, with growth that varies year to year, with demographic noise that bites hardest when numbers are low, and with the rare catastrophe — a disease outbreak, a wildfire, a flood — and the smooth curve dissolves into a fan. The median 50-year population is 471, the P10 is just 140, and there is an 11.8% probability of quasi-extinction: a roughly 1-in-8 chance the population drops below the critical floor of 50 animals at some point in the next half-century. The deterministic plan could not see that risk because it never let a bad year happen.
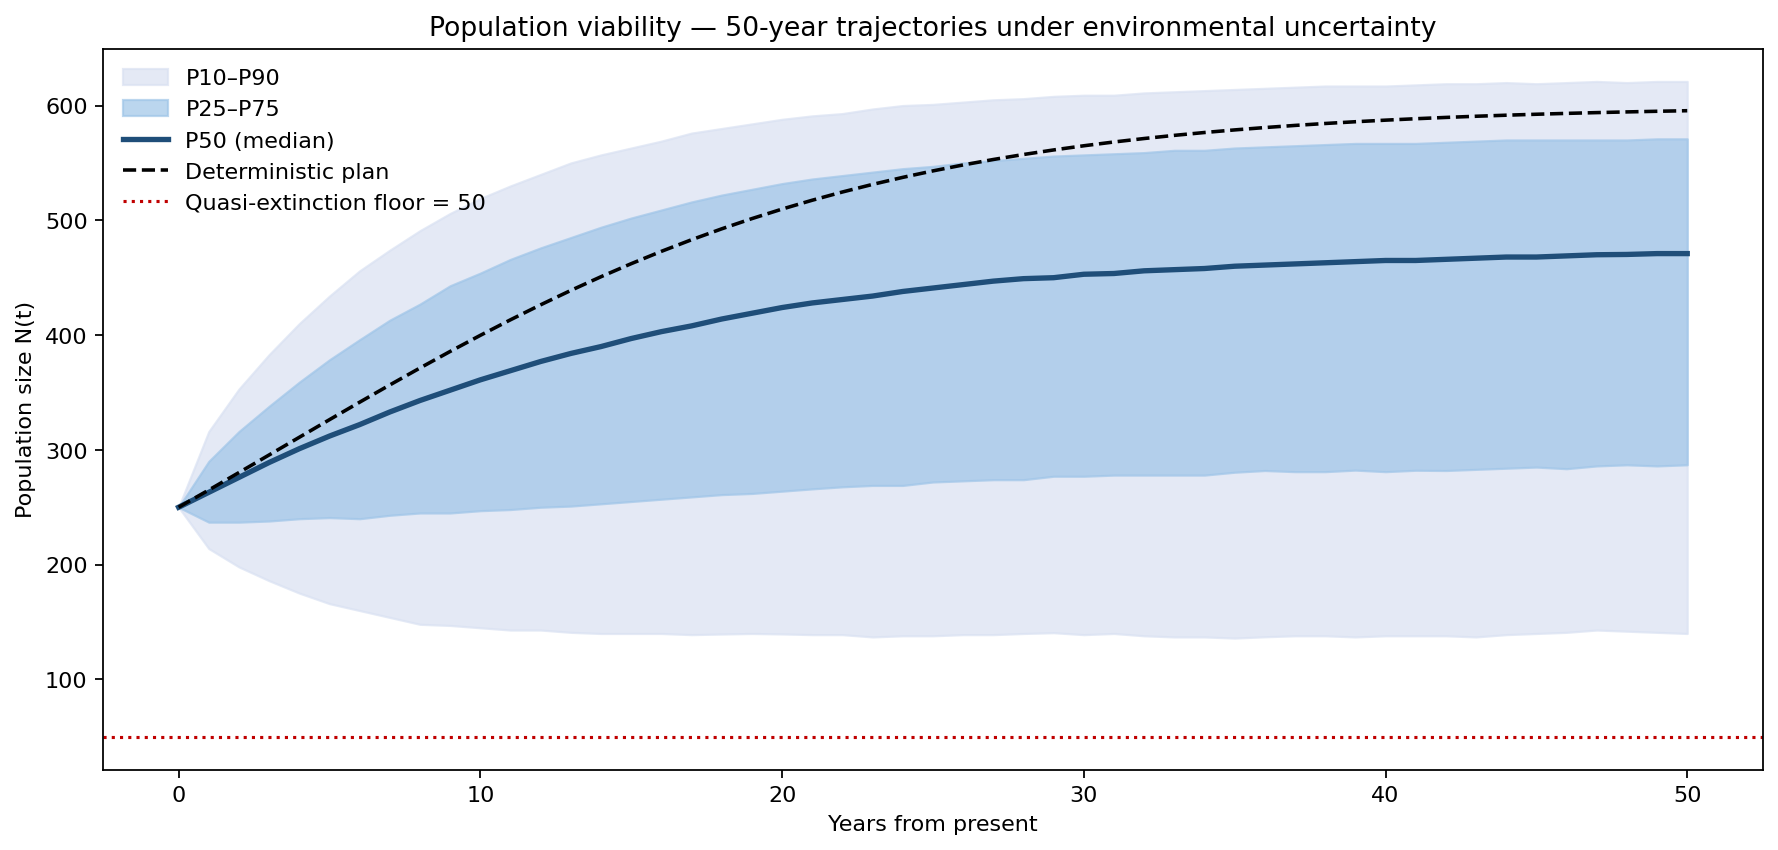
Why a single growth curve fails here
Population viability is a question about the worst paths, not the average one — and averages are exactly what a deterministic projection reports. Two kinds of randomness drive a small population toward the floor, and a point estimate erases both.
The first is environmental stochasticity: rainfall, prey abundance and winter severity vary from year to year, and a bad year depresses the growth rate of the whole population at once. This is the modelling trap that quietly defeats naive simulations. If each animal's fate were drawn independently, the law of large numbers would average the noise away and the fan would collapse onto the mean. It does not, because the environment is a shared factor: one draw per year scales every cohort's survival together. In the model the growth rate is r + environmental shock, with the shock a Normal of standard deviation 0.22 applied population-wide each year — and a check confirms the imposed factor survives: the recovered year-one log-growth SD is 0.212 against the imposed 0.220. Switching the environmental factor off drops the coefficient of variation of the final population from 0.43 to 0.39 — the shared good-year/bad-year signal is real width, not noise that washes out.
The second is demographic stochasticity and catastrophe: at low numbers, integer births and deaths (modelled by Poisson resampling) swing the population hard, and a rare catastrophe year — 4% annual probability, removing a Beta-distributed fraction averaging 45% of the population — can tip an already-small population past the point of recovery.
Where the population actually lands in 50 years
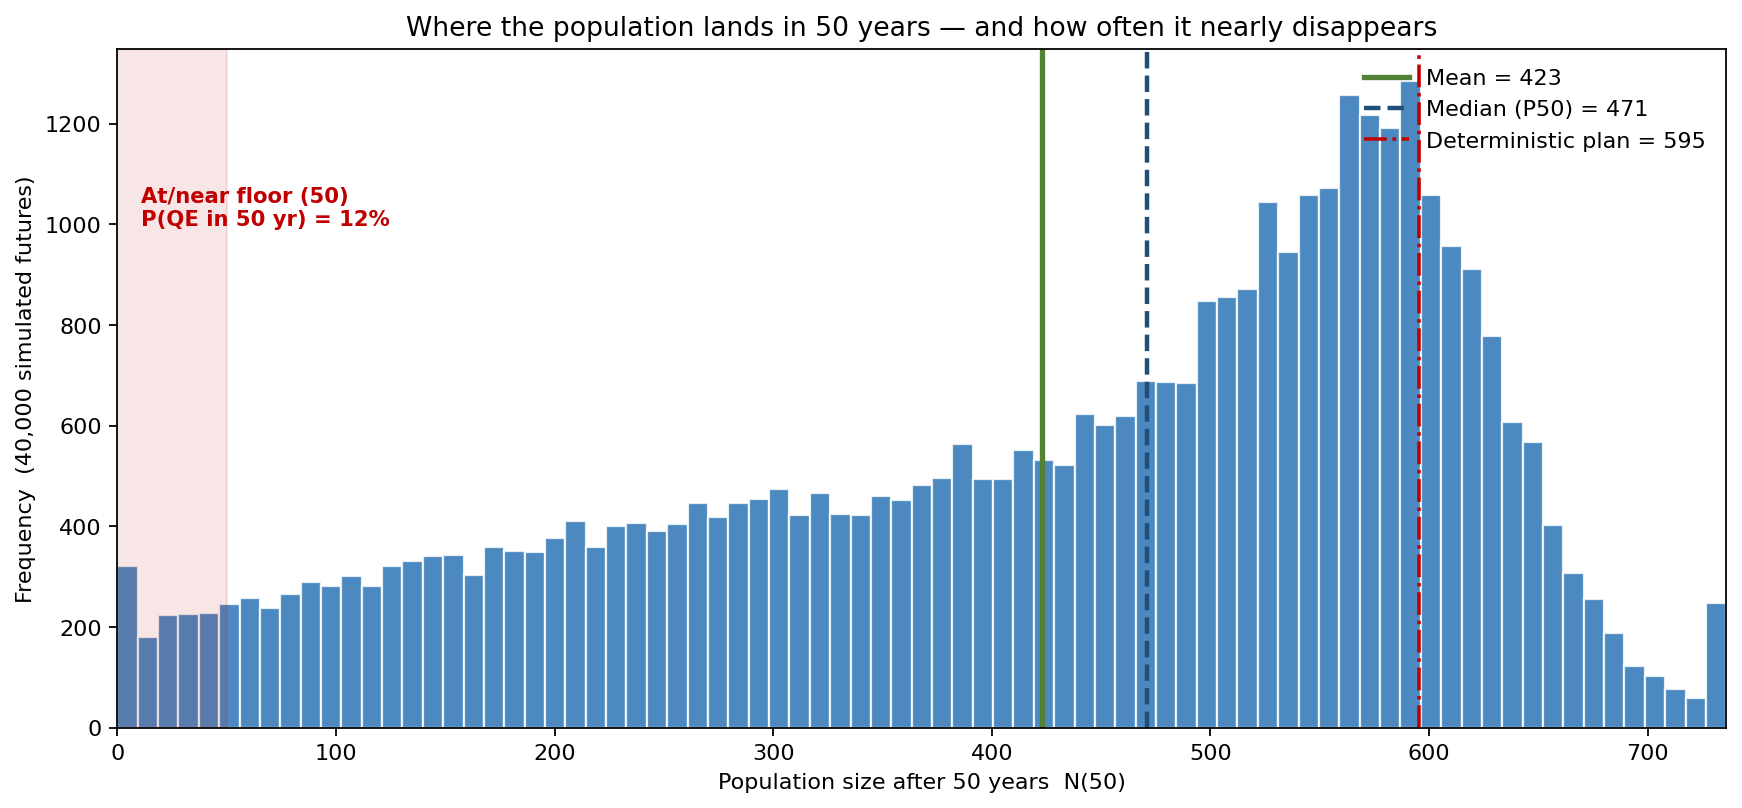
The distribution of the 50-year population has a mean of 423 and a median of 471 — both below the 595 the deterministic plan promised, because variability and catastrophe drag the average down even when the typical path looks healthy. The tail is what matters: 12% of futures end at or near the quasi-extinction floor of 50 animals. A management plan calibrated to the 595 figure is calibrated to an outcome that occurs almost nowhere in the simulation.
What buys persistence
The real decision is not "what will the population be" but "which intervention most raises the probability the species is still here in 50 years". ModelRisk turns the question into a curve: persistence probability against programme intensity, for two competing strategies.
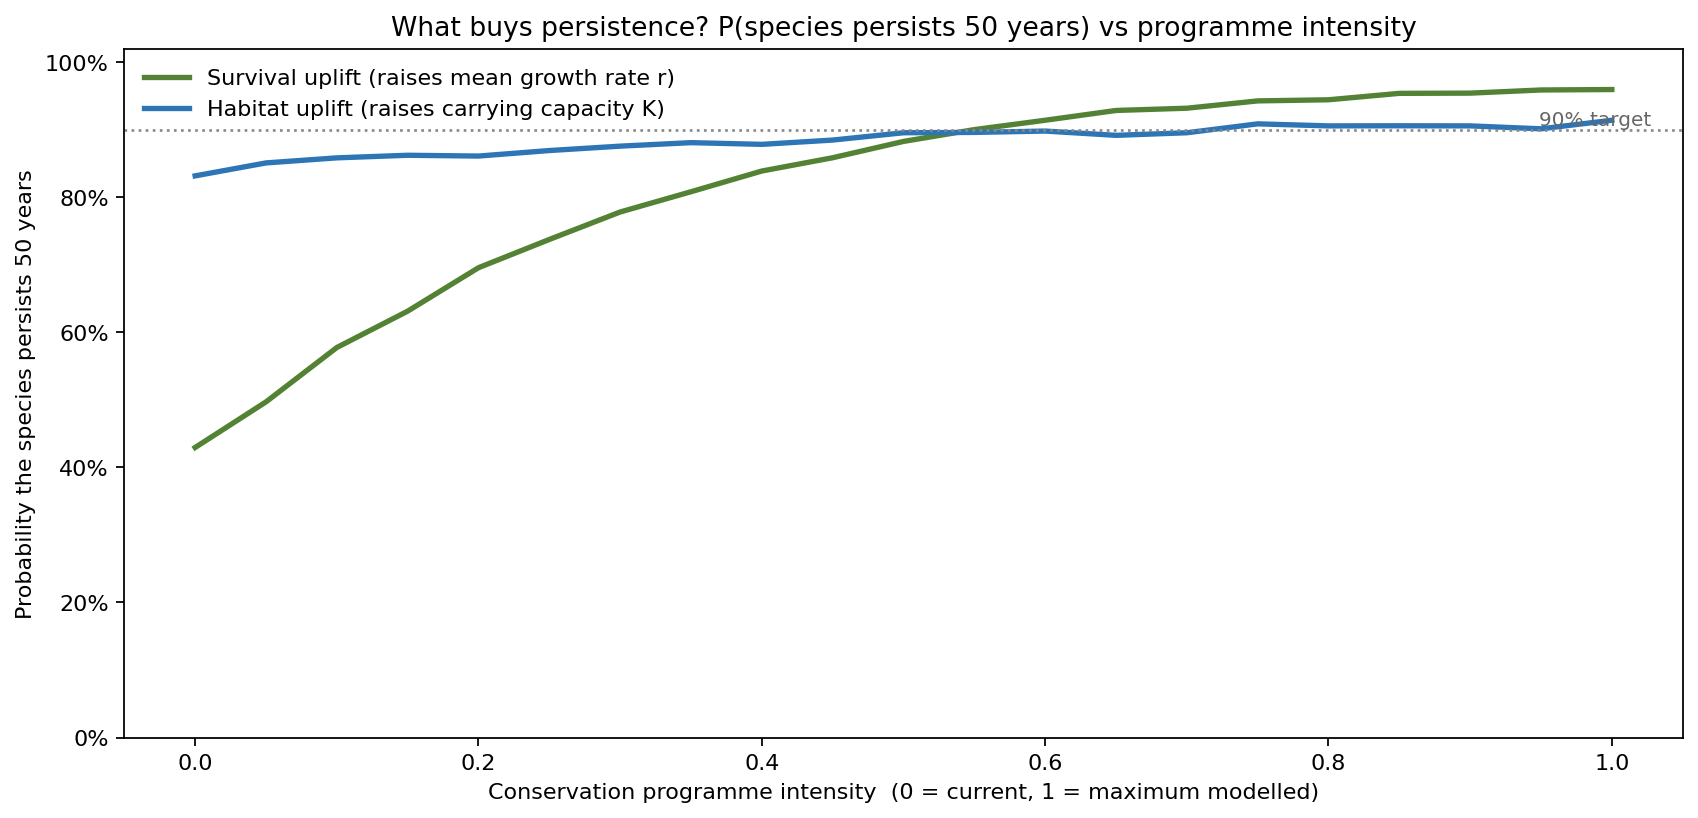
At the current growth rate the population persists with probability 0.88 — short of a 90% target. A survival-uplift programme (predator control, disease management) that lifts the mean growth rate to r = 0.11 clears 90%, and pushing it to r = 0.20 reaches 0.96. A habitat-uplift programme that enlarges carrying capacity to 900 reaches only 0.91. For this population, raising survival buys persistence faster than adding space — because the risk lives in bad years and catastrophes, not in crowding against the ceiling.
What drives quasi-extinction risk
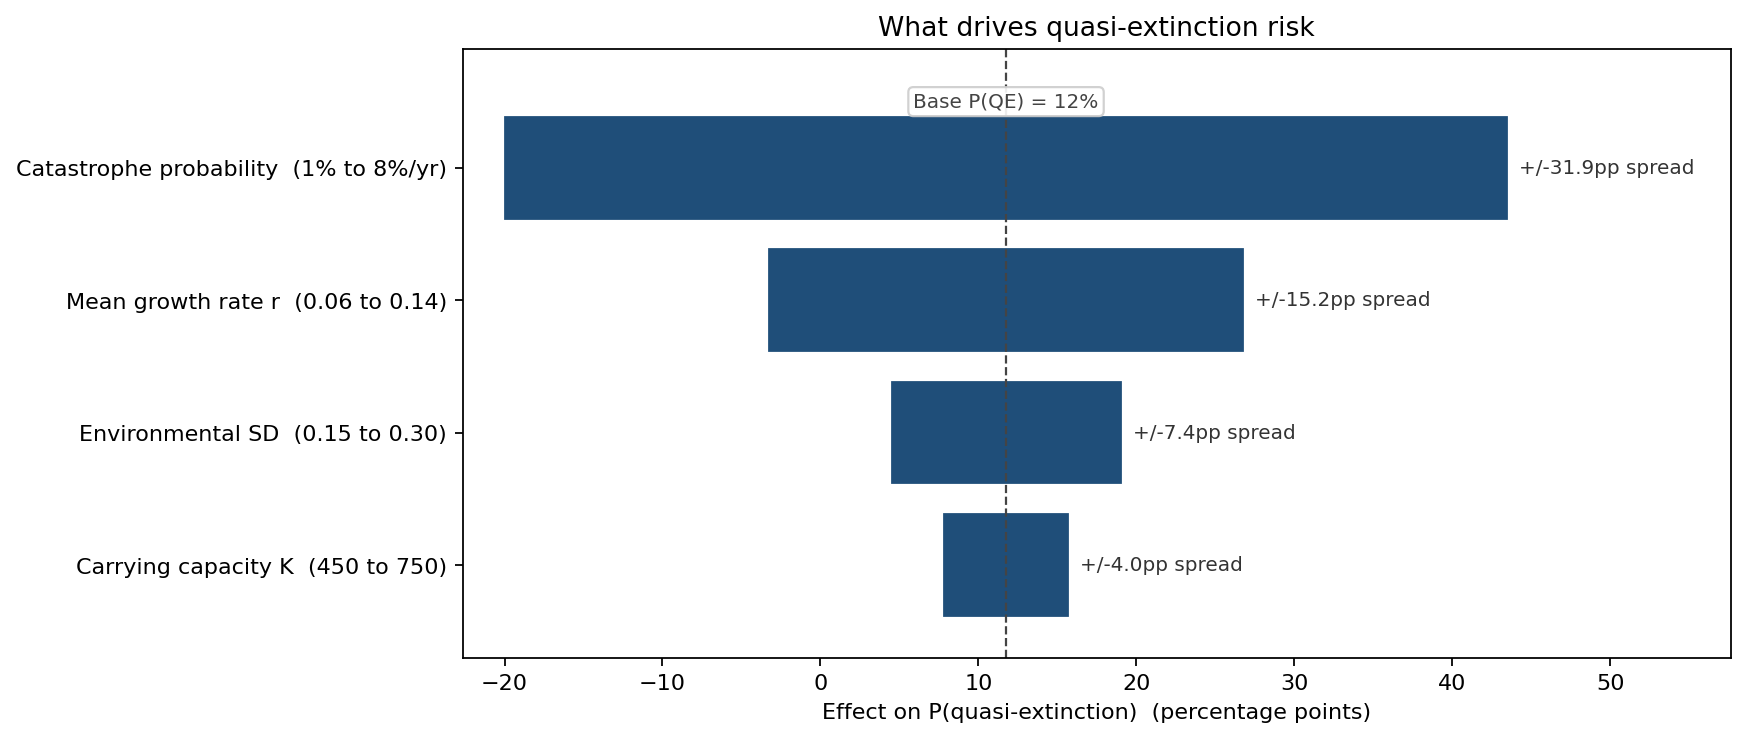
Moving each input across a plausible range and measuring the effect on P(quasi-extinction) ranks the levers cleanly. Catastrophe probability dominates: swinging it from 1% to 8% per year moves quasi-extinction risk across a 31.9 percentage-point spread (from 1.6% to 33.5%). Mean growth rate is next at 15.2 points, then environmental variability at 7.4 points, with carrying capacity last at 4.0 points. The ranking is the budget: a rare-catastrophe contingency — firebreaks, disease surveillance, an insurance sub-population — protects persistence more than enlarging the reserve does.
What the model changed
- Reclassified the population from "recovering" to "at risk", replacing the deterministic 595 endpoint with a 50-year quasi-extinction probability of 12% that monitoring policy now has to address.
- Prioritised catastrophe mitigation over habitat expansion, because catastrophe probability drives a 31.9-point swing in extinction risk versus 4.0 points for carrying capacity.
- Set a survival-uplift target of r = 0.11 as the cheapest route to the 90% persistence threshold, rather than the K = 900 land programme that reaches only 91%.
- Modelled environment as a shared annual factor, preserving the P10 of 140 animals that a per-individual independence assumption would have averaged out of existence.
ModelRisk Functionality Used
- Shared-factor Monte Carlo simulation of 40,000 fifty-year futures, with one environmental growth shock per year applied population-wide so demographic risk does not average away.
- Ricker density dependence with stochastic growth combining a Normal environmental shock (SD 0.22), Poisson demographic resampling, and a Bernoulli catastrophe (4%/yr, Beta severity) into one population trajectory.
- Quasi-extinction analysis computing the probability the population crosses the critical floor of 50 at any point in the horizon, not merely at its end.
- Intervention sweep comparing survival-uplift and habitat-uplift programmes as persistence-versus-intensity curves against a 90% target.
- Tornado sensitivity analysis ranking catastrophe probability, growth rate, environmental variability and carrying capacity by their effect on extinction risk.
A viable population is not a number that climbs to carrying capacity — it is a fan of futures, a handful of which end at the floor, and conservation has to be designed against that handful rather than against the comfortable average.