

Industry: Engineering
Product: ModelRisk
Application: Vibration analysis for structural integrity under uncertainty
A pump skid tuned 3 Hz clear of resonance still lands in the forbidden band half the time
An engineering firm qualifying a skid-mounted pump-and-piping package faced a vibration problem that looked solved on paper. The driving machine ran at 1,800 rpm — a 30 Hz first-order forcing line — and the package's first natural frequency had to stay outside a 27-33 Hz forbidden band to avoid resonance. The structural design hit a target first mode of exactly 33 Hz, clearing the forcing line by 3 Hz. The deterministic check passed and the skid was released for fabrication.
Built in ModelRisk and simulated across 60,000 nominally identical skids, the "3 Hz of margin" evaporated. The first natural frequency, computed from the square root of stiffness over mass with realistic fabrication scatter, came out with a mean of 33.1 Hz but a 5th-to-95th-percentile spread of 29.8 to 36.5 Hz. Because the 33 Hz target sits on the upper edge of the forbidden band, 49.8% of built skids land inside it — a coin-flip chance of resonance, completely invisible to the single-number design check. A parallel random-vibration calculation found a matching problem: 45.4% of skids exceed the 18 g acceleration limit.
Why a point estimate fails here
Natural frequency depends on stiffness and mass through a square root, and both of those depend on fabrication outcomes that vary unit to unit — weld metal, gusseting, fit-up, plate thickness. A single deterministic frequency is just one realization of that process. When the design target is placed at the edge of an exclusion band, the deterministic value can look safe while half the actual population spills across the line. The only honest answer is a probability of landing in the band — and for random-vibration response, a probability of exceeding the acceleration limit. ModelRisk produces both.
The model stays at component level and is built around the physics:
- Stiffness and mass are LogNormal, but they share a per-unit build factor: more weld metal makes a frame both stiffer and heavier. The shared factor correlates k and m positively, which is physically correct and stops the natural-frequency spread from collapsing to an unrealistically thin band.
- Damping ratio is LogNormal around a 3% nominal with a wide spread (sigma 0.35) — damping is notoriously the least predictable modal property.
- Random-vibration response uses Miles' equation, with the 3-sigma peak acceleration driven by the natural frequency, the amplification factor Q = 1/(2 zeta) and the input PSD.
The natural-frequency distribution against the forbidden band
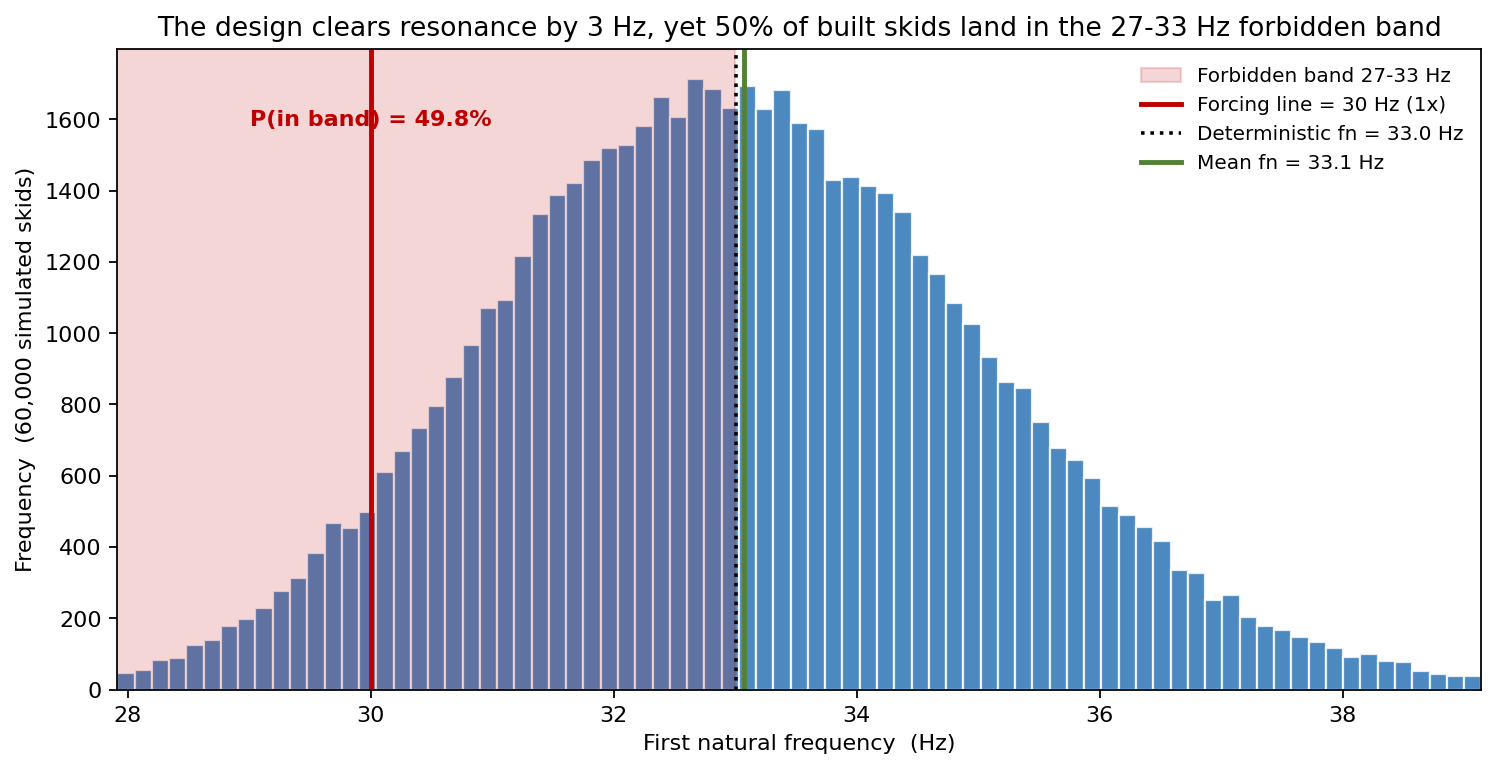
The headline output is the distribution of the first natural frequency with the 27-33 Hz forbidden band and the 30 Hz forcing line overlaid. The deterministic 33 Hz value sits precisely on the band's upper edge; the mean is 33.1 Hz, the P5 is 29.8 Hz and the P95 is 36.5 Hz. The shaded band captures the 49.8% of skids that fall in the forbidden region — and essentially none fall below it (0.1%), so the risk is entirely one-sided: build scatter that softens the frame drops it straight into resonance.
How much separation margin is actually needed
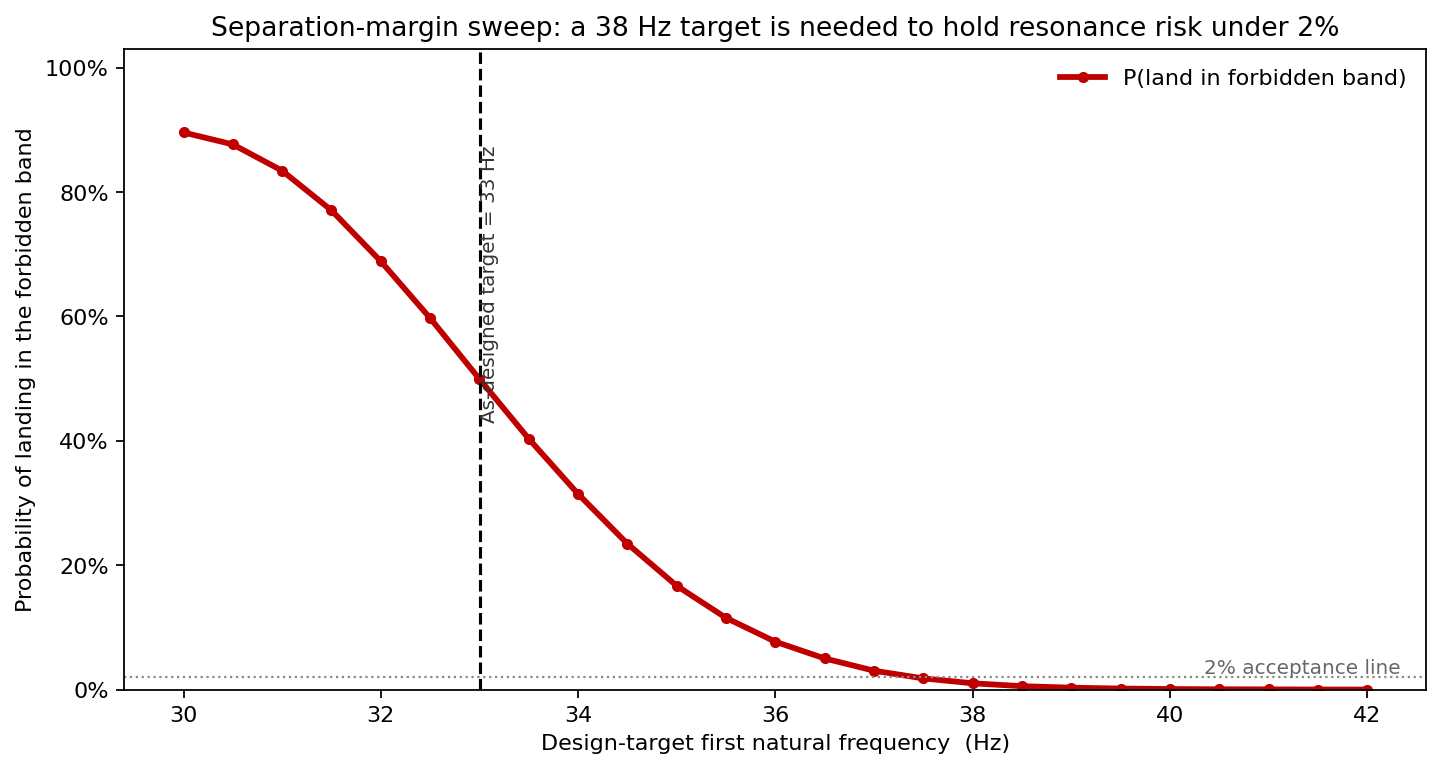
The natural question — how stiff must the redesign be? — is answered by sweeping the design-target frequency and recomputing the probability of landing in the band. At the as-designed 33 Hz target the probability is 49.9%; raising the target to 35 Hz drops it to 16.7%, 36 Hz to 7.7% and 37 Hz to 3.0%. The first target that holds resonance risk under the 2% acceptance line is 37.5 Hz — a +4 Hz retune from the original 33 Hz. This turns a vague "add stiffness" instruction into a quantified design requirement.
The random-vibration peak response
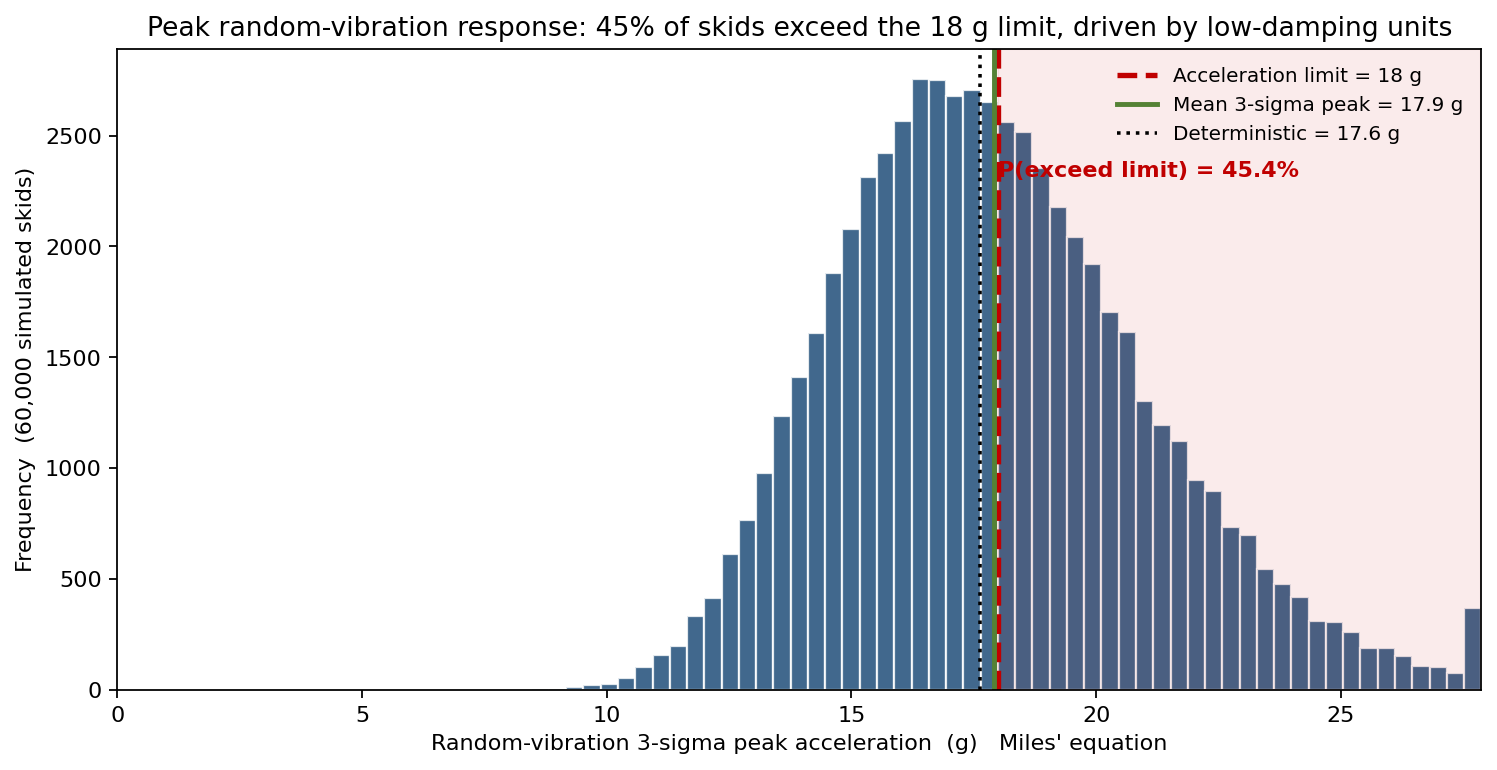
The second output is the distribution of the 3-sigma peak acceleration from Miles' equation. The deterministic value is 17.6 g, just under the 18 g qualification limit — another nominally passing check. The simulated population has a mean of 17.9 g, a P90 of 22.2 g and a P99 of 26.6 g, with 45.4% of skids exceeding the 18 g limit. The right tail is populated by the low-damping units: where Q is high, the response is amplified hard.
What drives the peak response
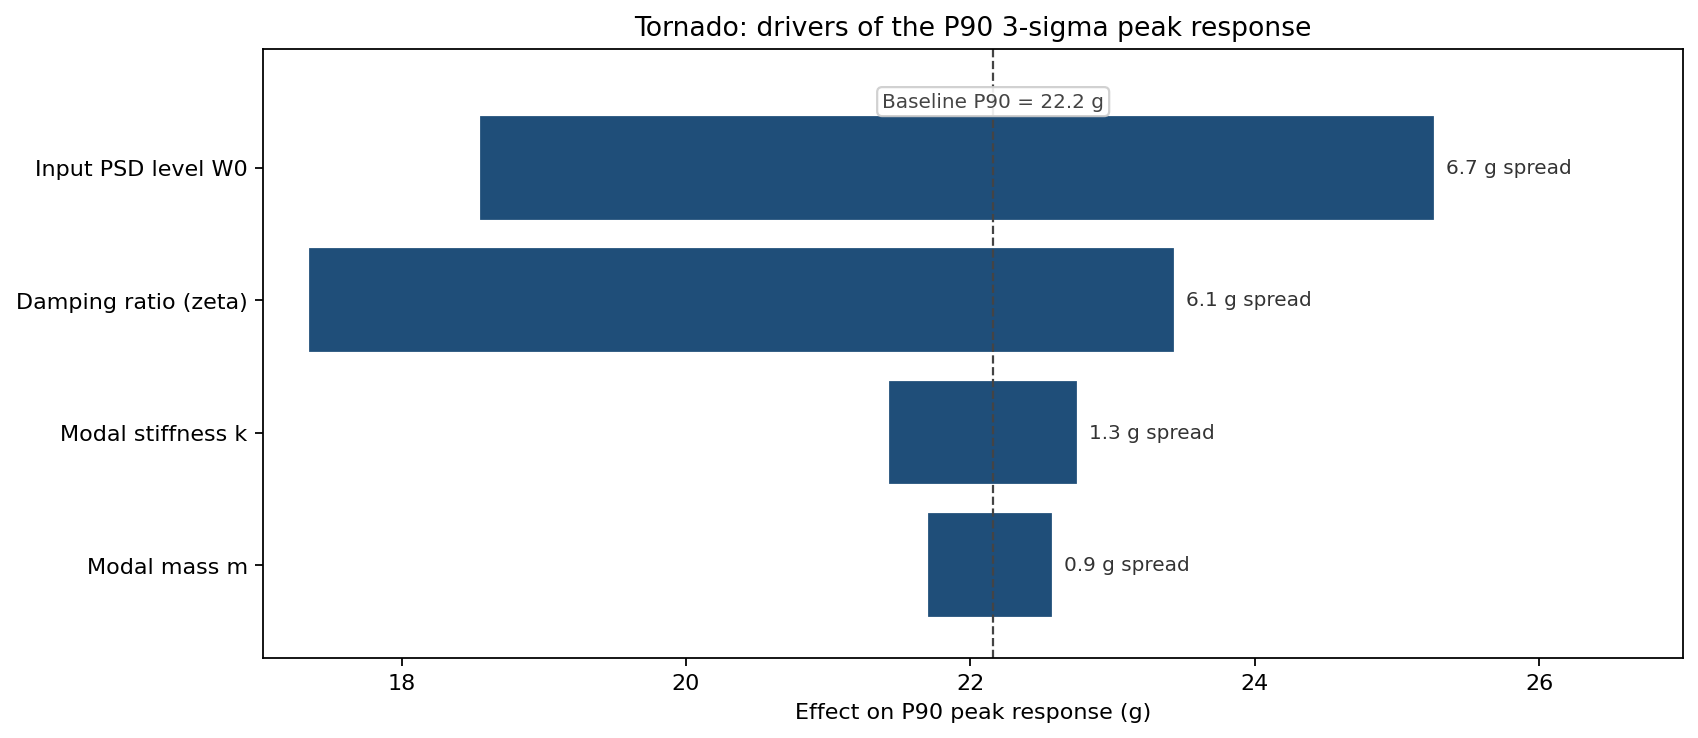
A tornado on the P90 peak response, baseline 22.2 g, isolates the controlling inputs. The input PSD level has the widest swing (6.7 g spread) and the damping ratio is close behind (6.1 g spread), with low damping alone pushing P90 down by 4.8 g when damping is high — confirming that securing realistic damping is the highest-value design action. Modal stiffness and mass scatter move P90 by under 1.5 g each, so chasing tighter dimensional tolerances would be wasted effort against the response problem.
What the model changed
The deterministic checks — 33 Hz natural frequency, 17.6 g peak response — both passed, and the skid would have shipped with a coin-flip resonance risk and a near-coin-flip overstress risk baked in. The probabilistic analysis reframed the design as a population problem: half of units in the forbidden band, 45% over the acceleration limit. The firm retuned the structure to a 37.5 Hz target to pull band-entry probability under 2%, and prioritized a measured-damping qualification test over tighter machining tolerances, since damping — not dimensions — drove the response tail.
ModelRisk functionality used
- Monte Carlo simulation propagating uncertain stiffness, mass and damping through the natural-frequency and Miles'-equation response models.
- LogNormal distributions for stiffness, mass and damping, with a shared per-unit build factor correlating stiffness and mass.
- Parameter sweep of the design-target frequency to size the required separation margin against a 2% acceptance criterion.
- Sensitivity analysis (tornado) to rank drivers of the peak-response tail.
- Probability and percentile outputs delivering P(resonance) and P(exceed limit) directly.