

Industry: Engineering
Product: ModelRisk
Application: Modeling Thermal Properties Under Uncertainty
The Catalogue Says R-5.0, the Lots Deliver a 24% Chance of Missing R-4.4: Propagating Measured Property Scatter
An insulation board carries a catalogue thermal conductivity of 0.0240 W/mK. Divide the 120 mm board thickness by that single number and the installed thermal resistance is exactly R = 5.00 m2K/W — comfortably above the project's R-4.4 design allowable. But conductivity is not one number; it is a measured distribution that scatters from production lot to production lot, and in service it drifts upward as the board picks up moisture. When that measured scatter and the aging uplift were propagated through ModelRisk, the delivered R-value came in at a mean of 4.69 and a 24.2% probability of falling below the R-4.4 allowable — a one-in-four shortfall the catalogue figure simply does not contain.
This case is not about one device's temperature or the stress from a temperature swing. It is about characterising the material property itself from lab scatter and propagating that scatter into a derived performance metric.
Why a catalogue value is not a design value
The installed resistance of a board is
R = d / k_eff
where d is the as-built thickness and k_eff the in-service conductivity. The catalogue gives a single k, but the qualification lab measures something messier: each production lot has its own mean conductivity, coupons within a lot scatter around it, and once installed the board's conductivity rises as moisture displaces trapped air. Thickness has a manufacturing tolerance of its own. A design built on the catalogue mean implicitly assumes the best case of all of these at once — exactly the assumption a measured-scatter model is built to test.
Characterising the properties from measured scatter
Rather than invent distributions, the team fitted them to the qualification data:
- Dry conductivity k0 — a per-lot mean drawn Normal(0.0240, 0.0016) W/mK across 50 lots, plus within-lot coupon scatter (sd 0.0009 W/mK). The shared per-lot bias is essential: boards from one lot are correlated, so independent-coupon sampling would wrongly thin the tail by the central limit theorem. The combined measured spread gives a P10-P90 of 0.0215-0.0260 W/mK.
- Aging / moisture uplift — Triangular(1.00, 1.06, 1.18) multiplier on conductivity, so k_eff = k0 x uplift. Most boards drift modestly; a tail soaks up enough moisture to conduct 18% more.
- Density rho — Normal, 32.0 kg/m3 with a per-lot blend bias (combined sd about 1.6 kg/m3).
- Specific heat cp — Normal(1450, 45) J/kgK.
- Board thickness d — Normal(120 mm, 2.5 mm) manufacturing tolerance.
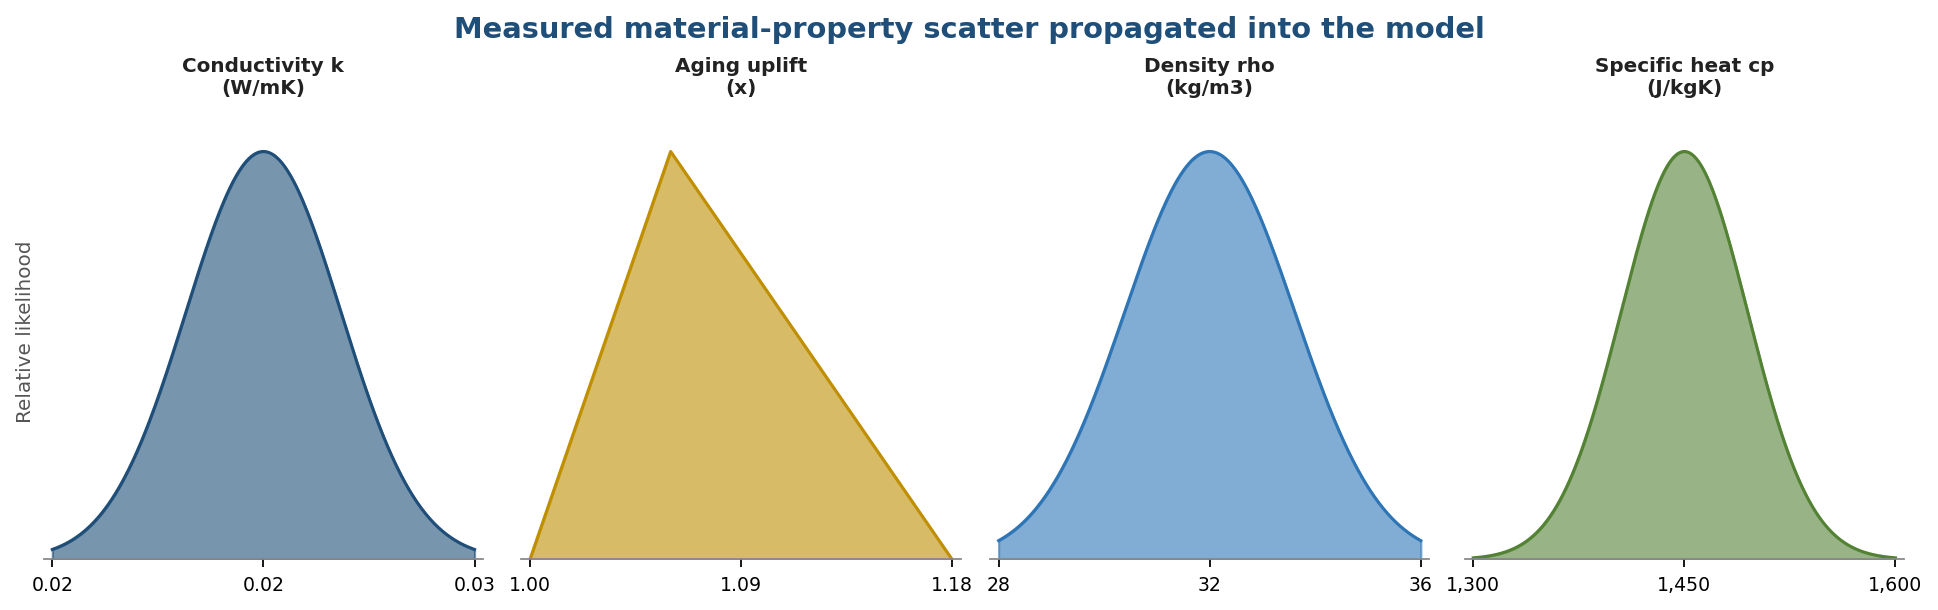
These four input distributions are the characterisation made visible: conductivity centred at 0.0240 W/mK with a combined lot-plus-coupon sd near 0.0018 W/mK; the 1.00 / 1.06 / 1.18 aging uplift; density at 32.0 kg/m3; specific heat at 1450 J/kgK. Propagating density and specific heat alongside conductivity also yields the dry thermal diffusivity D = k / (rho x cp) directly — mean 0.516e-6 m2/s, P10-P90 0.453-0.578e-6 m2/s — the transient-sizing property the same measured scatter feeds.
What the propagated scatter does to the delivered R-value
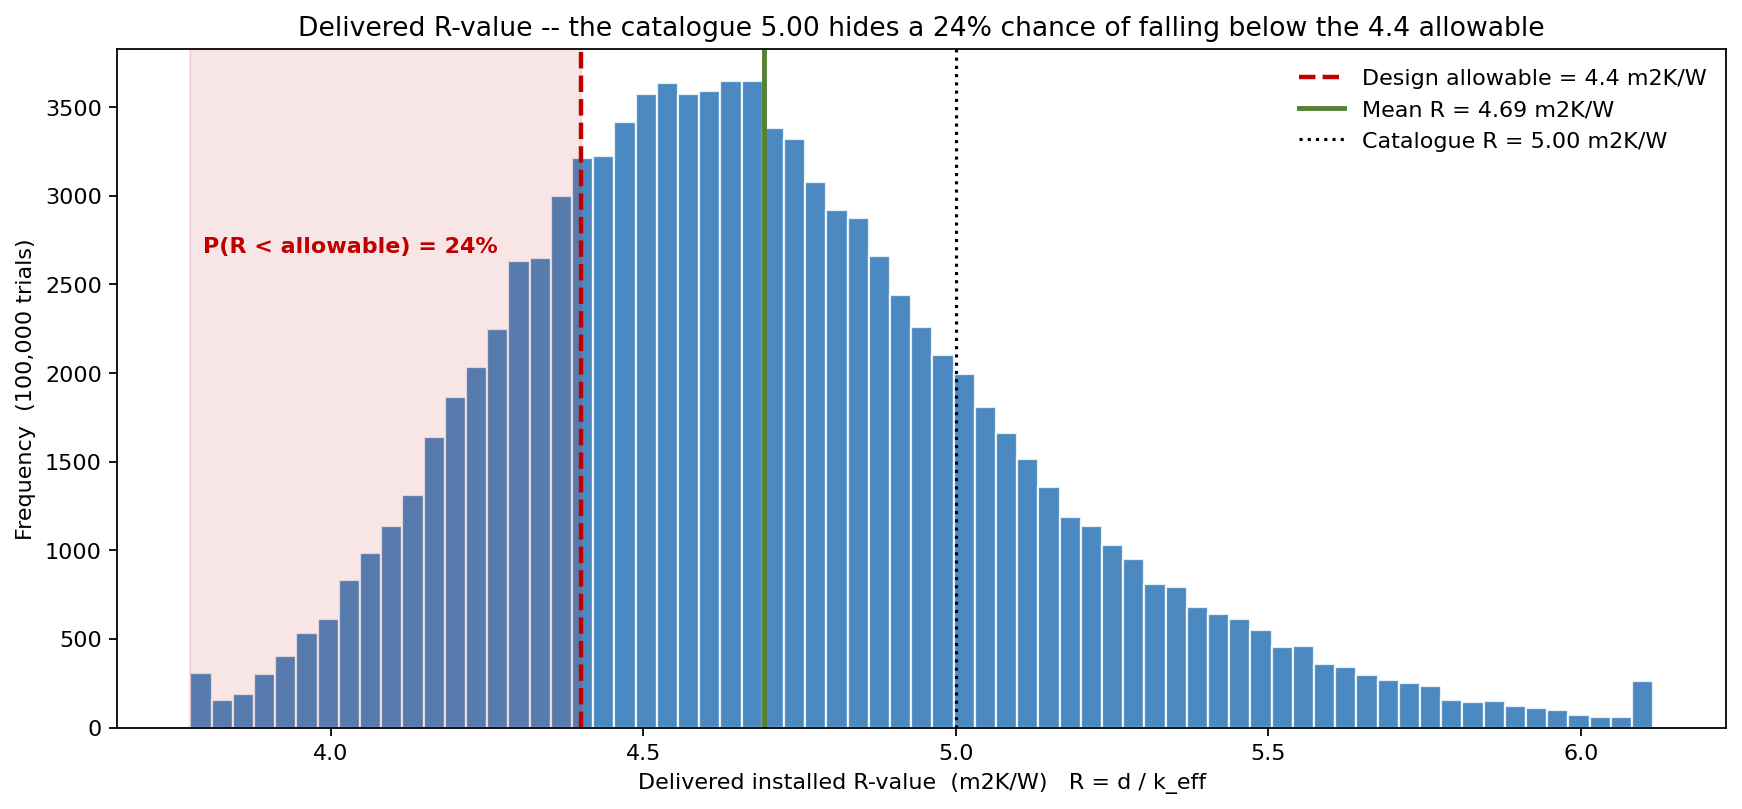
The headline is the gap between the catalogue point and the delivered distribution. The catalogue R is 5.00 m2K/W; the delivered mean is 4.69, P10 is 4.21, P50 is 4.65 and P90 is 5.23. Against the R-4.4 design allowable, 24.2% of installed boards fall short. The catalogue number sits a full 0.31 m2K/W above the delivered mean — not because the catalogue is wrong, but because it reports the dry, best-coupon value while the design has to live with the whole measured-and-aged distribution.
Which property drives the shortfall
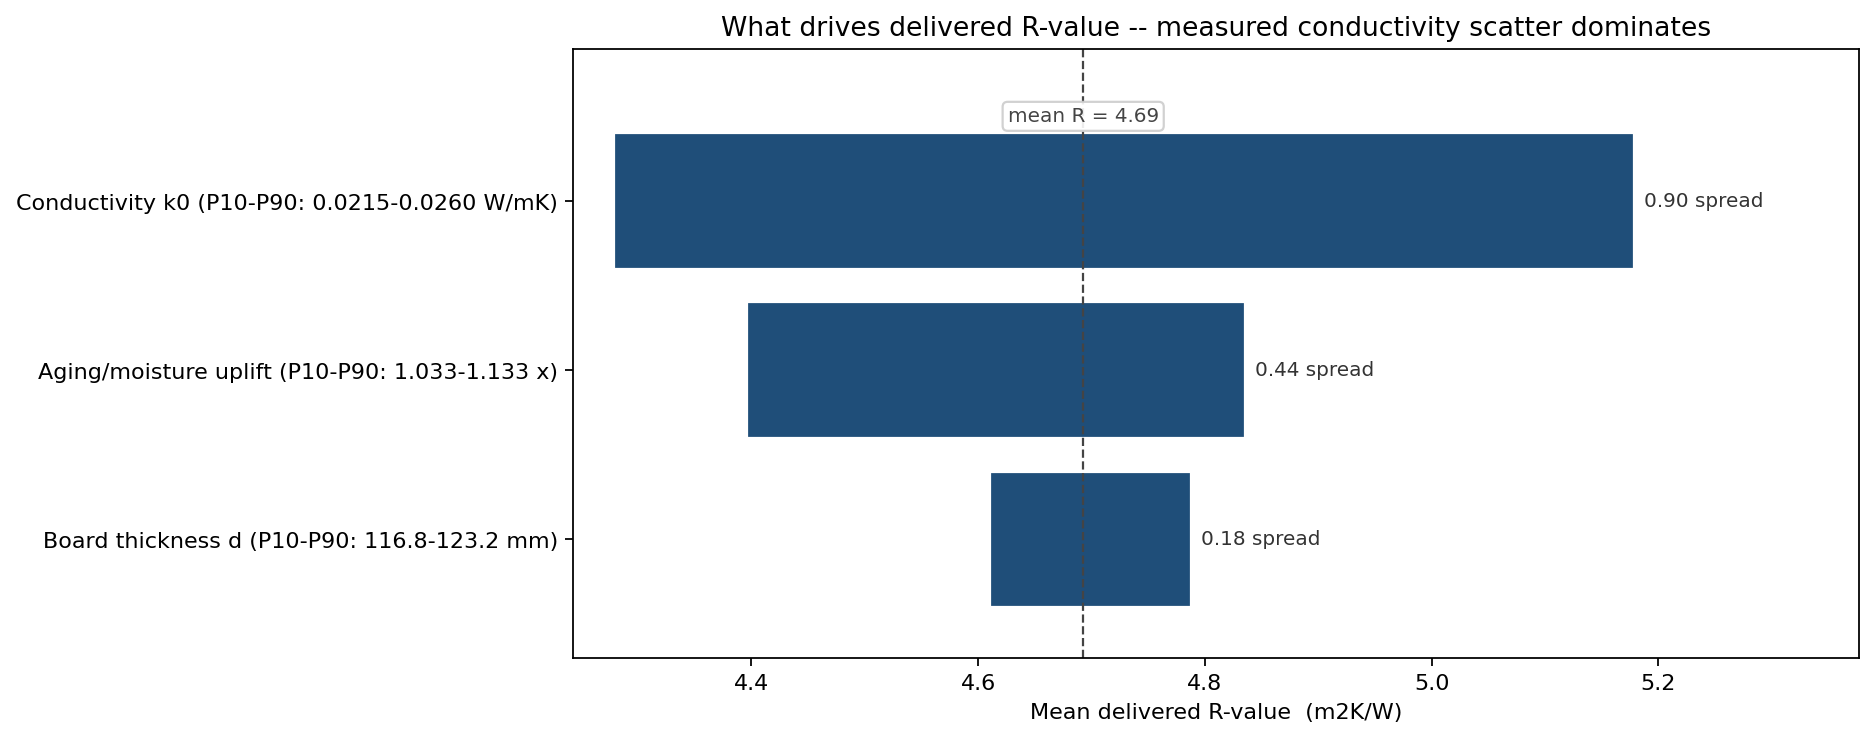
Sweeping each input across its P10-P90 while the rest stay stochastic ranks the contributors against the 4.69 baseline:
| Input | R at P10 input | R at P90 input | Spread |
|---|---|---|---|
| Conductivity k0 | 4.28 m2K/W | 5.18 m2K/W | 0.90 |
| Aging / moisture uplift | 4.40 m2K/W | 4.84 m2K/W | 0.44 |
| Board thickness d | 4.61 m2K/W | 4.79 m2K/W | 0.18 |
Measured conductivity scatter dominates: its P10-P90 band swings the delivered R-value by 0.90 m2K/W, twice the aging uplift and five times the thickness tolerance. The lesson for the supplier is direct — tightening lot-to-lot conductivity consistency, not adding board thickness, is the efficient way to close the shortfall.
How much thickness it takes to hold the allowable
Because thickness is a cheaper lever to pull in the short term than re-qualifying the material, the team also sized the brute-force fix: how thick must the board be for the R-shortfall to stay acceptable, given the measured conductivity scatter?
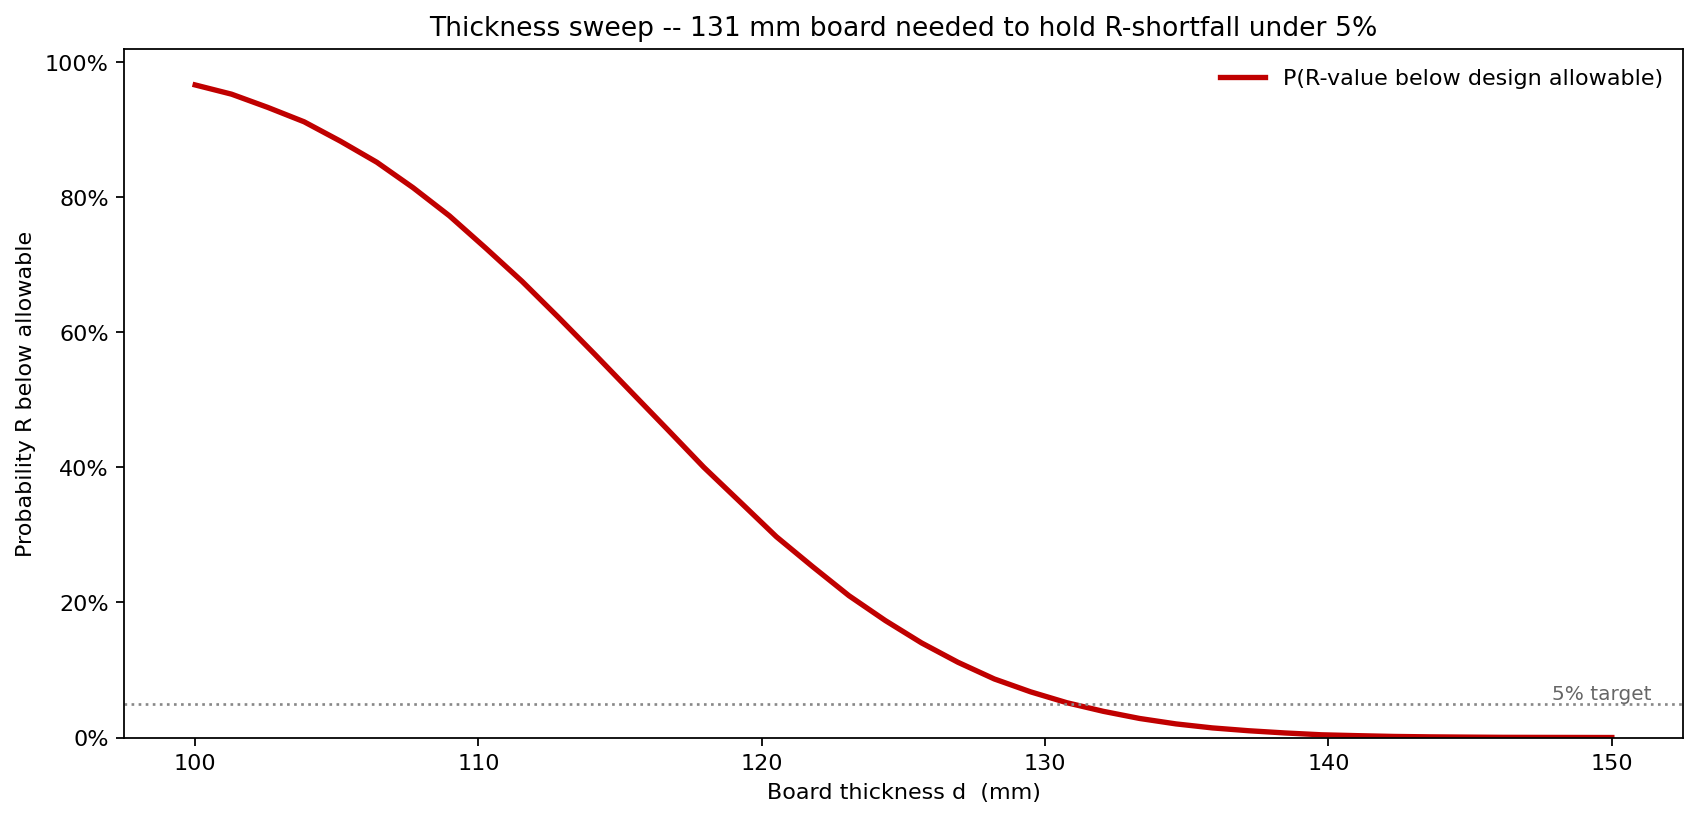
- At 110 mm, P(R below allowable) is 73.4%.
- At 120 mm (the current board), 31.8%.
- At 130 mm, 6.1%.
- At 140 mm, 0.4%.
Holding the shortfall under 5% requires a 131 mm board. That number framed the trade cleanly: 11 mm of extra thickness to brute-force the allowable, versus a supplier conductivity-consistency improvement that the tornado showed would be far more material-efficient.
What the model changed
- An incoming-conductivity acceptance band was set on lot mean k0, after the model showed lot-to-lot conductivity scatter (0.90 m2K/W of R-spread) was the dominant shortfall driver — replacing reliance on the catalogue value.
- Board thickness raised to the 131 mm point as an interim guarantee, the value the sweep showed holds the R-shortfall under 5% while the supplier tightened conductivity.
- Aging uplift written into the design basis as a Triangular(1.00, 1.06, 1.18) factor on k, so the delivered R is qualified in its moist in-service state rather than dry.
- A 24% allowable-shortfall figure replaced the R-5.0 catalogue claim in the thermal submittal, giving the client a probability of non-conformance instead of a single optimistic number.
ModelRisk Functionality Used
- Property-scatter propagation carrying measured k0, density, specific heat, aging uplift and thickness through R = d / k_eff into a delivered-R distribution (mean 4.69, P10 4.21), exposing a 24% shortfall the R-5.0 catalogue value hid.
- Per-lot common-mode conductivity bias across 50 production lots, preventing the central-limit collapse that independent-coupon sampling would have produced and preserving the low-R tail.
- Derived-metric propagation computing thermal diffusivity D = k / (rho x cp) from the same inputs (mean 0.516e-6 m2/s) for transient sizing alongside the steady R-value.
- Property tornado ranking measured conductivity scatter (0.90 m2K/W of R-spread) above aging and thickness, pointing the corrective action at lot consistency rather than board thickness.
- Thickness sweep locating the 131 mm board that holds the allowable shortfall under 5%, sizing the interim fix against the supplier-improvement alternative.
A deterministic property table answers "what is the R-value?" with a single catalogue number; Monte Carlo answers "what fraction of delivered boards miss the allowable once measured scatter and in-service aging are propagated?" — and here that answer was 24%, invisible in the catalogue R-5.0.