

Industry: Engineering
Product: ModelRisk
Application: Assessing Structural Integrity Under Uncertainty
The Detail Has a 40-Year Life on Paper. One in Eight Reaches Critical Before Year 11 — and a Six-Year Inspection Interval Is Already Too Long.
Run the damage-tolerance calculation on a welded bridge floor-beam connection and the deterministic answer is comforting: a 0.5 mm fabrication flaw growing under traffic by the Paris law da/dN = C(dK)^m takes about 80 million cycles — roughly 40 years at 2 million cycles a year — to reach the 118 mm critical size set by the steel's fracture toughness. Inspect every six years and there is decades of margin.
But the initial flaw size, the crack-growth coefficient C, the stress range, and the fracture toughness all scatter from detail to detail, and crack growth is a violently nonlinear function of them. Pushing those uncertainties through the integration with Monte Carlo turns the single 40-year number into a distribution with a heavy short-life tail: mean 54 years, but a P5 of 11 years and a P1 of 6.3 years. The probability a detail reaches critical before its next six-year inspection is 0.81% — and the longest inspection interval that holds failure probability at or below the 0.1% acceptance target is only 3.2 years. The deterministic life looks safe; the inspection interval built on it is not.
A bridge-asset engineering firm adopted ModelRisk to set inspection intervals from a fleet-wide failure probability rather than a single mean-life estimate.
Why a point estimate fails for crack growth
A fatigue life is not an average of many small independent increments — it is a steep, nonlinear functional of a handful of uncertain inputs, and that makes it unforgiving of point estimates in two ways.
First, the integral is dominated by the early, slow-growth phase, where small differences in the initial flaw size and the Paris coefficient compound. A detail with a flaw twice the nominal size and a growth rate 60% above nominal does not lose a little life — it loses most of it. The deterministic 40-year life is near the median of the simulated life, so half of all details are worse, and the worst few percent are dramatically worse.
Second, bad details are bad on every axis at once. A poorly-welded detail tends to start with a larger flaw, grow it faster, and tolerate less before fracture — initial flaw, Paris C, and fracture toughness move together. We modelled that with a single per-detail build/material factor linking all four inputs. With independent inputs the probability of failure before the six-year inspection is 0.19%; with the shared build factor it is 0.81% — a 4.2x increase. A naive independent treatment understates the early-failure risk by more than fourfold, precisely because it lets a bad weld be unlucky on only one axis at a time.
The headline: the remaining-life distribution
The clearest picture is the distribution of remaining fatigue life, with the inspection window marked.
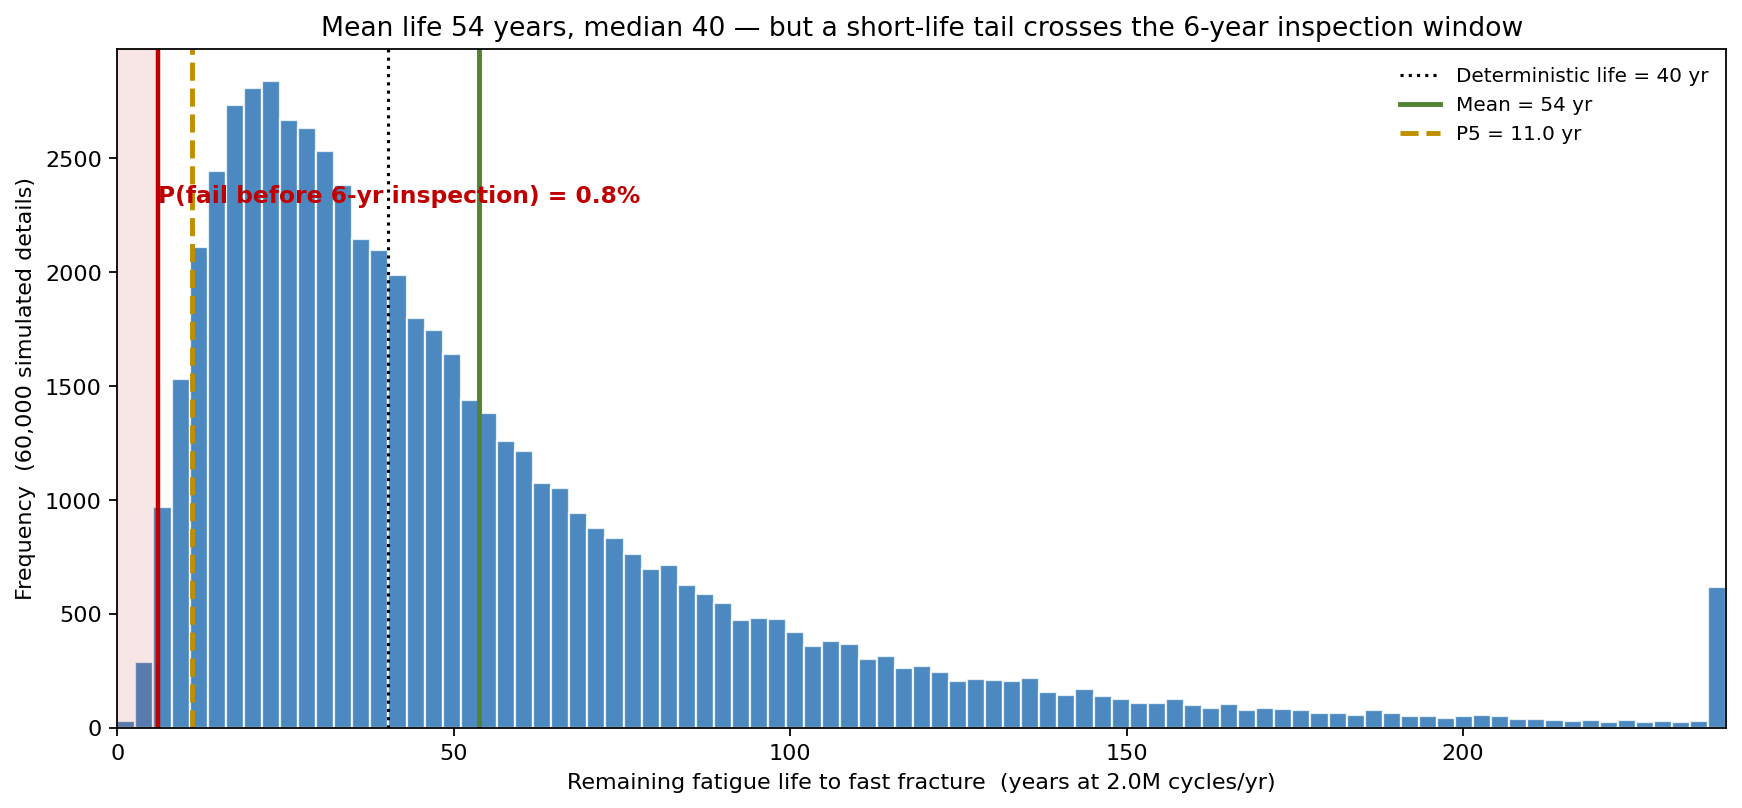
- Mean remaining life 54 years, median 40 years.
- Deterministic life 40 years (the dotted line) sits at the median — half the population is worse.
- P5 life 11 years; P1 life 6.3 years.
- The shaded region below six years carries 0.81% of all details — P(failure before next inspection).
The short-life tail, not the mean, is what an inspection interval has to be safe against.
How the inspection interval drives failure probability
The interval is the lever the asset owner actually controls. Sweeping the inspection interval and recomputing the probability that a detail fails within it produces the decision curve below.
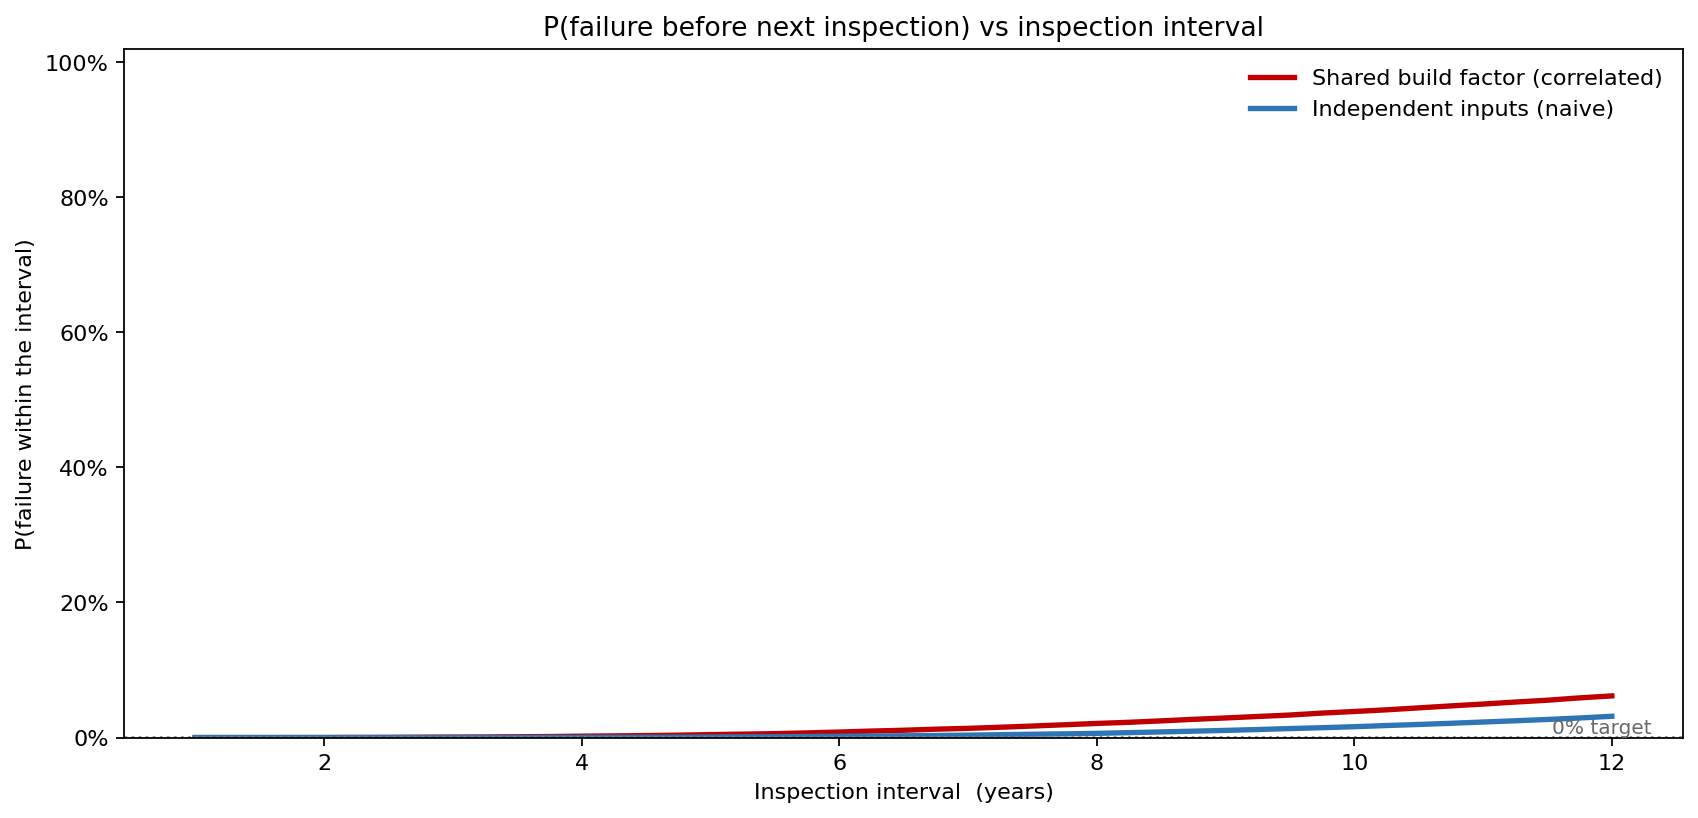
- At the current six-year interval, P(failure within the interval) is 0.81%.
- At a three-year interval it falls to 0.072% — just inside the 0.1% acceptance target.
- At a nine-year interval it rises to 2.90%.
- The longest interval that holds the 0.1% target is 3.2 years.
The independent-input curve sits well below the correlated one across the whole range: an interval set on the naive model would be roughly double the safe length.
Watching the cracks grow
Plotting a sample of crack-growth trajectories shows why the tail behaves as it does — most details creep along almost flat for decades, while a few accelerate to critical early.
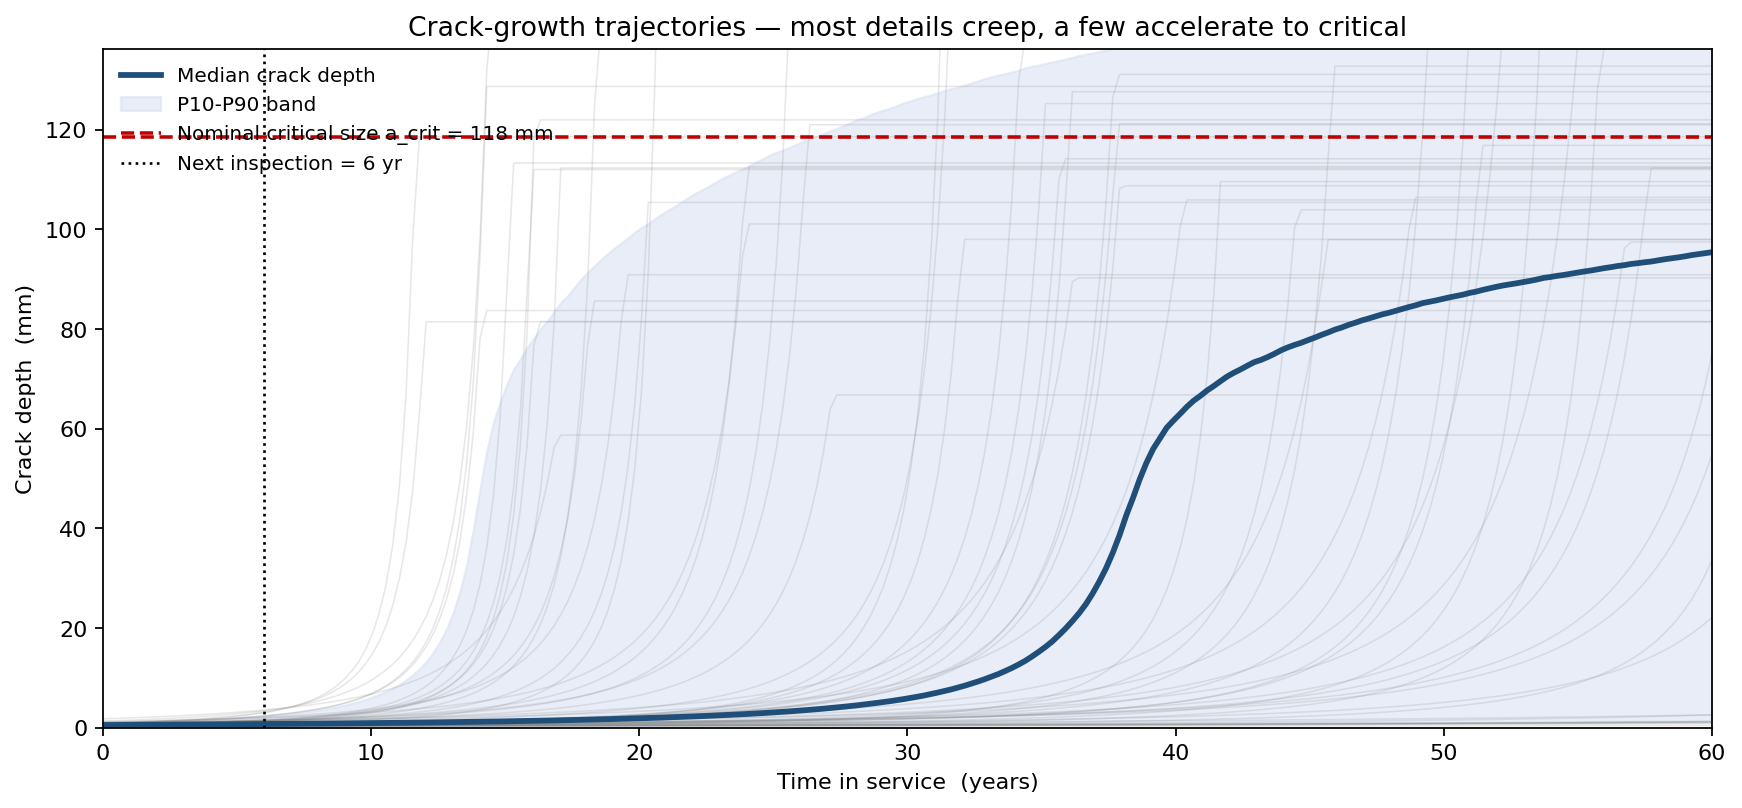
- Median crack depth at the six-year inspection is just 0.70 mm — most details have barely grown.
- The P90 depth at six years is 2.32 mm, still far below the 118 mm critical size.
- But the steep individual trajectories — the unlucky high-C, large-flaw, low-toughness details — are the ones that reach critical inside the inspection window, and they are invisible in the median.
The fan makes the damage-tolerance argument visually: the population is overwhelmingly safe, and the inspection interval exists to catch the steep minority before they reach critical.
Which inputs the answer depends on
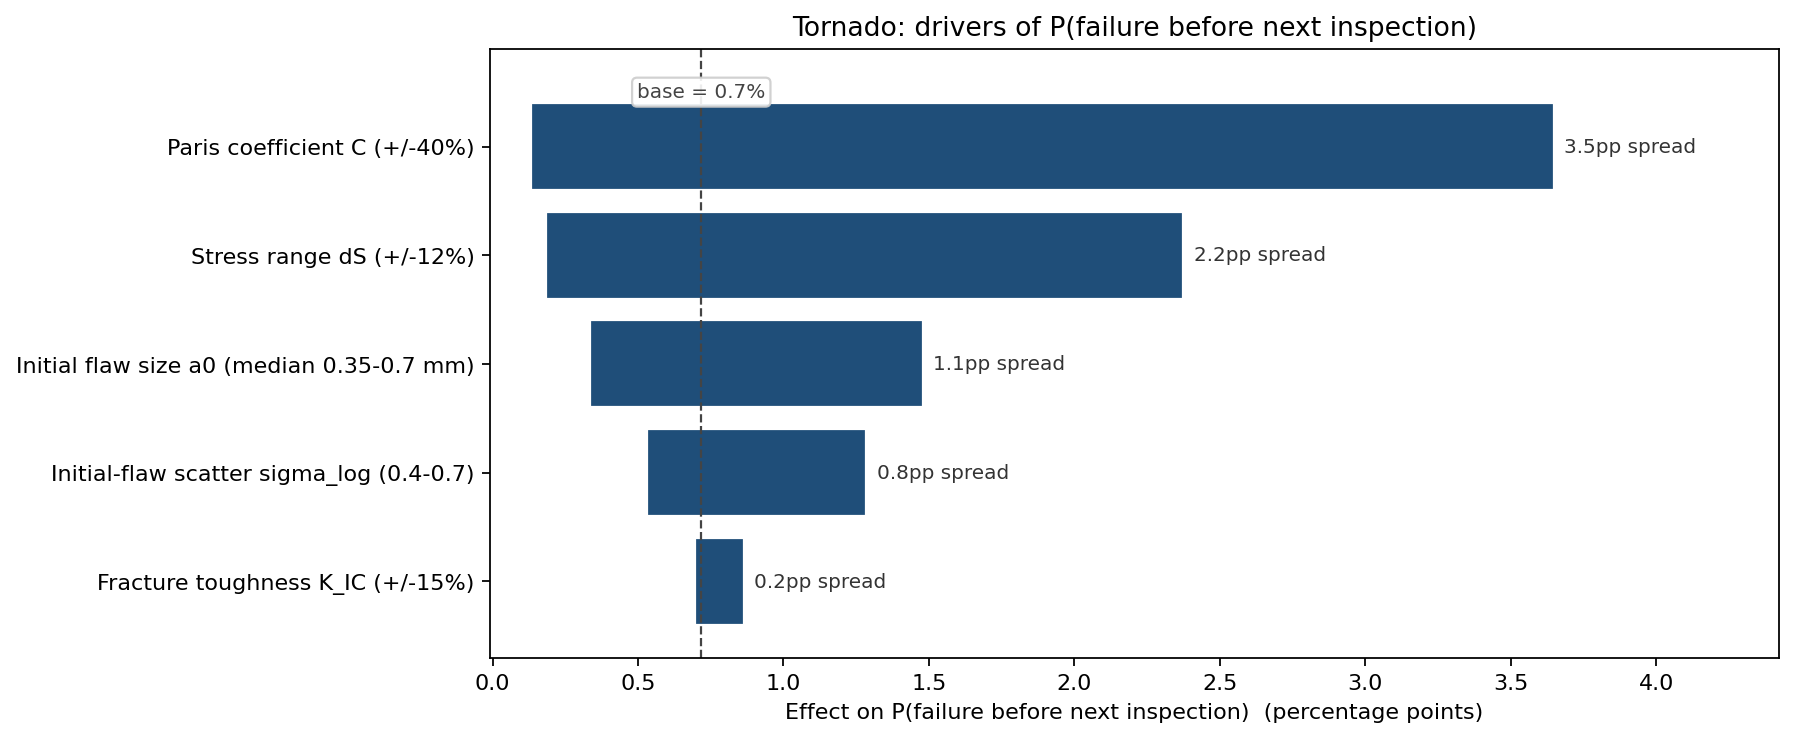
Swinging each input across its plausible range and recomputing P(failure before the six-year inspection) (base 0.72%) ranks the drivers:
- Paris coefficient C (+/-40%): 0.13% to 3.65% — a 3.52-point swing, the dominant driver.
- Stress range dS (+/-12%): 0.18% to 2.38% — 2.19 points (amplified by the cube in dK^3).
- Initial flaw size a0 (median 0.35 to 0.7 mm): 0.34% to 1.48% — 1.15 points.
- Initial-flaw scatter sigma_log (0.4 to 0.7): 0.53% to 1.29% — 0.76 points.
- Fracture toughness K_IC (+/-15%): 0.70% to 0.86% — 0.17 points.
The crack-growth rate and the stress range dominate; fracture toughness barely moves the answer because it only sets the far-away critical size, not the slow early growth that consumes the life. That pointed the firm at weld-quality control (which governs C and a0) and at traffic-load management (dS) rather than at material toughness certification.
What the model changed
The firm cut the inspection interval on this detail class from six years to three, bringing P(failure between inspections) inside the 0.1% target, and added a one-off baseline ultrasonic survey to screen out the large-initial-flaw details that own the short-life tail. Removing the worst 5% of initial flaws at the baseline survey lifted the fleet P5 life from 11 years toward the median, allowing the three-year interval to be revisited upward at the next review. Inspection budget was reallocated from uniformly-aged details to the weld classes the model flagged as short-tailed.
ModelRisk Functionality Used
- Monte Carlo integration of the Paris crack-growth law per detail, converting a deterministic 40-year life into a full remaining-life distribution (mean 54 yr, P5 11 yr, P1 6.3 yr).
- LogNormal initial flaw, LogNormal Paris coefficient, LogNormal stress range and LogNormal toughness — every input kept physically positive, with the critical crack size derived from sampled fracture toughness.
- A shared per-detail build/material factor linking flaw size, growth rate and toughness, so a poor weld is correctly modelled as bad on every axis at once — raising P(early failure) 4.2x over a naive independent model.
- An inspection-interval sweep identifying 3.2 years as the longest interval that holds the 0.1% between-inspection failure target, against the six-year interval the deterministic life implied.
- Sensitivity ranking showing crack-growth rate and stress range, not fracture toughness, drive early failure — redirecting effort to weld quality and load management.
A damage-tolerance case is an argument about the tail of a life distribution. ModelRisk computes the tail; the deterministic life only computes its median.