

Industry: Engineering
Product: ModelRisk
Application: Quantifying structural dynamics under uncertainty
The Hand Calculation Gave a Dynamic Amplification of 2.4 — Safely Below the Limit of 3.0. The Simulation Says There Is a 28% Chance of Breaching It.
A steel mezzanine floor supports reciprocating machinery running at a fixed 5.0 Hz. The floor is designed for a natural frequency of 6.5 Hz, putting the forcing-to-natural frequency ratio at 0.77 — comfortably below resonance — and a textbook steady-state dynamic amplification factor (DAF) of 2.4 against a serviceability limit of 3.0. On paper the design has margin. But the natural frequency \(f_n = \tfrac{1}{2\pi}\sqrt{k/m}\) is not a number, it is a distribution: composite action, connection fixity, a concrete topping that may be cracked or uncracked, and superimposed mass all move it. Because DAF rises steeply as the frequency ratio approaches one, a modest downward drift in the as-built \(f_n\) toward the 5.0 Hz forcing line produces a large jump in response. Simulated across 60,000 nominally-identical floors, the mean DAF is 3.0, the P95 is 5.7, and the probability of exceeding the serviceability limit is 28% — for a structure the deterministic calculation declared safe.
A global engineering firm adopted ModelRisk to recast its dynamic checks near forcing frequencies as probabilistic, rather than trusting a single amplification number computed at the design natural frequency.
Why the point-estimate DAF fails
The dynamic amplification factor for a single-degree-of-freedom system under harmonic forcing is
\[ \mathrm{DAF}(r,\zeta) = \frac{1}{\sqrt{(1-r^2)^2 + (2\zeta r)^2}}, \qquad r = \frac{f_{force}}{f_n} \]
Two properties make a point estimate dangerous. First, DAF is sharply non-linear in \(r\): near \(r=1\) it blows up, so the average of DAF over a spread of \(f_n\) is much larger than the DAF computed at the average \(f_n\) — Jensen's inequality in action. Computing DAF at the design \(f_n\) of 6.5 Hz gives 2.4; the mean DAF once \(f_n\) is allowed to vary is 3.0, 23% higher, and the distribution has a long resonant tail the single number cannot show. Second, the structure is governed by damping, the least knowable dynamic parameter — and damping only matters near resonance, exactly where the point estimate has no resolution.
A point estimate of 2.4 hides a fat resonant tail
The headline result is the distribution of the dynamic amplification factor across all simulated floors.
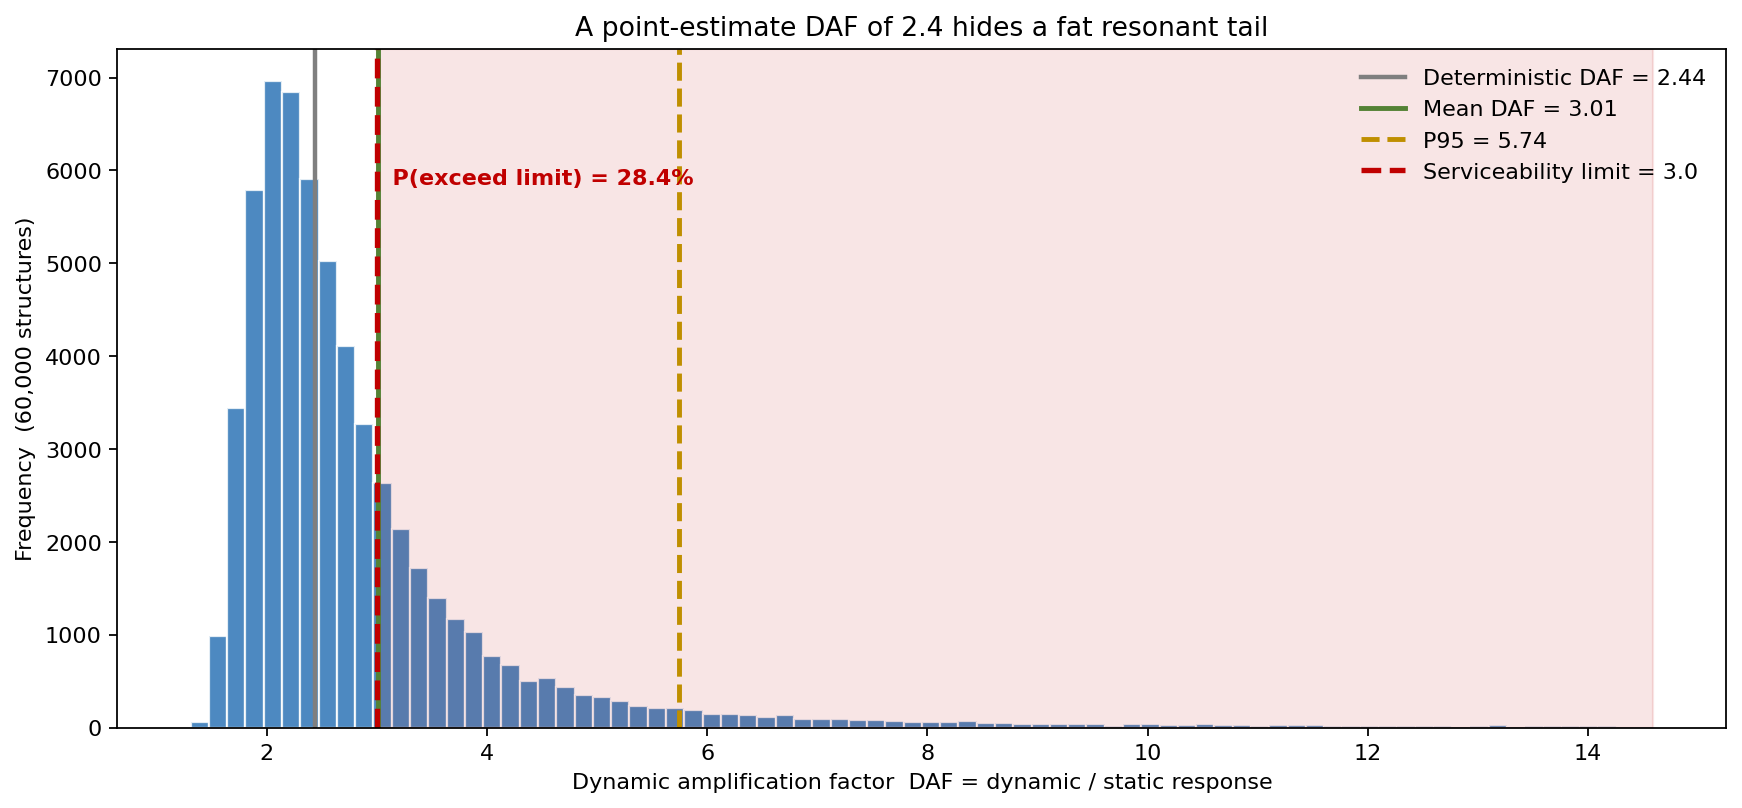
- Deterministic DAF 2.44 (computed at the design \(f_n\)).
- Mean DAF 3.01 — 23% above the deterministic figure.
- P95 5.74.
- P99 12.52.
- P(DAF exceeds the 3.0 serviceability limit) 28.4%.
The dynamic deflection (static deflection × DAF) follows the same shape: a 1.8 mm static deflection becomes a mean 5.4 mm and a P95 of 10.3 mm. The "safe" point estimate sits below the median, while more than a quarter of the distribution lies beyond the limit.
Each input was modelled to its physical source
- Stiffness \(k\) — Lognormal, 14% coefficient of variation, capturing composite action, connection fixity and cracked-versus-uncracked topping, plus a per-structure modelling-bias regime: as-built floors are systematically a little stiffer or softer than the finite-element model, a shared shift that prevents the response averaging back to the design value.
- Mass \(m\) — Normal, 8% coefficient of variation, for finishes, superimposed dead load and live-load mass.
- Damping ratio \(\zeta\) — Lognormal with a 2.5% median and wide dispersion, bounded away from zero, reflecting how poorly damping is known for a bare steel-deck floor.
The natural frequency \(f_n = 6.5\sqrt{k/m}\) is then formed per draw, the ratio \(r = 5.0/f_n\) computed, and the DAF evaluated — a sharply non-linear transform that never collapses to a Gaussian.
Resonance risk climbs steeply as forcing nears the natural frequency
Sweeping the forcing frequency from 2.0 to 6.4 Hz — equivalently, narrowing the design separation between forcing and natural frequency — and reporting P(DAF exceeds limit) at each step shows how fast the cliff arrives.
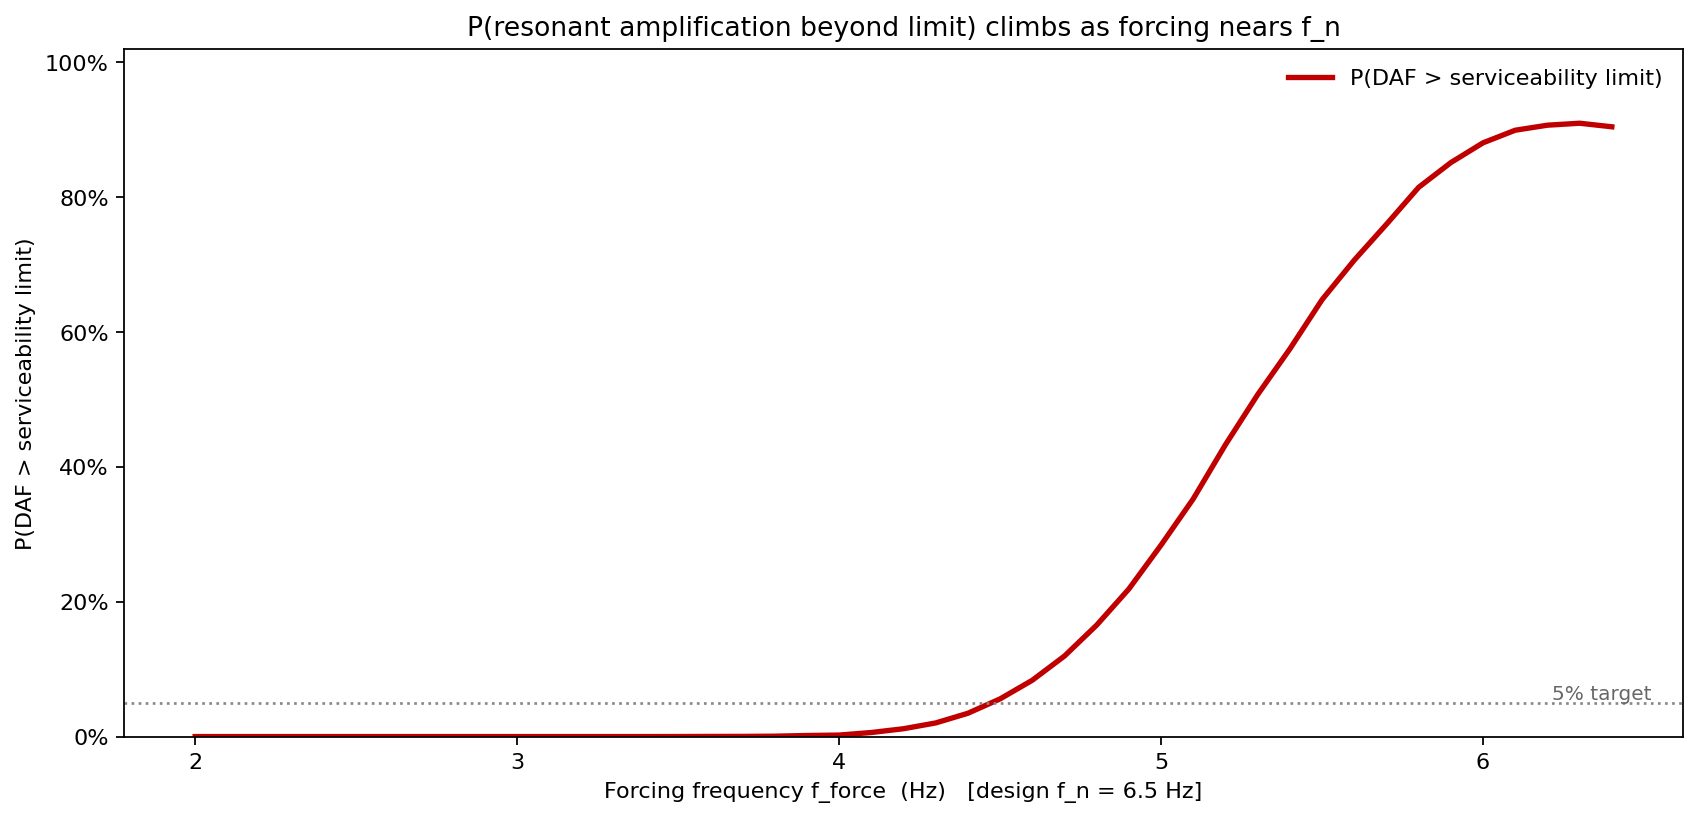
At a forcing frequency of 3.0 Hz (ratio 0.46) the exceedance probability is effectively 0%. At 4.0 Hz (ratio 0.62) it is 0.2%. At the actual 5.0 Hz (ratio 0.77) it is 28.4%. Push the machinery to 5.5 Hz (ratio 0.85) and it is 64.8%; at 6.0 Hz (ratio 0.92) it is 88.0%. The curve is almost flat then almost vertical — which is exactly why a deterministic separation that looks adequate (0.77 against a notional safe ratio) carries far more risk than the single DAF number suggests.
The risk lives where the as-built frequency drifts down
Plotting the joint density of as-built natural frequency against DAF locates the danger precisely.
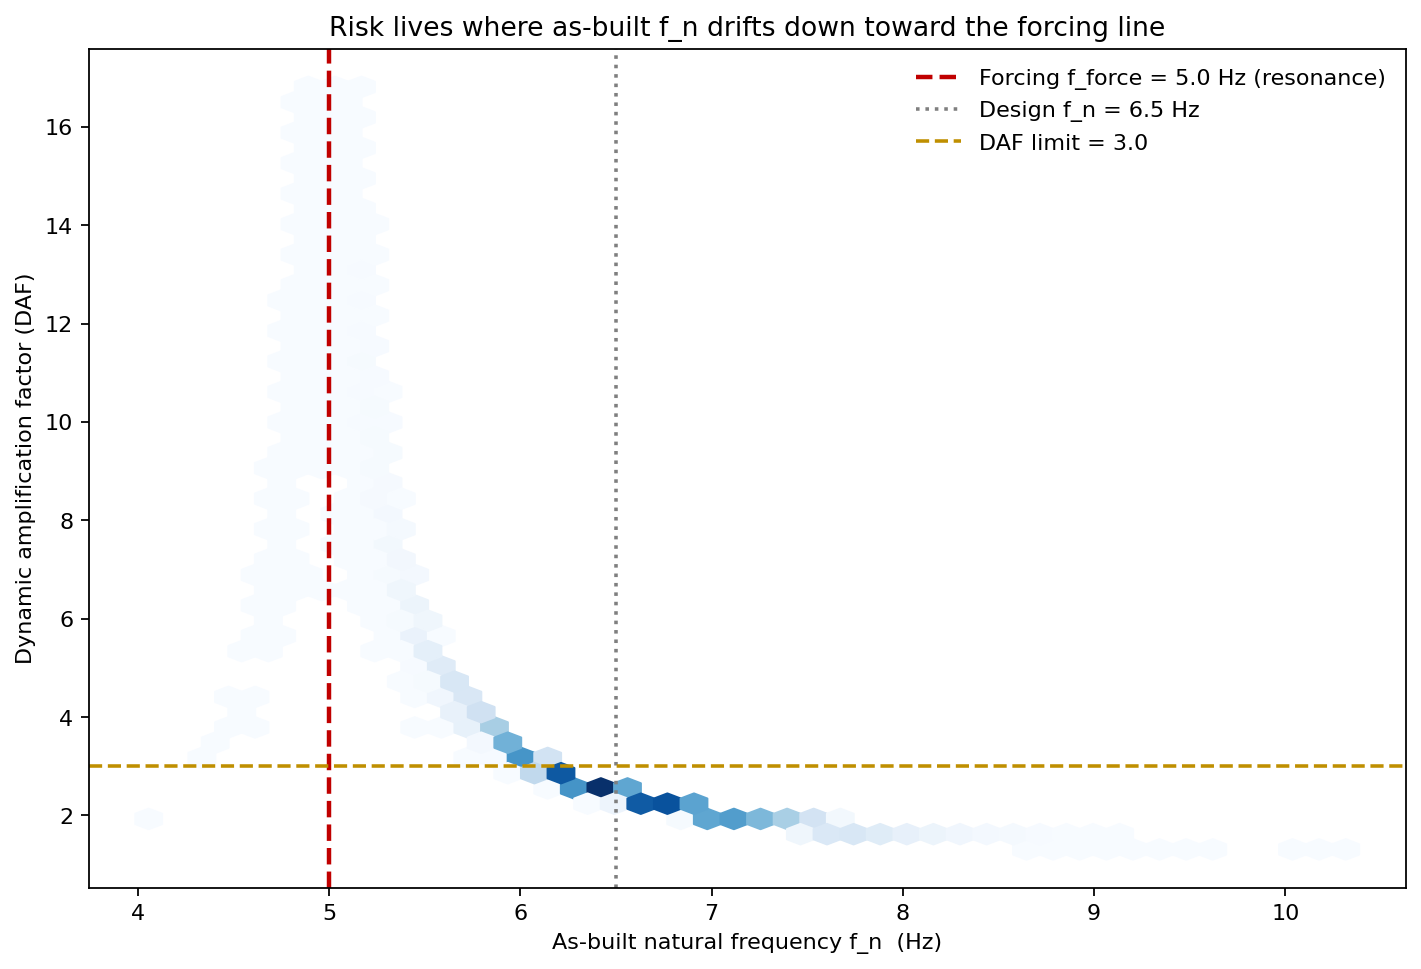
The mean as-built \(f_n\) lands on the design 6.5 Hz, but the dangerous trials are those where \(f_n\) drifts down toward the 5.0 Hz forcing line: P(\(f_n\) below 5.5 Hz) is 5.4%, and it is that lower tail of frequencies — not the bulk — that produces the high-DAF events. The cloud climbs steeply toward the forcing line, the visual signature of resonance.
Which inputs the resonance risk depends on
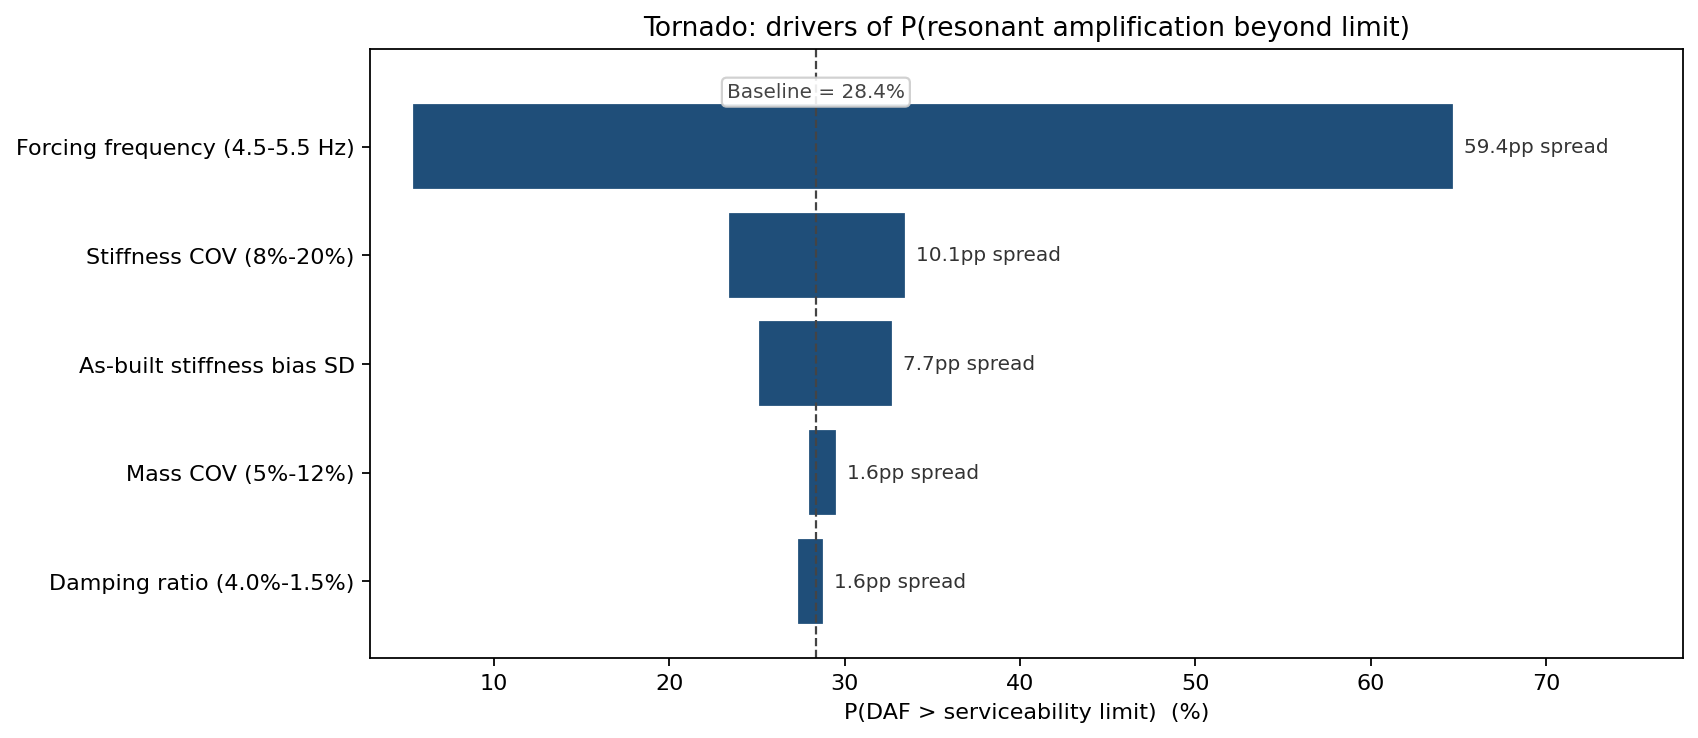
By a wide margin the dominant lever is the forcing frequency itself: moving it from 4.5 to 5.5 Hz swings P(exceed) from 5.3% to 64.7%, confirming that the single most effective mitigation is to separate the machinery speed from the floor frequency. Among the structural uncertainties, stiffness coefficient of variation (8% to 20%, moving P(exceed) from 23.4% to 33.5%) and the as-built stiffness bias dominate; damping and mass dispersion mattered comparatively little at this separation. This pointed the firm toward stiffening the floor to push \(f_n\) up and away from 5.0 Hz, rather than chasing damping treatments that only help once resonance is already close.
What the model changed
Rather than accept a deterministic DAF of 2.4, the firm stiffened the mezzanine to raise the target natural frequency and added isolation mounts under the machinery to lower the effective forcing transmitted to the deck — pushing the frequency ratio down the flat part of the sweep curve. Re-simulating with the higher \(f_n\) and the controlled stiffness bias brought P(DAF exceeds limit) from 28% to below 5%, and the resonant tail of dynamic deflection collapsed. The decisive insight was that the floor was never safe with margin to spare — it sat on the shoulder of the resonance cliff, and only the distribution revealed it.
ModelRisk Functionality Used
- Monte Carlo simulation of the dynamic amplification factor across 60,000 structures — capturing the non-linear, near-resonant tail that a DAF computed at the design natural frequency cannot show.
- Lognormal and Normal input distributions for stiffness, mass and damping, with stiffness and damping kept strictly positive.
- A shared per-structure stiffness-bias factor so as-built floors deviate coherently from the finite-element model, preventing the response averaging back to the design value.
- Forcing-frequency sweep mapping P(exceed limit) against the frequency ratio, exposing the near-vertical resonance cliff hidden behind a single "safe" ratio.
- Sensitivity analysis identifying forcing-frequency separation and stiffness control — not damping — as the dominant mitigations.
Structural dynamics stops being a single amplification number and becomes a resonance-probability problem the moment the model is allowed to vary the natural frequency the response depends on so steeply.