

Industry: Engineering
Product: ModelRisk
Application: Structural analysis under uncertainty
Every Member Passes at 85% Utilization. The Whole Load Path Still Overstresses 4.4% of the Time.
Run the deterministic code check on a long-span steel transfer truss and every primary member clears. The governing member — vertical V5 — sits at 85% utilization (demand/capacity = 0.85), a comfortable 15% reserve. On paper the structure is adequate with margin to spare.
But loads and capacities scatter, and the load path is a weakest-link system: the structure is overstressed if any one of its eight primary members exceeds utilization 1.0. Propagating the combined load cases (dead, live, wind, snow) and the member capacities through the frame with Monte Carlo turns the single 0.85 governing utilization into a distribution: mean 0.83, P95 0.99, P99 1.07. The probability that some member crosses 1.0 is 4.4%. A check that reads 85% on every member hides a one-in-23 chance the load path overstresses somewhere.
A structural consultancy adopted ModelRisk to score whole-structure load paths on a system overstress probability rather than a single governing utilization.
Why a point estimate fails for a load path
Two effects break the deterministic check, and both make the real answer worse than the nominal one.
First, a load path is a max over members, not a single member. Even if each member individually has only a small chance of exceeding 1.0, the chance that at least one of eight does is far larger. The deterministic check evaluates the one nominally-governing member; the system can overstress through any of them.
Second, the loads are correlated. One severe loading season raises live, wind, and snow demand on every member at once — so member demands move together, not independently. We modelled that with a single per-build environmental severity factor shared across all four load components, and a separate per-build fabrication factor scaling all member capacities together (one steel batch, one fabricator). With independent members the simulated overstress probability is 3.0%; with the shared load season and fabrication batch it is 4.4% — a 1.5x increase. Treating members as independent — the implicit assumption behind summing or checking them one at a time — understates the system risk.
The headline: the governing-utilization distribution
The clearest single picture is the distribution of governing utilization — the max demand/capacity across all members in each simulated structure.
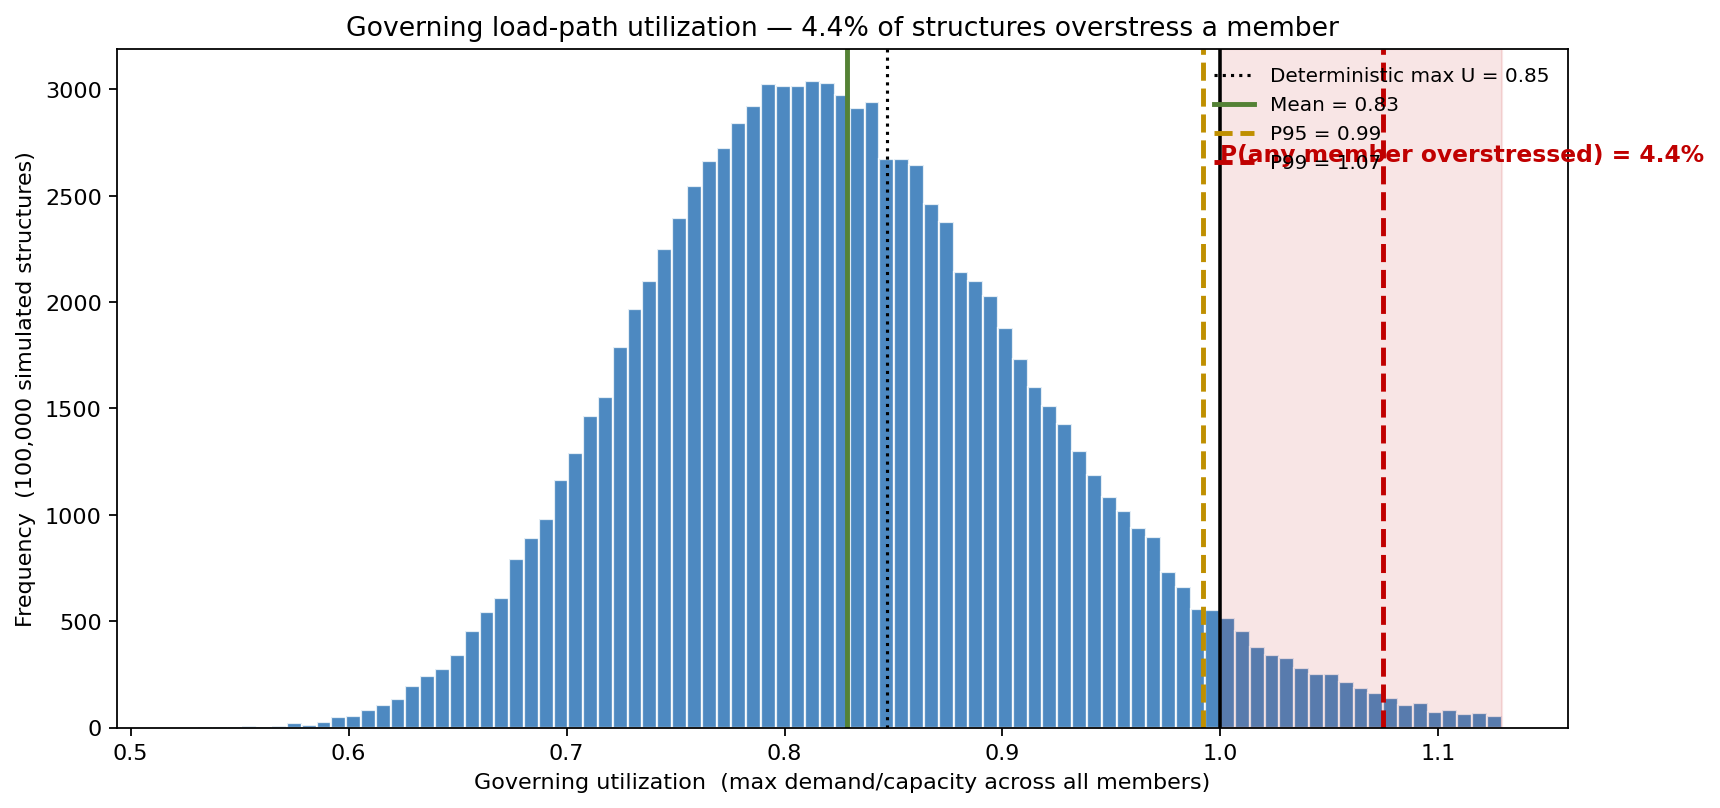
- Mean governing utilization 0.83, P50 0.82.
- P95 0.99 — the 95th-percentile structure is right at the overstress line.
- P99 1.07.
- Deterministic max utilization 0.85 (the dotted line) sits near the body of the distribution, with the overstress tail entirely beyond it.
- The shaded region beyond U = 1.0 carries 4.4% of all simulated structures — P(any member overstressed).
The deterministic 0.85 looks safe precisely because it ignores the right tail that the system overstresses in.
Correlation fattens the tail
Plotting the cumulative distribution of governing utilization for the correlated model against the naive independent model shows where the risk hides.
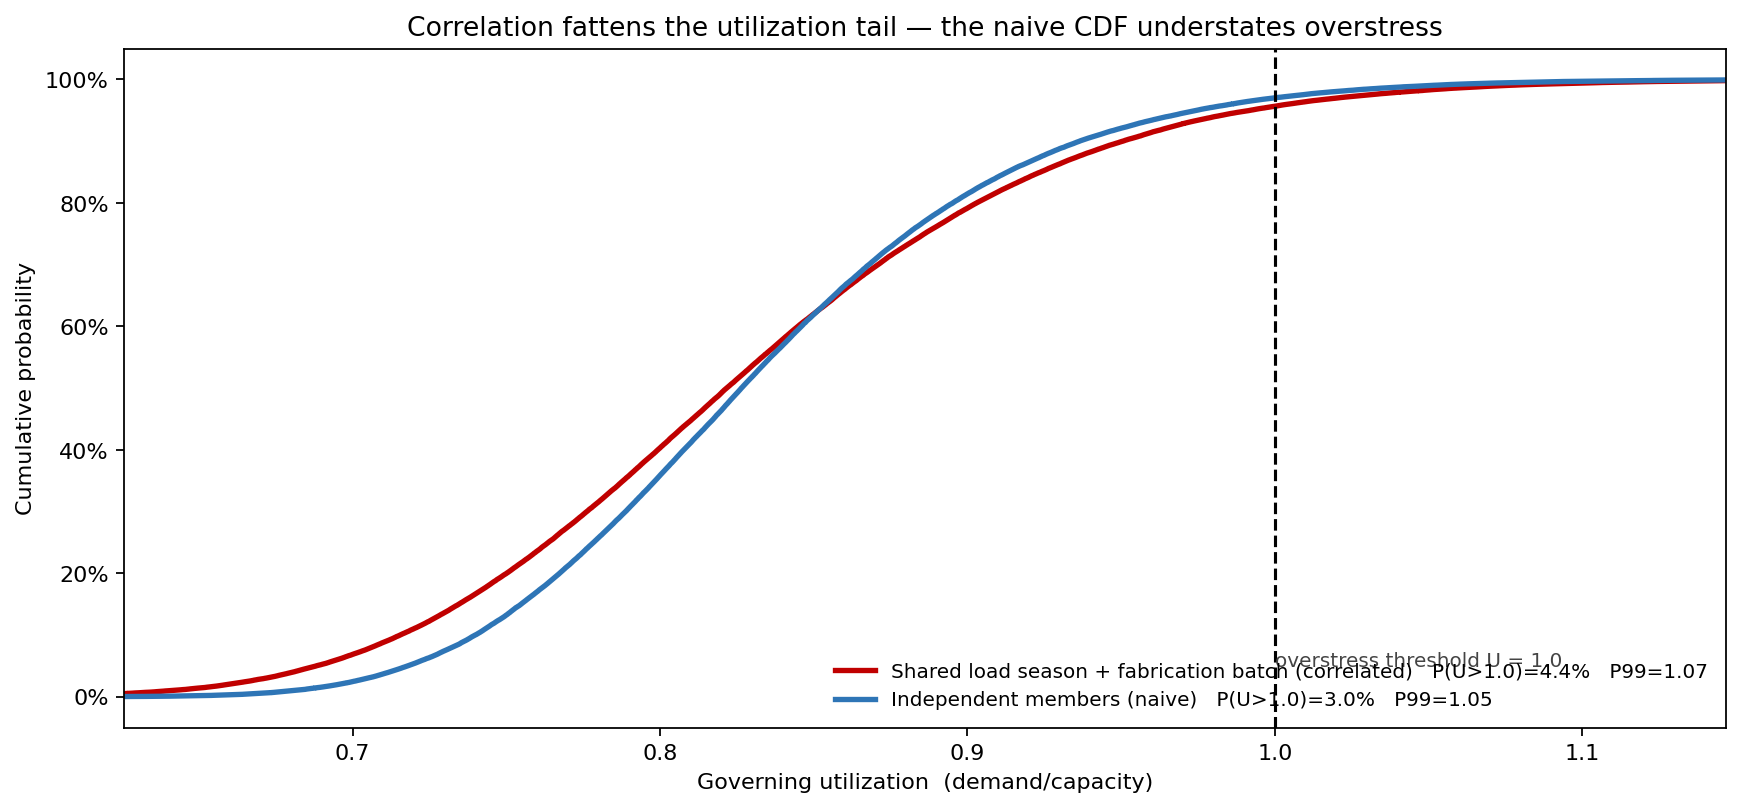
- Shared load season + fabrication batch (correlated): P(U > 1.0) = 4.4%, P99 = 1.07.
- Independent members (naive): P(U > 1.0) = 3.0%, P99 = 1.05.
The two curves track closely through the body and separate in the upper tail — exactly where overstress is decided. An analyst who checks members one at a time, implicitly assuming independence, reports the lower number.
Which member governs is itself uncertain
There is no single "critical member." Because the loads that govern wind-sensitive diagonals differ from those that govern gravity-sensitive verticals, the governing member changes across simulated structures.
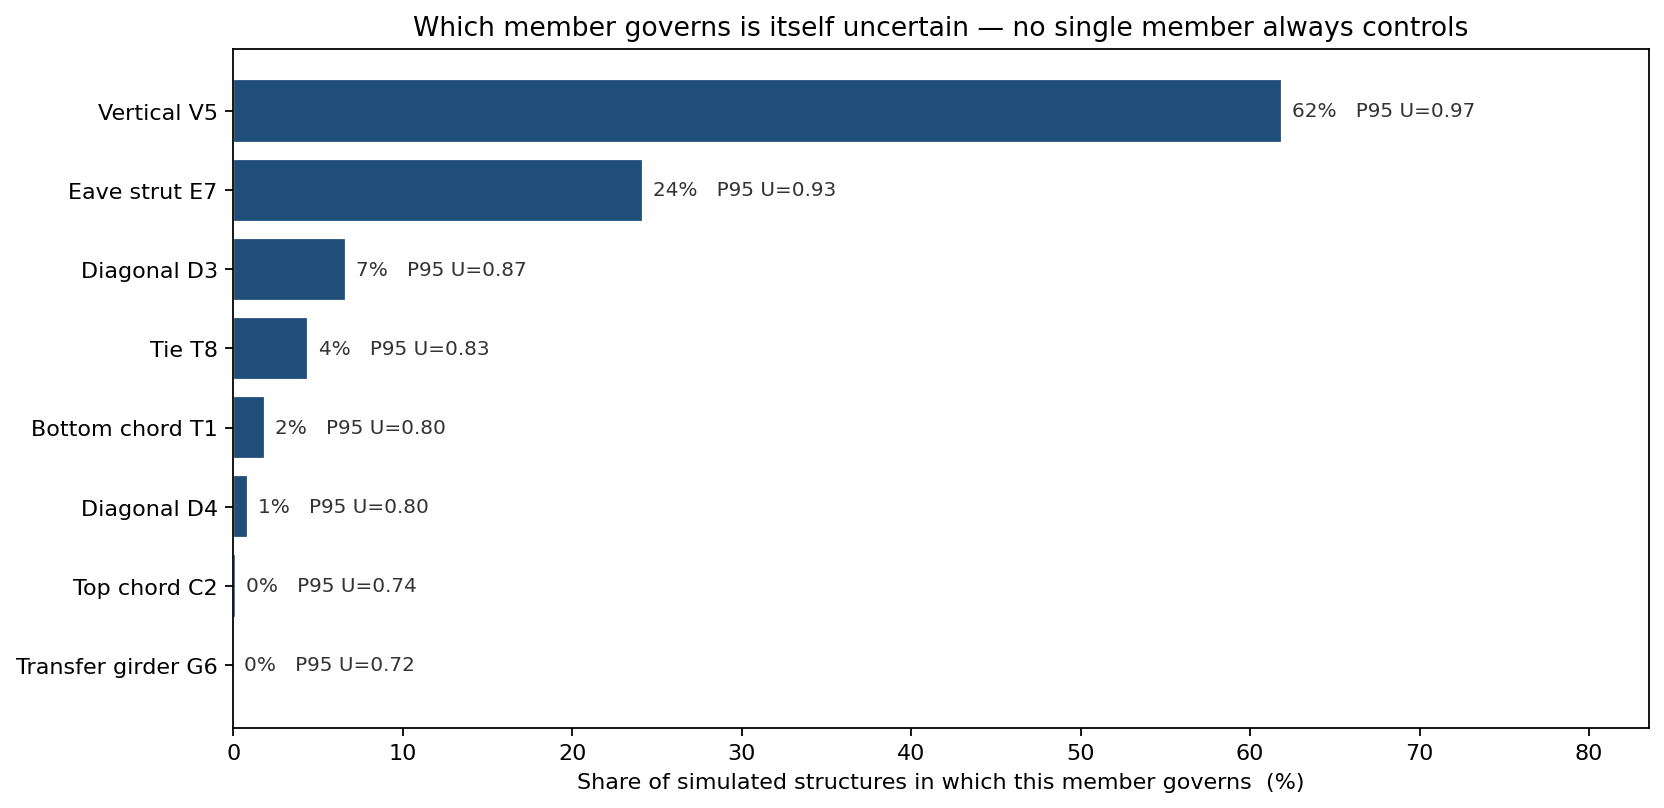
- Vertical V5 governs 61.9% of structures (P95 utilization 0.97).
- Eave strut E7 governs 24.2% (P95 0.93) — wind-driven, and the deterministic check never flagged it as critical.
- Diagonal D3 governs 6.6%, tie T8 4.4%, with the remaining members governing the balance.
This matters because a strengthening intervention aimed only at the nominal governing member (V5) leaves the eave strut E7 — which governs nearly a quarter of the overstress cases — untouched. The model tells the engineer to reinforce both load paths.
Which inputs the answer depends on
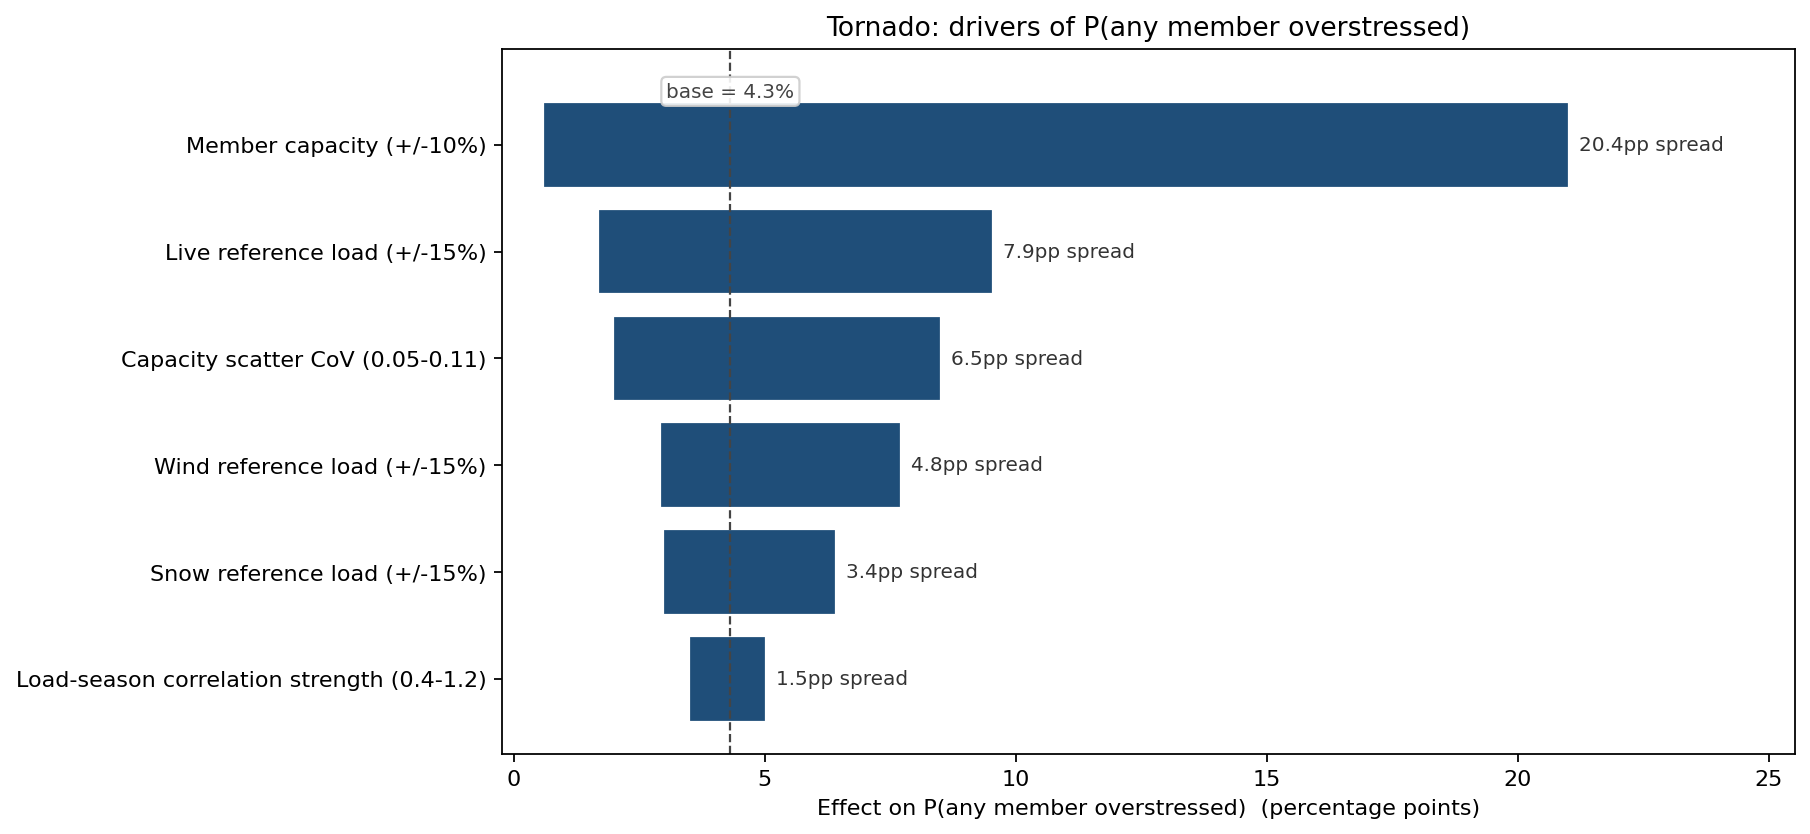
Swinging each input across its plausible range and recomputing P(any member overstressed) (base 4.3%) ranks the drivers:
- Member capacity (+/-10%): 0.58% to 21.0% — a 20.4-point swing, by far the dominant driver.
- Live reference load (+/-15%): 1.67% to 9.54% — 7.9 points.
- Capacity scatter CoV (0.05 to 0.11): 1.98% to 8.51% — 6.5 points.
- Wind reference load (+/-15%): 2.90% to 7.71% — 4.8 points.
- Snow reference load (+/-15%): 2.98% to 6.42% — 3.4 points.
- Load-season correlation strength: 3.48% to 5.02% — 1.5 points.
System overstress is most sensitive to the realised member capacity — both its mean and its scatter — which pointed the team at fabrication and material-certification controls rather than at re-running load cases.
What the model changed
The two governing load paths — vertical V5 and eave strut E7 — were upsized one section each, and the steel order was placed against a tighter capacity-certification specification to cut the fabrication scatter. Re-running the model dropped P(any member overstressed) below 1%, the consultancy's internal acceptance threshold, without a blanket upsize of all eight members. The deterministic governing utilization barely moved (0.85 to 0.80); the system probability moved by the order of magnitude that mattered.
ModelRisk Functionality Used
- Monte Carlo simulation of the full member-by-member load path, reporting the governing (max-over-members) utilization and P(any member overstressed) — the system metric a per-member check cannot produce.
- Gumbel, LogNormal and Normal load components (wind/snow extreme, live skewed, dead tight) mapped onto each member through influence coefficients, keeping every demand physically positive.
- A shared environmental severity factor correlating live/wind/snow across all members, and a shared fabrication batch factor correlating capacities — raising P(overstress) 1.5x over a naive independent model.
- Governing-member tracking showing utilization is decided by V5 (62%) or E7 (24%) depending on the structure, so no single member can be treated as "the" critical one.
- Sensitivity ranking identifying realised member capacity as the dominant driver, redirecting effort to fabrication certification rather than load-case refinement.
A load path passes or fails as a system. ModelRisk scores the system; the member-by-member check only scores the parts.