

Industry: Engineering
Product: ModelRisk
Application: Deriving Statistical Design Allowables from Coupon Test Data
The Sample Mean Was 509 MPa. The B-Basis Allowable an Engineer Could Actually Design To Was 464 MPa
A structures team qualifying a 7075-T6 aluminium forging pulled 30 tension coupons and got a tidy answer: mean yield strength 509 MPa, standard deviation 25 MPa. The temptation was to design to something close to that mean, or at most to mean-minus-one-sigma — 484 MPa. The aerospace code says otherwise. The number you are allowed to design to is the B-basis allowable: the strength that 90% of the population exceeds, stated with 95% confidence. For this coupon set that value is 464 MPa — 45 MPa, nearly 9%, below the mean. Skip the statistics and you have overstated the usable strength of the material by the width of an entire safety margin.
That gap, and what drives it, is the whole story. The team built the allowable-derivation as a Monte Carlo model in ModelRisk so they could see the coupon scatter, the sampling penalty, and the fielded-fleet consequence as distributions rather than as a single rounded-down number.
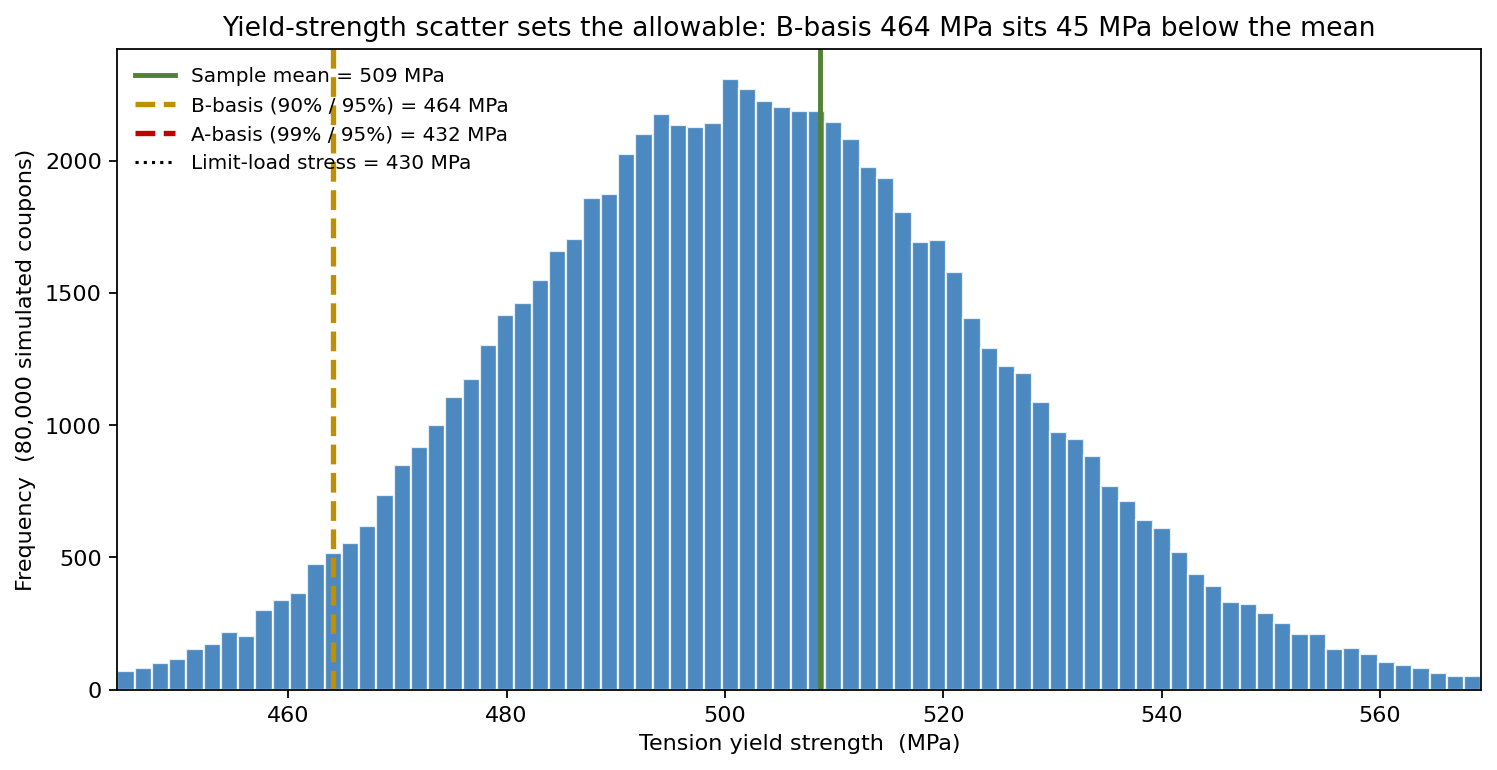
The population of coupon strengths is right-skewed and non-negative, so it is modelled as LogNormal with a 503 MPa mean and a 4.5% coefficient of variation. Against that scatter the two code allowables fall well below the mean: B-basis (90% exceedance, 95% confidence) = 464 MPa and A-basis (99% exceedance, 95% confidence) = 432 MPa. The limit-load stress the part actually sees is 430 MPa — which means the A-basis allowable clears the design stress by a hair, while the mean strength clears it by 18%. Designing to the mean would have told a comfortable story the material cannot support.
Why a point estimate fails here
A deterministic allowable is a single number with no statement of how confident you are in it, and no statement of how much of the population it actually protects. The coupon mean (509 MPa) is exceeded by only about 39% of the population — it is, by construction, a value that most parts fall below. Even mean-minus-one-sigma (484 MPa) leaves roughly 16% of the population beneath it. The point estimate cannot answer the question the code actually asks: what strength does 90% (or 99%) of the population beat, and how sure am I given that I only tested 30 coupons?
The B-basis and A-basis tolerance bounds answer exactly that. They are computed as sample_mean − k·sample_sd, where the one-sided tolerance factor k comes from the noncentral-t distribution and grows as the sample shrinks. For n = 30 the factors are kB = 1.78 and kA = 3.06 — the A-basis sits more than three sample standard deviations below the mean precisely because 30 coupons is not many.
The coupon count is buying strength you can use
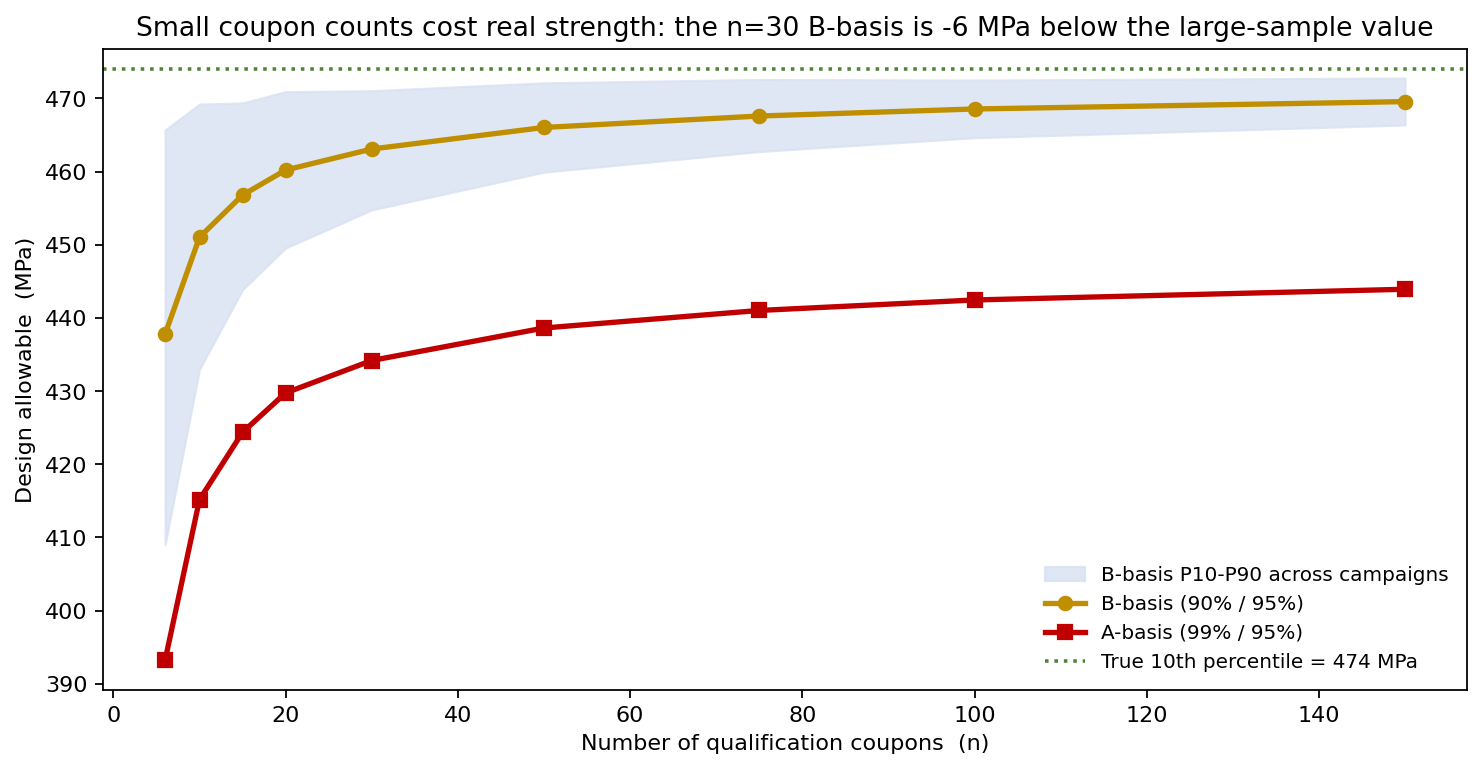
The sampling penalty is not a rounding detail — it is worth real megapascals. Simulating thousands of qualification campaigns at each sample size shows how the computed B-basis climbs toward the true 10th percentile of 474 MPa as more coupons are pulled:
| Coupons (n) | B-basis (mean) | A-basis (mean) |
|---|---|---|
| 6 | 438 MPa | 393 MPa |
| 10 | 451 MPa | 415 MPa |
| 15 | 457 MPa | 424 MPa |
| 30 | 463 MPa | 434 MPa |
| 50 | 466 MPa | 439 MPa |
| 100 | 469 MPa | 442 MPa |
| 150 | 470 MPa | 444 MPa |
Going from 30 to 150 coupons recovers about 7 MPa of B-basis allowable — and the spread across campaigns at n = 30 (P10 to P90 of roughly 455 to 471 MPa) collapses to almost nothing by n = 100. For a high-volume part, the extra coupons can pay for themselves in reduced section thickness many times over. For a one-off, they may not. The simulation lets that be an explicit trade rather than a habit.
What the published allowable misses: lot-to-lot drift
The B-basis is derived from a single qualification lot, but a fielded fleet draws parts from many production lots whose mean strength wanders with heat treatment and forging batch. Modelling that as a shared per-lot mean factor (a 2.5% CV on the lot mean) on top of the within-lot scatter answers the question the qualification lot cannot:
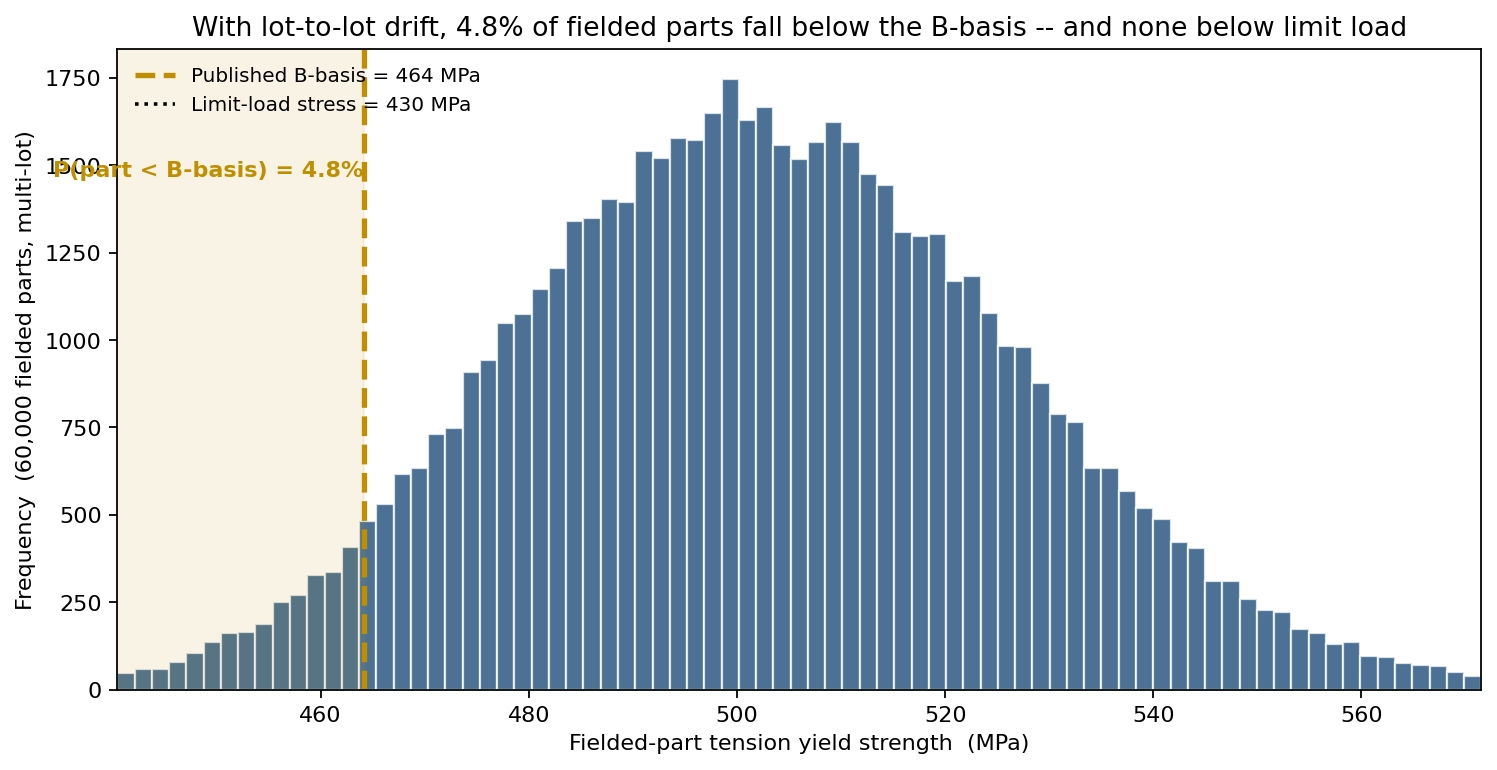
Across 60,000 fielded parts drawn from drifting lots, 4.8% fall below the published B-basis of 464 MPa — close to, but not the same as, the single-lot 10% design intent, because the fleet mix differs from the one lot that was tested. Critically, the probability a fielded part falls below the 430 MPa limit-load stress is 0.065% — about 1 in 1,500. That is the number the certification authority cares about, and it is invisible to anyone reading only the coupon mean.
What actually moves the allowable
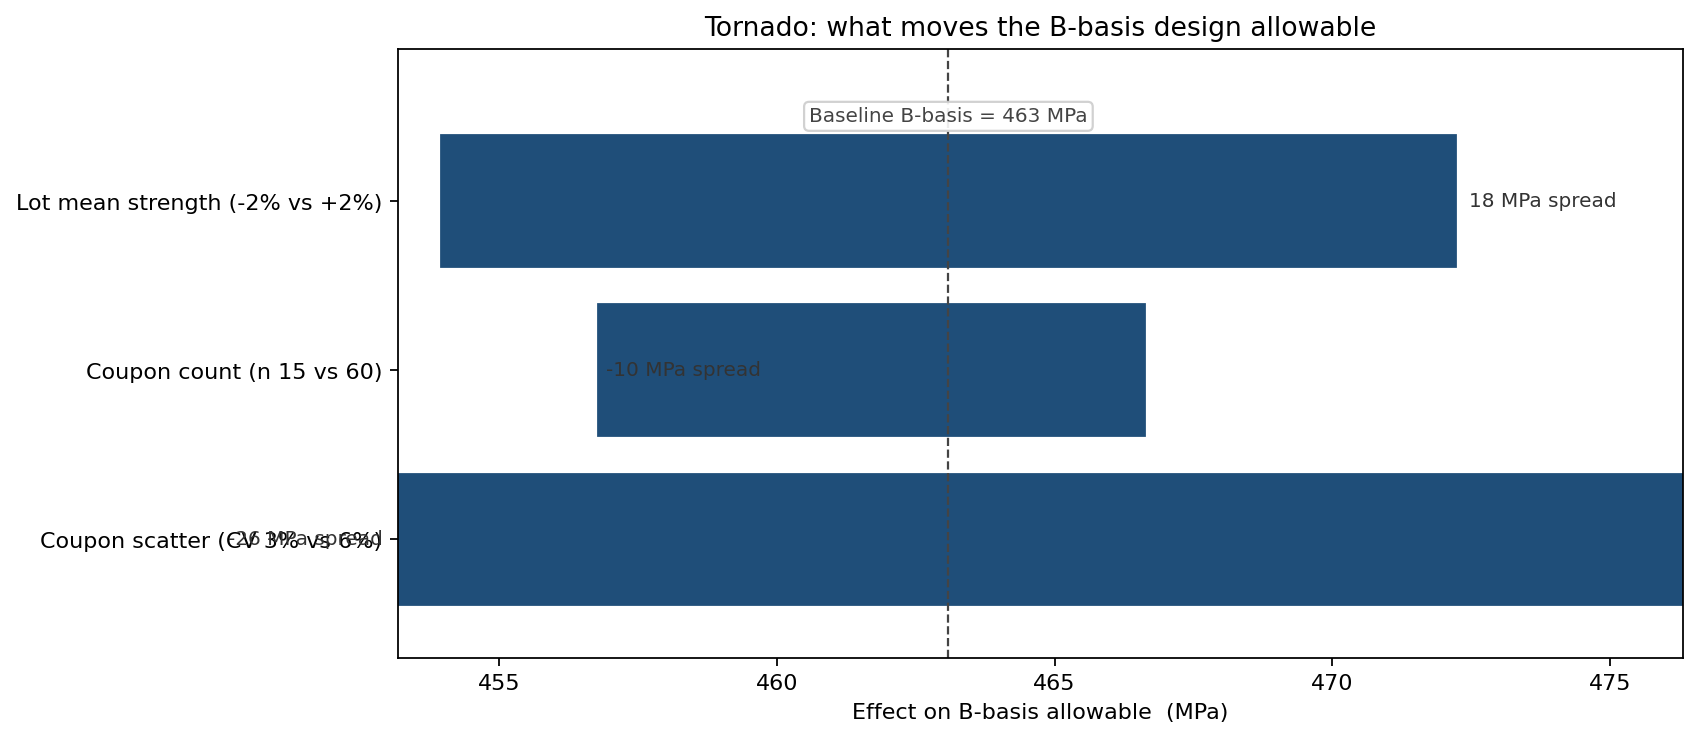
Ranking the drivers of the B-basis one at a time, with the baseline at 463 MPa:
- Coupon scatter is the dominant lever: dropping the CV from 4.5% to 3% lifts the allowable +13 MPa; letting it rise to 6% costs −13 MPa (a 27 MPa spread). Tighter process control directly buys allowable strength.
- Lot mean strength (±2%) moves the allowable ±9 MPa — the case for specifying a minimum heat-treat response.
- Coupon count (15 vs 60) is worth about 10 MPa — real, but secondary to controlling the scatter in the first place.
What the model changed
- Allowables published as B-basis 464 MPa / A-basis 432 MPa, with the derivation traceable to the coupon set rather than to a hand-applied knock-down factor.
- Coupon plan set at n = 30, chosen from the sweep as the knee where additional coupons stop returning meaningful allowable — formerly a default of 10.
- A 2.5%-CV lot-mean control limit written into the material spec, after the fleet model showed lot drift was the difference between a 0.06% and a much higher under-strength rate at limit load.
- Section thickness on three members reduced once the team could show the limit-load exceedance probability stayed below 1-in-1,000 against the B-basis rather than the over-conservative mean-minus-one-sigma they had used before.
ModelRisk Functionality Used
- LogNormal coupon model with mean 503 MPa and 4.5% CV, producing the strength distribution against which the 464 MPa B-basis and 432 MPa A-basis are read off — not assumed.
- Noncentral-t tolerance factors (kB = 1.78, kA = 3.06 at n = 30) computed inside the workbook so the allowable updates automatically as new coupons are added.
- Sample-size simulation running thousands of qualification campaigns per coupon count, quantifying the ~7 MPa recovered between n = 30 and n = 150 and the campaign-to-campaign spread at each n.
- Multi-lot fleet model with a shared per-lot mean factor (2.5% CV), surfacing the 4.8% sub-B-basis and 0.065% sub-limit-load fielded-part probabilities the single-lot derivation cannot produce.
- Tornado ranking isolating coupon scatter (±13 MPa) as the controlling driver of the allowable, ahead of lot mean and coupon count.
The mean strength is the number the test report hands you; the B-basis is the number the structure is allowed to see. Monte Carlo is what turns a coupon scatter plot into a defensible allowable — and what tells you whether the next ten coupons are worth pulling.