

Industry: Engineering
Product: ModelRisk
Application: Load Distribution Analysis in Structural Engineering
The Connection Was Designed at 71% Utilisation. The Worst Bolt Runs at 86%, and One Bolt in Eleven Goes Over Allowable.
An eight-bolt slip-critical connection carrying 800 kN is designed by hand the way every textbook teaches: divide the load by the number of bolts. Each bolt nominally carries 100 kN against a 140 kN allowable — a comfortable 71% utilisation. But bolts in a group never share equally. Clamp-force scatter, hole tolerance, thread engagement and fit-up mean stiffness varies bolt-to-bolt, and the load follows stiffness: the share of total carried by member i is its stiffness divided by the sum of all stiffnesses. When that uneven sharing is simulated across 60,000 nominally-identical installations, the most-loaded bolt averages 120 kN — 20% above the even-share figure — and a P95 of 145 kN, which is already over the 140 kN allowable. The probability that some bolt in the group exceeds allowable is 9.2%: roughly one connection in eleven.
That gap is invisible to the design calculation, because the design calculation never models the worst member — it models the average member. This case study covers the same parallel-load-path problem an engineering consultancy hit on a bolt group, but it applies identically to a pile cap, a cable bundle, or any set of nominally-equal members sharing one load.
Why the even-share point estimate fails
The equal-share assumption is exact only if every member has identical stiffness. The governing rule is
\[ F_i = \frac{K_i}{\sum_{j=1}^{n} K_j} \times F_{total} \]
and the moment the \(K_i\) scatter, two things happen that a single division cannot capture. First, the distribution of shares spreads around the nominal — some members pick up more, some less. Second, and more dangerously, the design only cares about the maximum of those shares, and the maximum of a set of scattered values sits well above their mean. With eight members at a modest 12% stiffness coefficient of variation plus fit-up variation, the worst member's expected share is 15.1% of the total against an even-share 12.5% — and its tail reaches far higher.
A deterministic check at 100 kN per bolt declares the connection safe with 40 kN of margin. The simulation shows that margin is consumed, on average, by uneven sharing alone, before any overload of the group as a whole.
The most-loaded member runs 20% hot
The headline result is the distribution of load on the worst bolt in the group across all simulated installations.
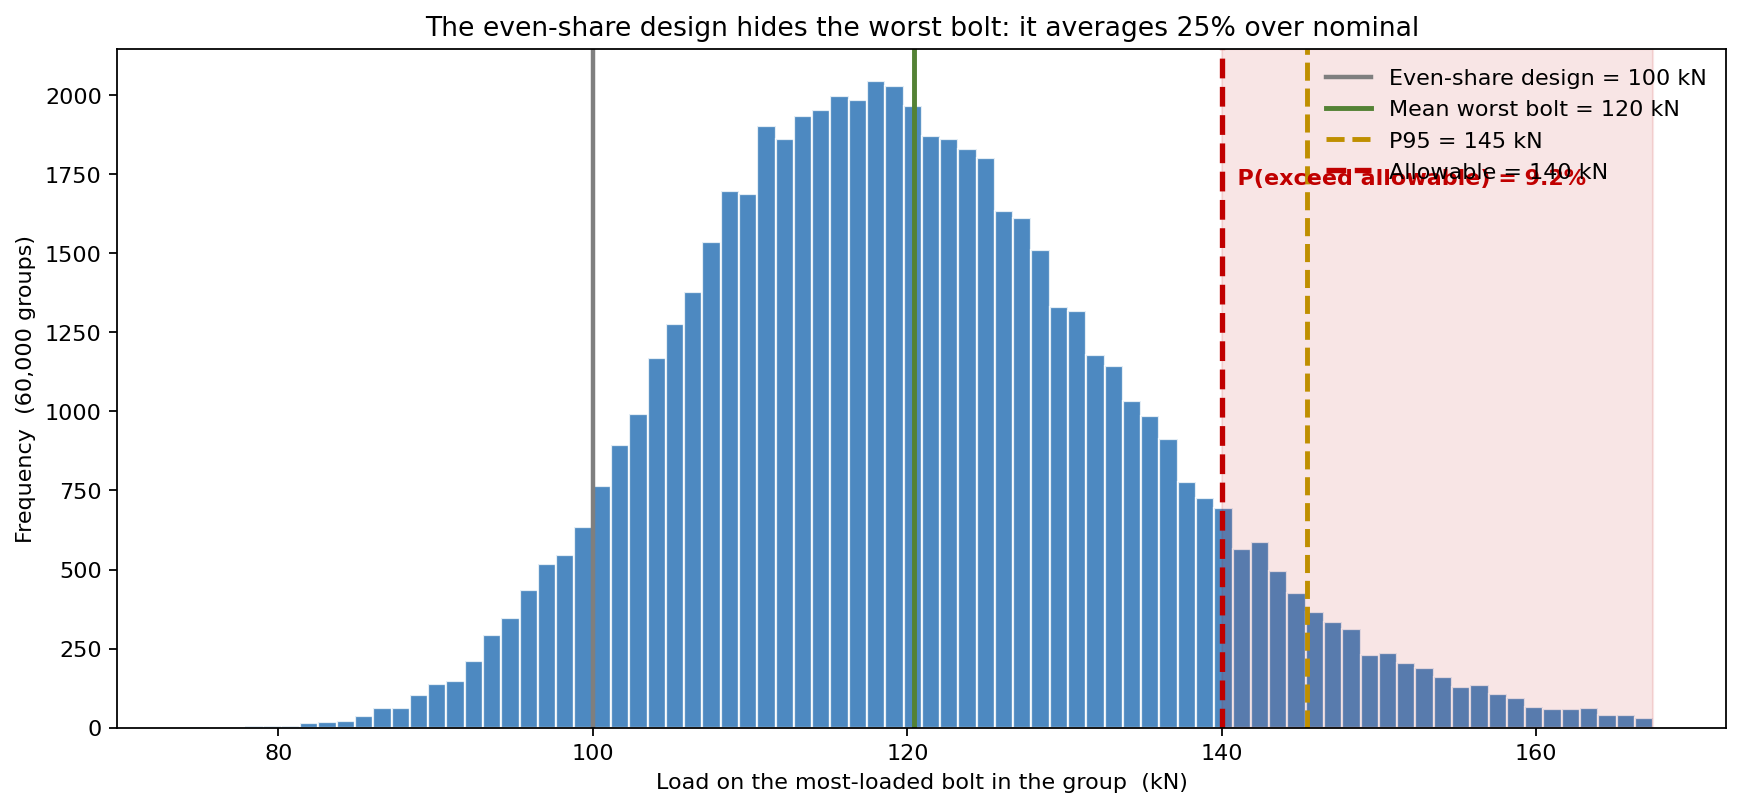
- Even-share design 100 kN (utilisation 0.71).
- Mean worst bolt 120 kN — 20% above the design figure.
- P95 145 kN — already past the 140 kN allowable.
- P99 159 kN.
- P(any bolt exceeds the 140 kN allowable) 9.2%.
The mean worst-bolt utilisation is 0.86 against a design 0.71, and the P99 utilisation is 1.13 — 13% over capacity. The connection is not failing on average, but it has nothing like the margin the deterministic calculation advertised.
Each input was modelled to its physical source
- Member stiffness \(K_i\) — Lognormal about its nominal, 12% coefficient of variation, capturing clamp-force, thread and hole-tolerance scatter. Lognormal keeps stiffness strictly positive.
- Fit-up / engagement — a Beta-distributed engagement fraction per bolt: most bolts engage near-fully, a tail engage late (a long hole, a burr, a slightly oversized clearance), scaling effective stiffness down.
- Per-group fit-up regime — a shared common factor across all bolts in one connection, representing a good-versus-sloppy shop or crew. This is what stops the worst-member share washing out: members in the same group are correlated, not independent, so a sloppy group is uneven across the board rather than averaging back to nominal.
- Total group load — Lognormal, 10% coefficient of variation, shared by every bolt in the group.
Adding members makes the extreme worse, not better
Intuition says more parallel paths means more redundancy and lower risk. For the average member that is true — but the design is governed by the worst member, and the more members there are, the more chances exist for one of them to be the unlucky one. Holding the even-share utilisation fixed at the design 0.71, the sweep below tracks P(any member exceeds allowable) against member count for two tolerance regimes.
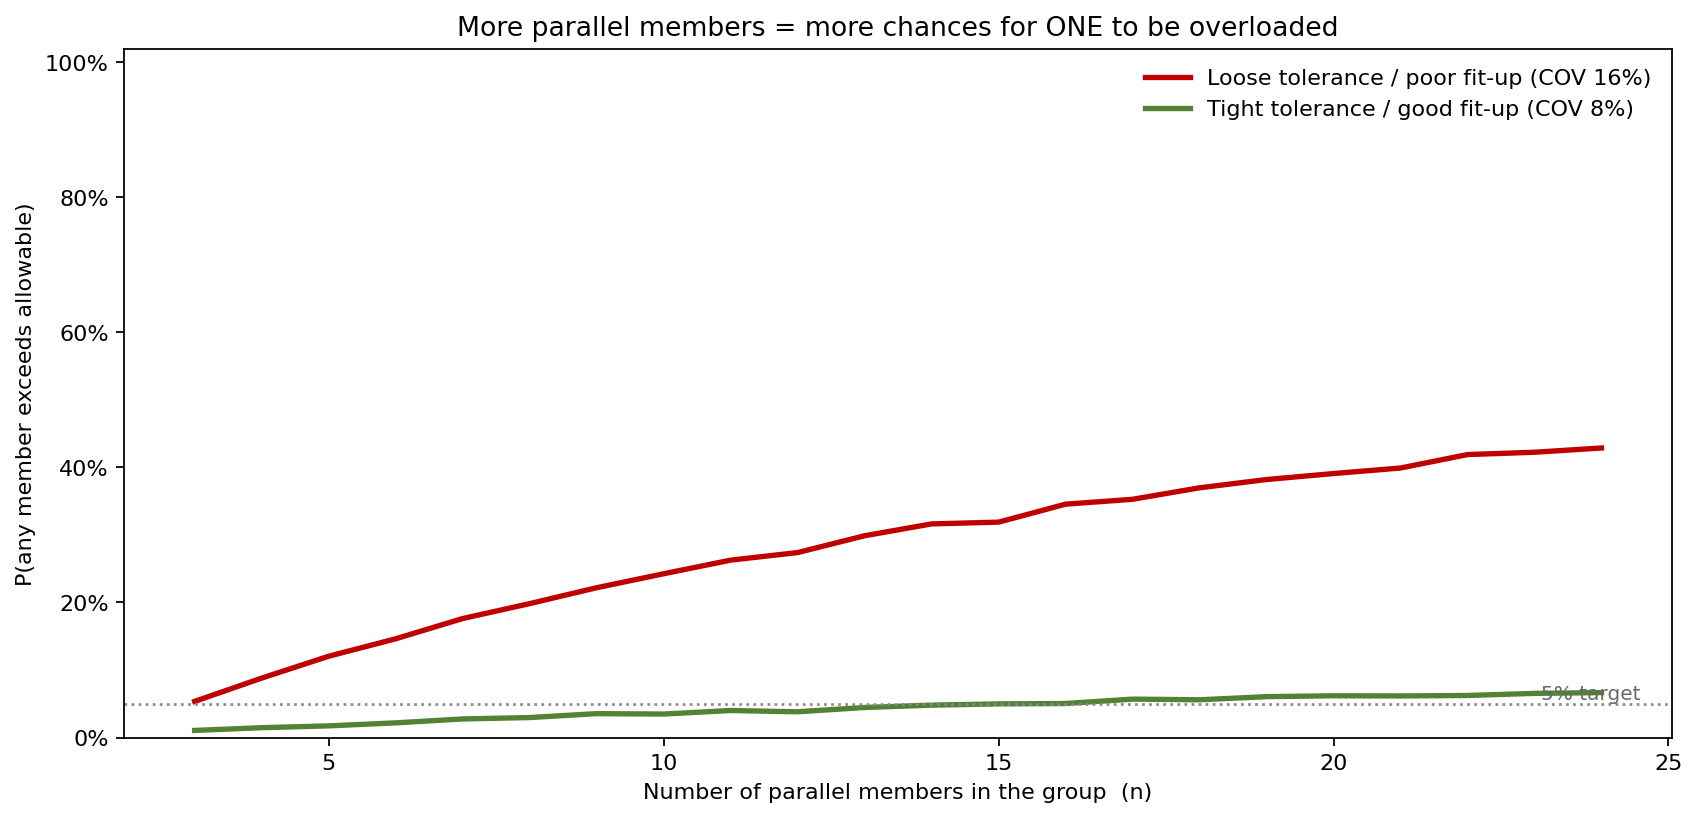
With tight tolerance (8% stiffness coefficient of variation, good fit-up) the exceedance probability climbs gently — 1.5% at four members, 3.0% at eight, 5.0% at sixteen, 6.7% at twenty-four. With loose tolerance (16% coefficient of variation, poor fit-up) it explodes: 8.8% at four members, 19.8% at eight, 34.6% at sixteen, and 42.9% at twenty-four. The lesson is that a larger group is not safer member-for-member unless tolerance is controlled — adding bolts to a sloppy group adds opportunities for one of them to be overloaded.
The sharing is uneven by rank, not random
Sorting each group's members from most- to least-loaded and plotting the distribution of each rank's share exposes the structure the design ignores.
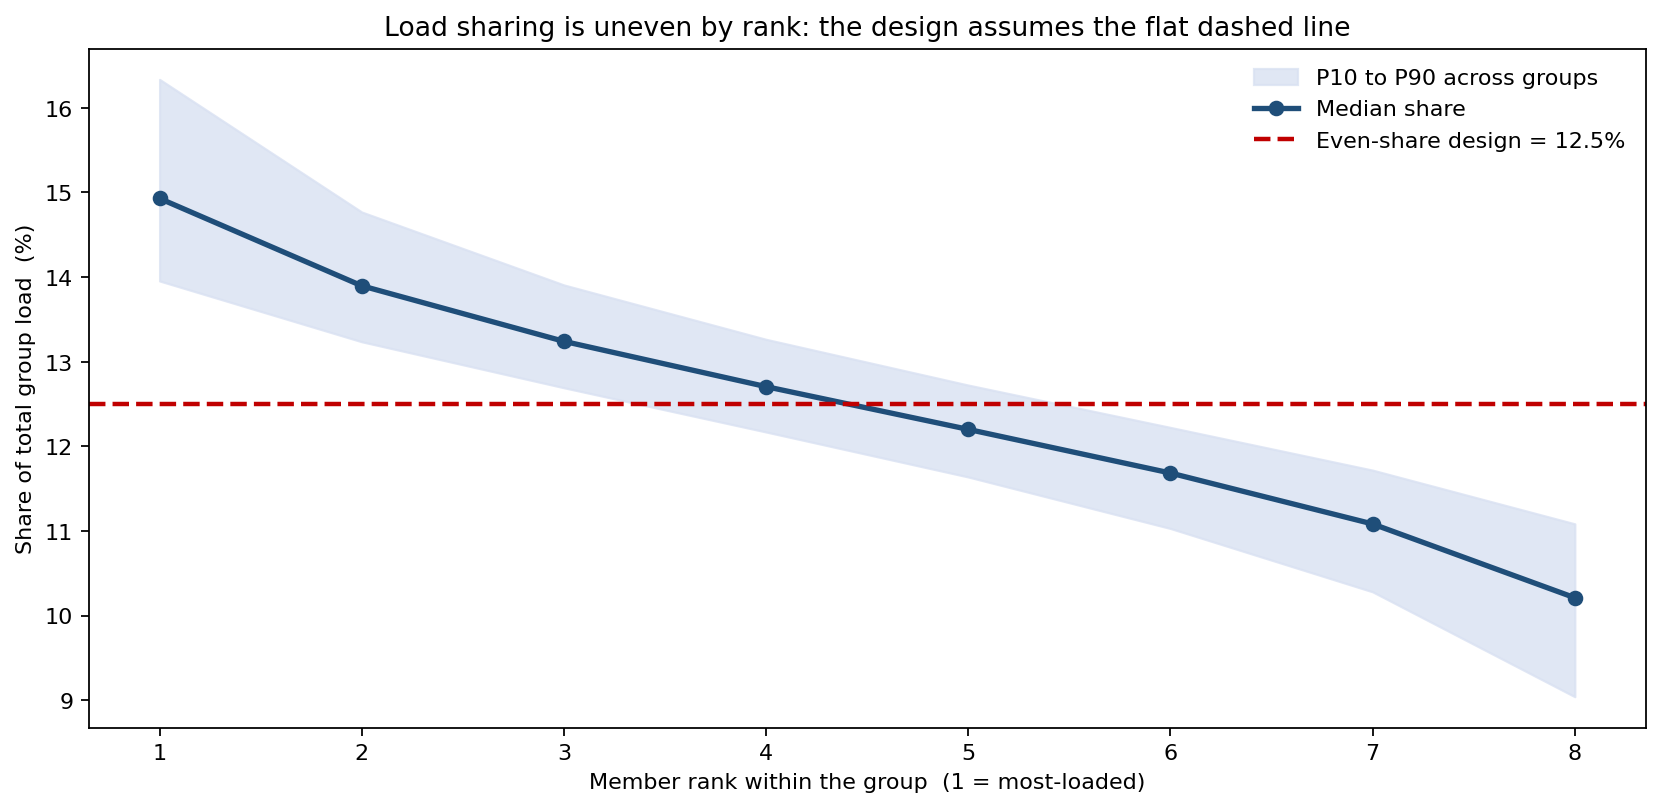
The even-share design is the flat line at 12.5%. The reality is a staircase: the rank-1 (most-loaded) member carries a median 14.9% and a P90 of 16.3%, while the rank-8 (least-loaded) member carries a median 10.2% and as little as 9.0% at P10. The top member systematically carries about 19% more than nominal and the bottom member about 18% less — every group, not occasionally.
Which inputs the overload risk depends on
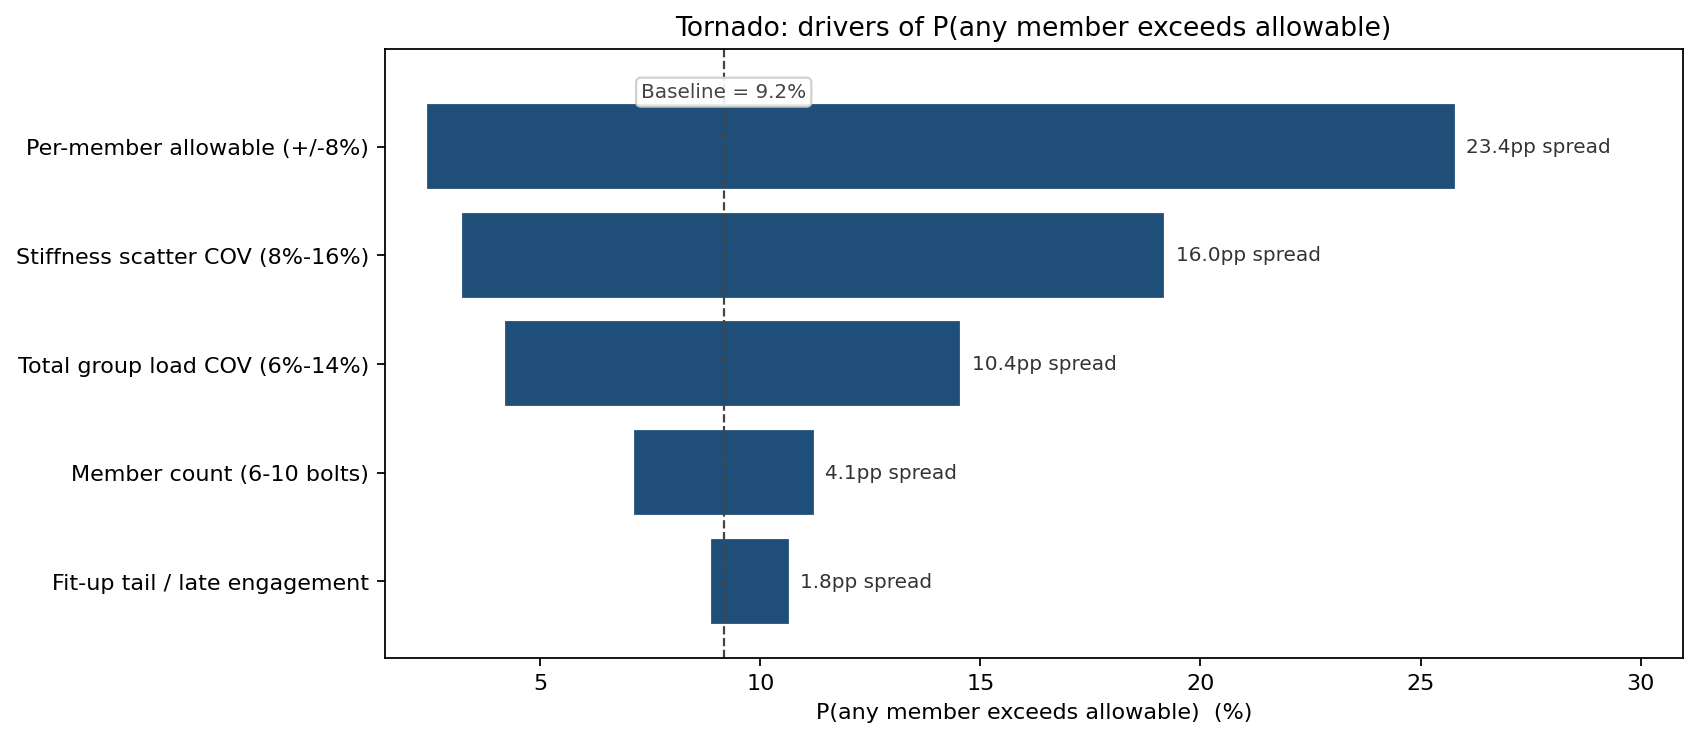
The dominant lever on P(exceed allowable) is the per-member allowable itself: an ±8% swing moves the exceedance probability from 2.4% to 25.8% — the resistance side of the inequality is where the action is, which argues for verified, not nominal, slip resistance. Second is stiffness scatter: tightening the coefficient of variation from 16% to 8% drops exceedance from 19.2% to 3.2%. Third is total group load dispersion. The much-debated fit-up tail and member count mattered far less than either tolerance control or a confirmed allowable.
This redirected the consultancy's effort from adding bolts (which barely helped) toward controlling installation tolerance and confirming the connection's actual slip resistance by test.
What the model changed
The connection was re-detailed with a tightened bolt-tensioning and hole-tolerance specification (cutting stiffness coefficient of variation toward the 8% regime) rather than by adding a ninth and tenth bolt — which the sweep showed would have raised the worst-member exceedance probability while adding cost. With tolerance controlled and the slip resistance confirmed by a small test programme rather than taken at nominal, the simulated P(any bolt over allowable) fell from 9.2% below 2%, recovering the margin the original hand calculation had only assumed.
ModelRisk Functionality Used
- Monte Carlo simulation of the stiffness-proportional load-sharing rule across 60,000 nominally-identical groups — replacing the single even-share division that models the average member, never the worst.
- Lognormal and Beta input distributions for member stiffness and fit-up engagement, keeping stiffness positive and capturing the late-engagement tail.
- A shared per-group common factor so members in the same connection are correlated, preventing the worst-member share from averaging back to nominal.
- Parameter sweep of member count under two tolerance regimes, showing that more parallel paths raise — not lower — the worst-member exceedance probability when tolerance is loose.
- Sensitivity analysis identifying the verified allowable and stiffness scatter, not member count, as the dominant drivers of overload risk.
Load distribution stops being a division and becomes a tail-management problem the moment the model is allowed to see the worst member instead of the average one.