

Industry: Engineering
Product: ModelRisk
Application: Heat Transfer Analysis Under Uncertainty
A 109 degC Nominal That Runs 125 degC Hot: Sizing Junction-Temperature Risk in a Thermal-Resistance Network
The datasheet calculation was reassuring. A power semiconductor dissipating 42 W on its heatsink, run through the steady-state thermal-resistance network, landed at a junction temperature of 109.7 degC against a 125 degC rated limit — a comfortable 15 degC margin. The board shipped. Then field returns started arriving from units run in warm, poorly ventilated enclosures, and the thermal team rebuilt the same calculation in ModelRisk with every resistance and the airflow treated as a distribution rather than a single number. The answer was not a 15 degC margin. It was a 17.9% chance the junction exceeds its rated limit.
Why the single-number calculation could not see it
The junction temperature comes from a simple series network:
Tj = Tambient + P x (Rjc + Rint + Rsa)
where Rjc is the junction-to-case resistance, Rint the thermal-interface (paste) resistance, and Rsa the sink-to-air resistance set by the convection coefficient h and the sink area A as Rsa = 1 / (h x A). Plug in the nominal value of every term and you get one number. But the convection coefficient on a real heatsink is not a constant — it depends on enclosure airflow, mounting orientation, fan tolerance and dust, and it is strongly right-skewed: most units cool well, a tail of units cool badly. The interface resistance carries a per-assembly-lot bias, because paste thickness and clamp pressure drift together across a build. Ambient intake air is itself a range, not a setpoint.
Each of those is modest on its own. Multiplied by 42 W and summed in series, they stack into a junction-temperature distribution whose mean (113.3 degC) already sits 3.6 degC above the deterministic nominal, and whose upper tail runs straight through the rated limit.
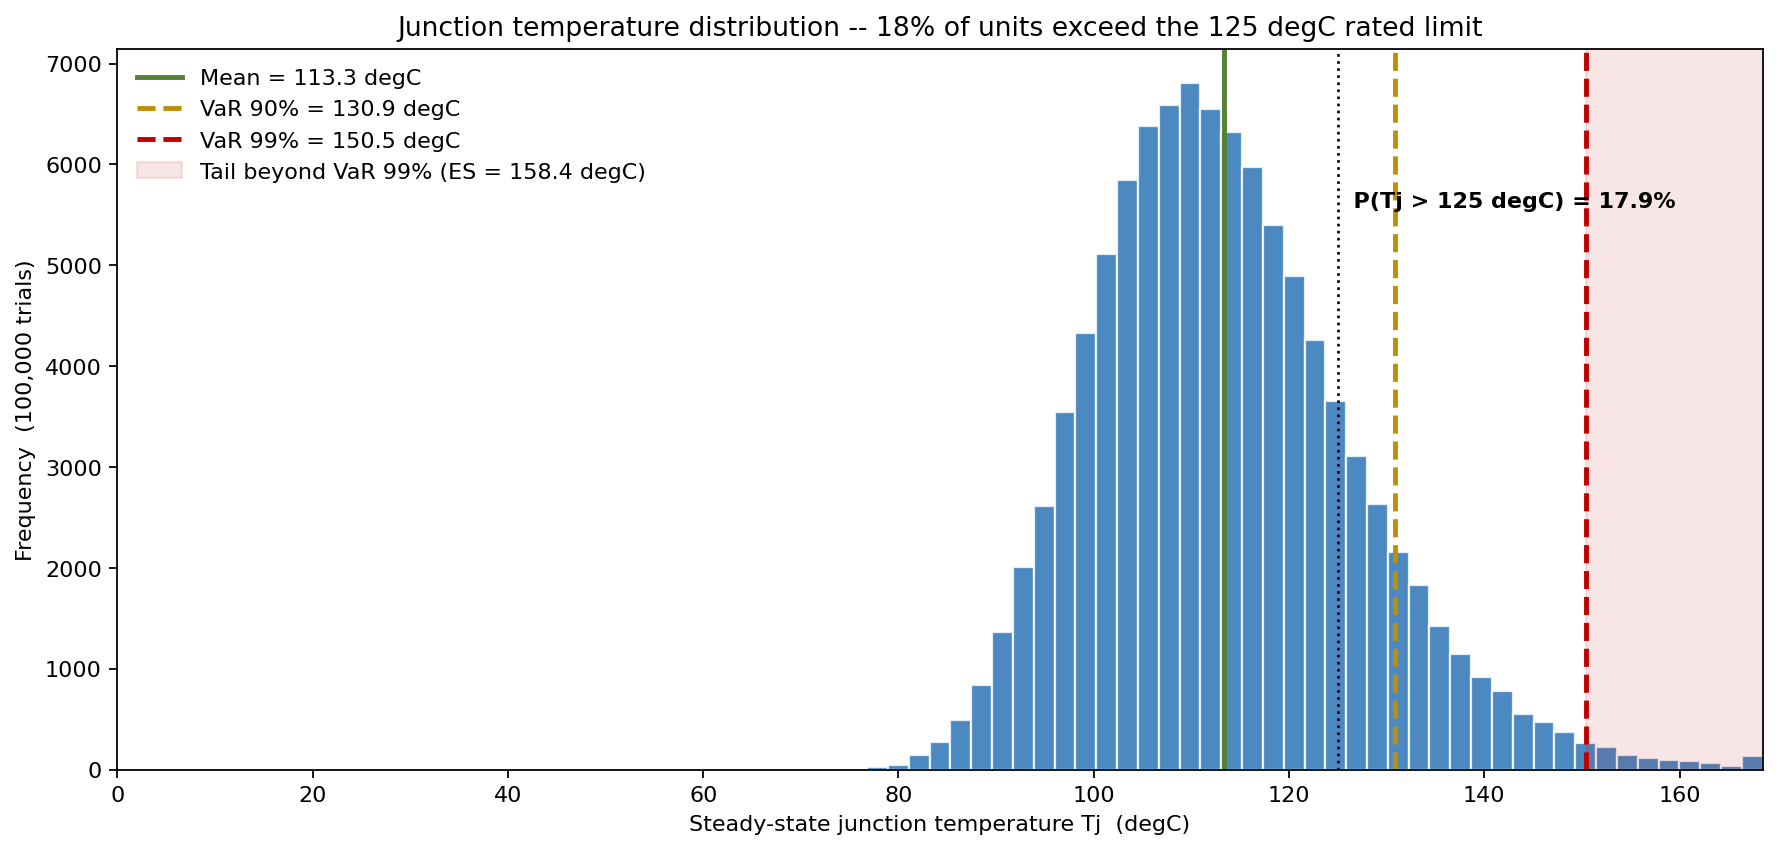
The headline distribution tells the whole story. Mean Tj is 113 degC, P50 is 112 degC, P90 is 131 degC and P99 is 151 degC. Against the 125 degC rated limit, 17.9% of the modelled fleet runs over — a failure rate the 109.7 degC point estimate cannot represent because the point estimate has no width.
Modelling the resistance network as distributions
Each input was assigned a defensible distribution from bench data and supplier specifications:
- Power dissipation P — Normal, 42 W mean with about 5% per-unit electrical scatter (sd 2.1 W).
- Convection coefficient h — LogNormal, median 55 W/m2K with a 0.28 log-sigma. Right-skewed by construction: the long left tail of poor cooling is what drives the hot units.
- Junction-to-case Rjc — Normal, 0.45 degC/W with 8% datasheet tolerance.
- Interface resistance Rint — Normal around 0.30 degC/W, but built from a shared per-lot bias (sd 0.06 degC/W across 40 assembly lots) plus small within-lot scatter. This common-mode factor is deliberate: without it, summing independent resistances would collapse toward a thin Normal by the central limit theorem and understate the tail. Units from one build share their interface offset, and that correlation fattens the tail that matters.
- Ambient air Tamb — Triangular(30, 40, 55) degC for the enclosure intake.
What actually moves the junction temperature
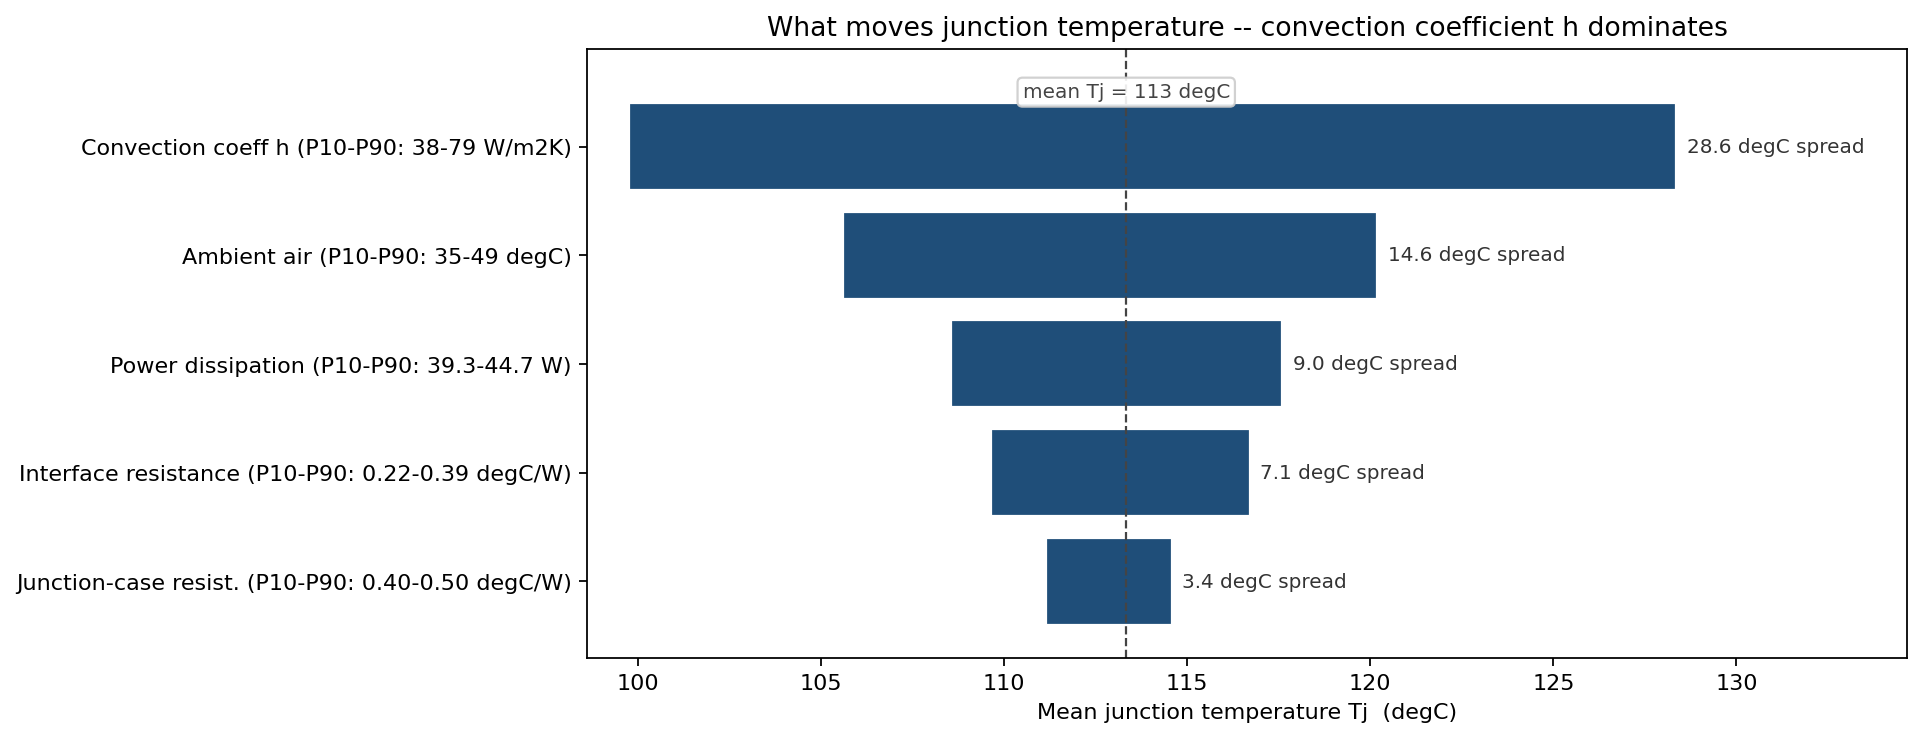
Sweeping each input across its P10-P90 while the rest stay stochastic ranks the drivers cleanly against the 113 degC baseline:
| Input | Tj at P10 input | Tj at P90 input | Spread |
|---|---|---|---|
| Convection coefficient h | 99.8 degC | 128.4 degC | 28.6 degC |
| Ambient air Tamb | 105.6 degC | 120.2 degC | 14.6 degC |
| Power dissipation P | 108.6 degC | 117.6 degC | 9.0 degC |
| Interface resistance Rint | 109.7 degC | 116.7 degC | 7.1 degC |
| Junction-case Rjc | 111.1 degC | 114.6 degC | 3.4 degC |
The convection coefficient dominates by a wide margin: its P10-P90 band alone swings the mean junction temperature by 28.6 degC, more than the next two drivers combined. Cooling — not the semiconductor, not the interface paste — is where the design risk lives.
How much cooling buys down the risk
Because h is the dominant lever, the design question becomes: what convection coefficient must the enclosure actually deliver to push exceedance to an acceptable level? Sweeping the design-point h (with h still varying unit-to-unit around it) maps the trade directly.
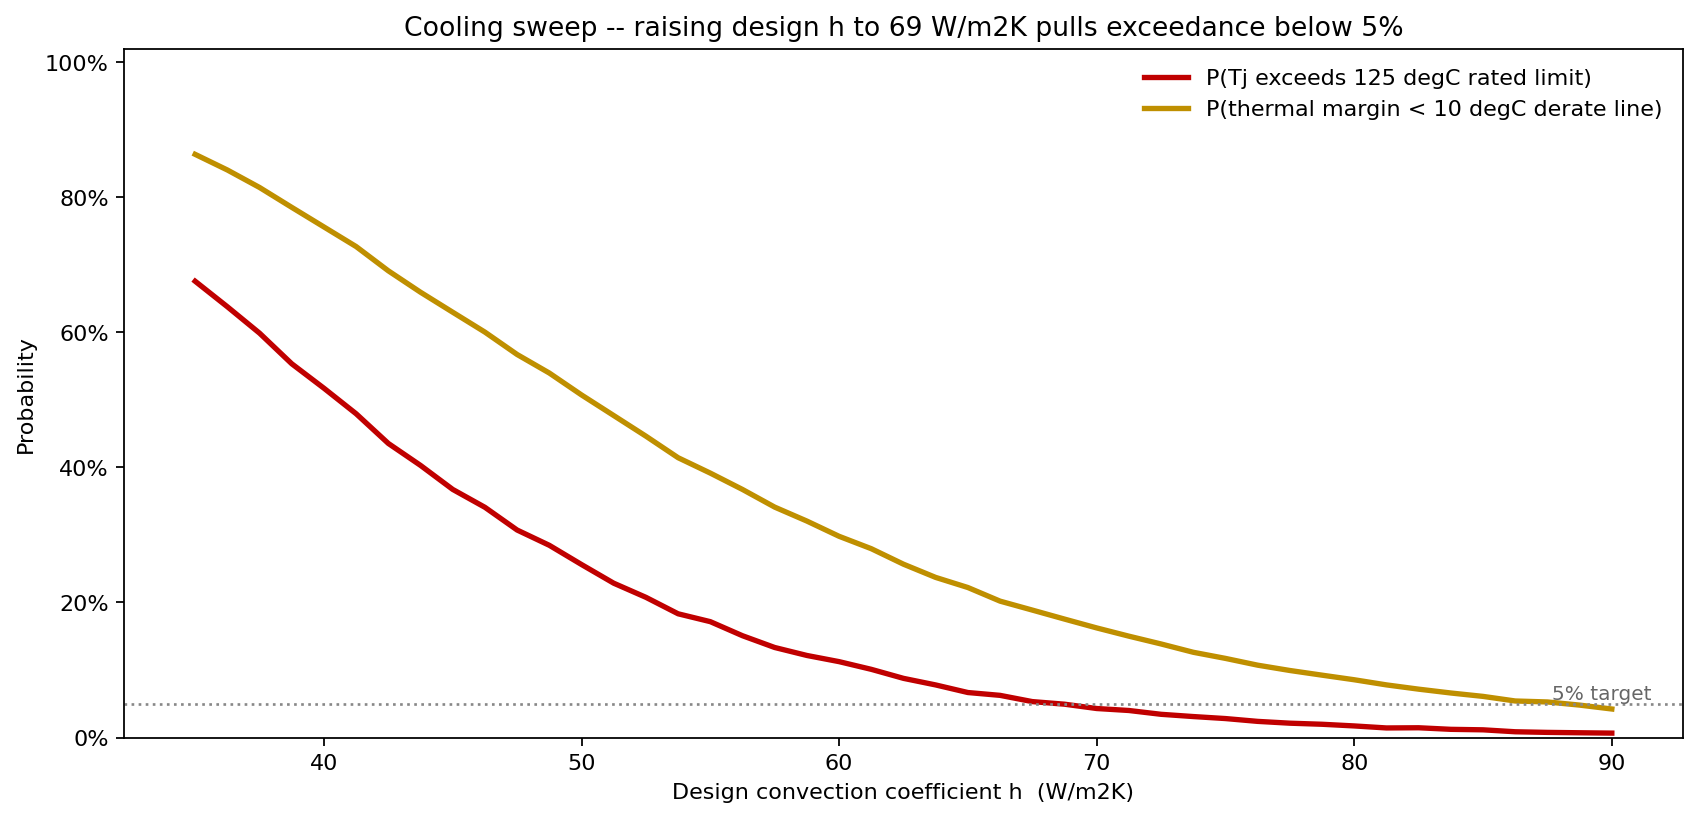
- At h = 40 W/m2K, P(Tj > 125 degC) is 51.7% — a coin flip.
- At h = 55 W/m2K (the current median), it is 17.2%.
- At h = 70 W/m2K, it falls to 4.3%.
- At h = 85 W/m2K, 1.1%.
The 5% exceedance target is met at h = 69 W/m2K. That single number sized the fix: the enclosure airflow had to be raised from a median 55 to a guaranteed 69 W/m2K, achievable with a larger fan and a revised duct rather than a more expensive semiconductor.
The margin distribution that drove the derating policy
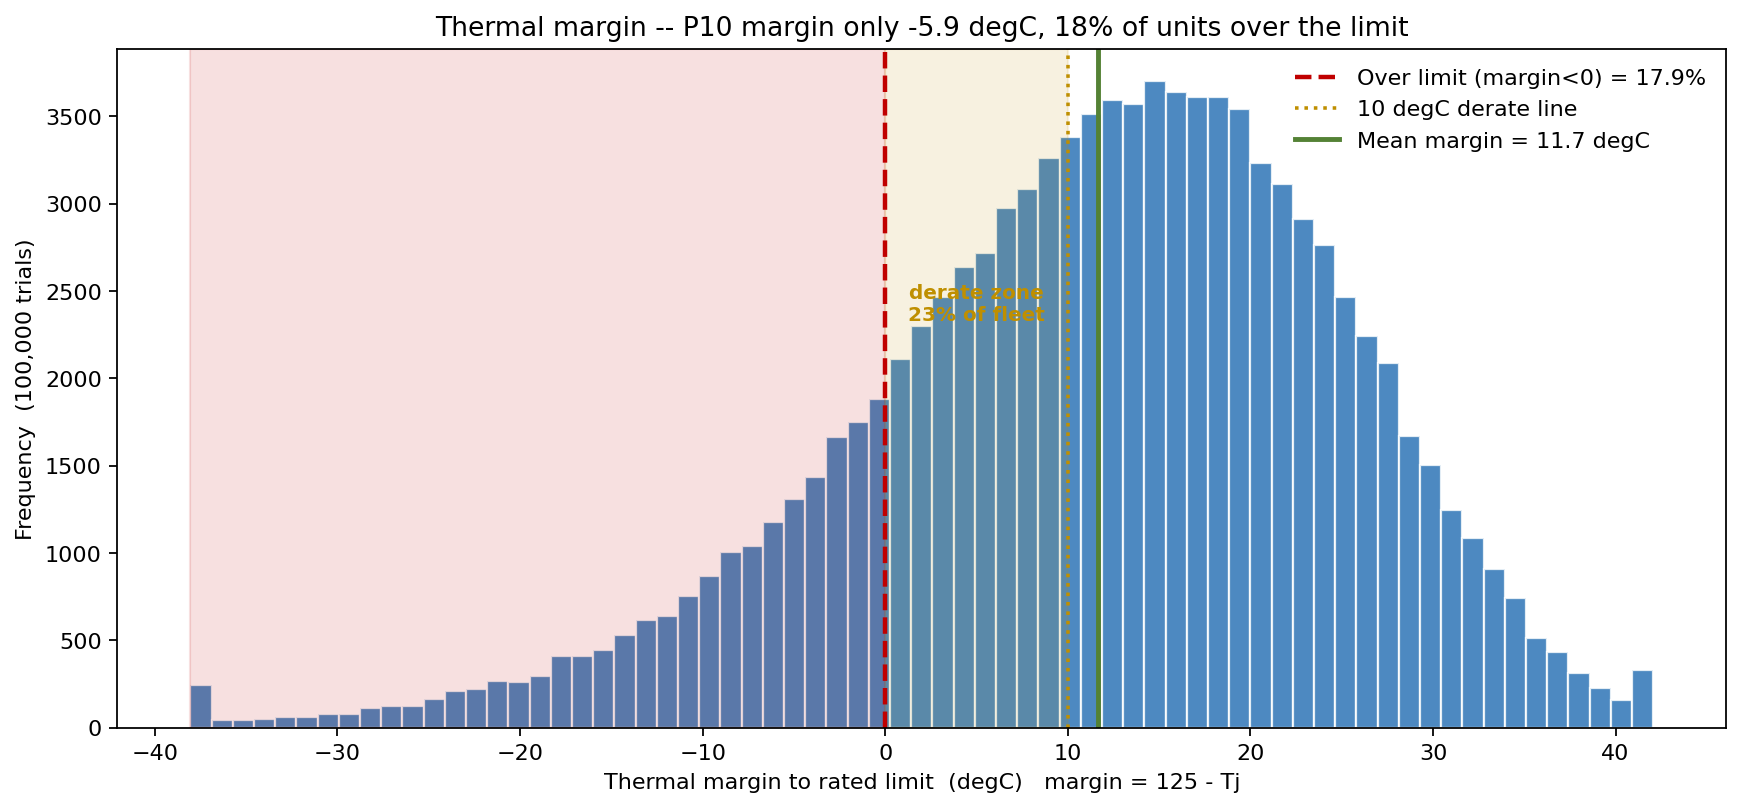
Reframing Tj as thermal margin (125 - Tj) splits the fleet into three operating bands. 17.9% of units sit over the limit (negative margin); 23.3% land in the 0-10 degC derate zone where reliability degrades sharply; 58.8% are genuinely safe with 10 degC or more of headroom. The mean margin is a thin 11.7 degC and the P10 margin is actually negative at -5.9 degC — meaning a tenth of the fleet ships already over its rated limit. No point estimate that reports "15 degC of margin" can convey that.
What the model changed
- Enclosure airflow respecified to deliver h >= 69 W/m2K, the value the sweep showed pulls exceedance below 5%, rather than chasing a lower-Rjc part.
- Interface-paste process controlled to the lot, after the model showed the shared per-lot bias — not unit-to-unit scatter — was fattening the high-temperature tail; incoming Rint is now sampled per build lot.
- Junction derating policy adopted: parts in the 0-10 degC margin band are flagged for the high-airflow SKU, formalising the 23% derate-zone finding into a screening rule.
- A 17.9% exceedance figure replaced "15 degC of margin" in the qualification report, giving reviewers a probability they could act on.
ModelRisk Functionality Used
- Series thermal-resistance simulation propagating five uncertain inputs through Tj = Tamb + P(Rjc + Rint + Rsa), turning a one-line datasheet sum into a full junction-temperature distribution (mean 113 degC, P99 151 degC).
- LogNormal convection model capturing the right-skewed reality of forced-air cooling, the term the tornado showed contributes a 28.6 degC swing — the single largest driver.
- Per-lot common-mode interface bias preventing the central-limit collapse that independent-resistance sampling would have produced, preserving the high-temperature tail.
- Convection-coefficient sweep locating h = 69 W/m2K as the value that holds P(Tj > 125 degC) at 5%, sizing the cooling fix directly.
- Thermal-margin banding quantifying the 17.9% over-limit / 23.3% derate / 58.8% safe split that became the screening policy.
A deterministic thermal calculation answers "what is the junction temperature?" with a single comfortable number; Monte Carlo answers "what fraction of the fleet runs over its rated limit, and which input do I fix to change that?" — and here those answers were 17.9% and the convection coefficient.