

Industry: Engineering
Product: ModelRisk
Application: Fatigue Analysis
A welded bridge bracket designed for 25 years fails before then almost half the time
A consultancy maintaining a major highway viaduct had to answer a deceptively simple question for a critical welded bracket on an expansion joint: will it survive its 25-year design life? The standard calculation said yes. Feeding the nominal traffic spectrum through the detail's S-N curve and accumulating damage with Miner's rule returned a point-estimate life of about 40 years — a comfortable 15-year margin over the design life. On that single number the maintenance interval was set and the file was closed.
When the same calculation was rebuilt in ModelRisk as a Monte Carlo simulation of 60,000 nominally identical brackets, the comfort disappeared. The median life dropped to 27 years, the P10-to-P90 spread ran from 11 to 84 years, and the probability of a fatigue crack before the 25-year design life came out at 45.9%. The deterministic 40-year answer was not wrong so much as misleading: it sat in the long right tail of a heavily skewed distribution, well above the lives most brackets would actually achieve.
Why a point estimate fails here
Fatigue life is the reciprocal of accumulated damage, and damage is driven by stress cubed (the Basquin slope of this detail is m = 3). Cubing a quantity that is itself uncertain pushes the bad cases far harder than the good cases, so the life distribution is strongly right-skewed. On a skewed distribution the mean and the deterministic "best estimate" both land far above the median — they describe a typical bracket badly. A point estimate also cannot express the only number the asset owner actually cares about: the probability of reaching the design life. ModelRisk delivers that number directly.
The model keeps the S-N curve itself fixed — its characterization is a separate exercise. What it propagates is the service loading plus a per-unit build factor:
- Load-amplitude scatter. The measured load history is binned into five rainflow stress-range blocks (heavy truck down to wind buffeting). Each block's stress range is a Weibull draw around its nominal value.
- A shared weld build-quality factor. A single LogNormal factor per bracket (mean ~1.07, heavy right tail) scales the effective stress of every block together. Because it is common to all blocks, the five contributions do not behave like independent draws — they do not average out, and the life distribution keeps its real spread instead of collapsing to a thin band.
- A shared traffic-growth factor scaling all annual cycle counts together over the life.
The fatigue life distribution
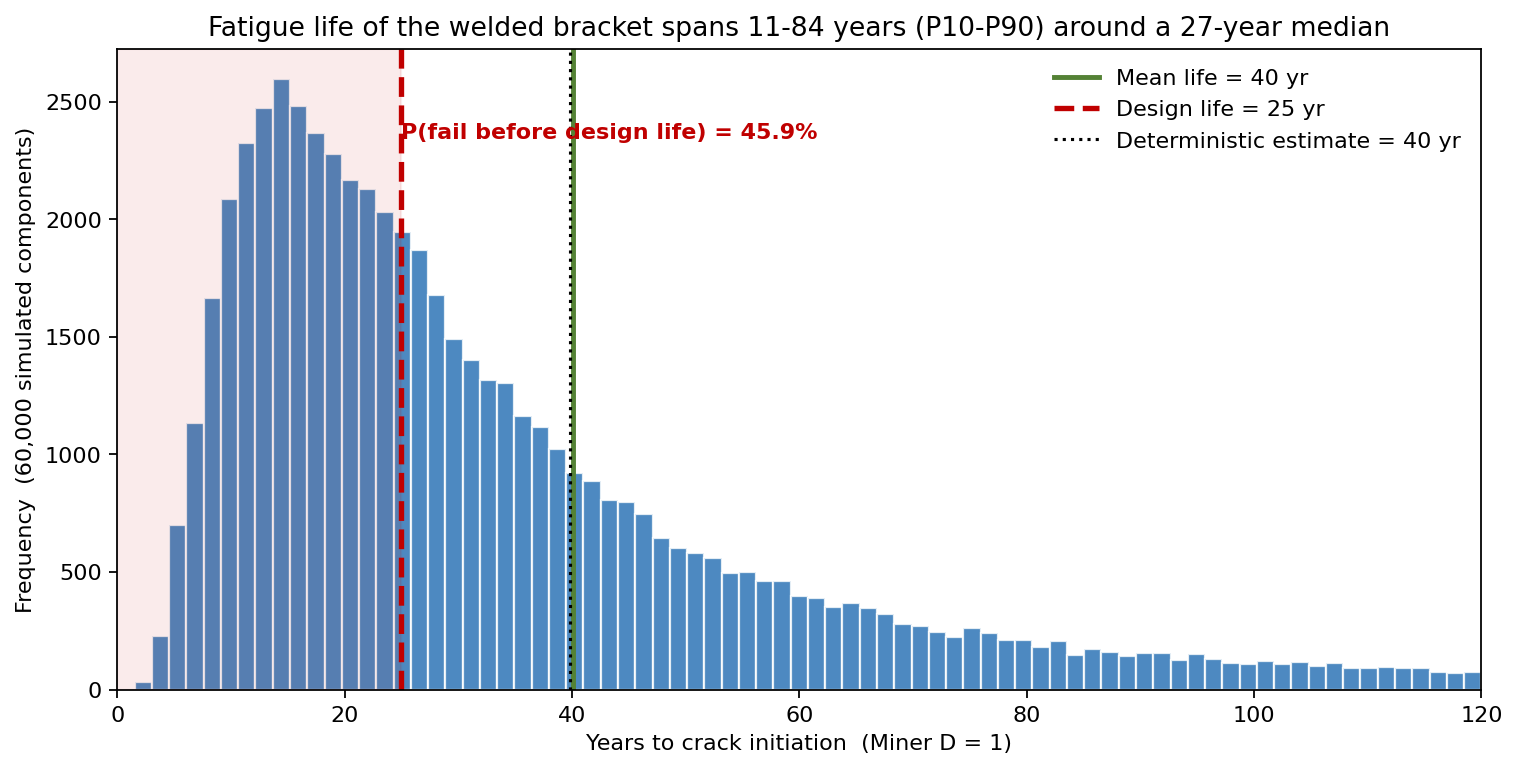
The headline output is the distribution of years to crack initiation (Miner damage D = 1) across the simulated population. The simulation reports a mean life of 40 years, a median of 27 years, a P10 of 11 years and a P90 of 84 years. The deterministic point estimate of 40 years coincides with the mean — and the chart shows exactly why that is a trap: the mean sits to the right of the bulk of the population, with a long thin tail of lucky brackets dragging it up. The shaded region left of the 25-year design line captures the 45.9% of brackets that crack before design life.
Survival across the service life
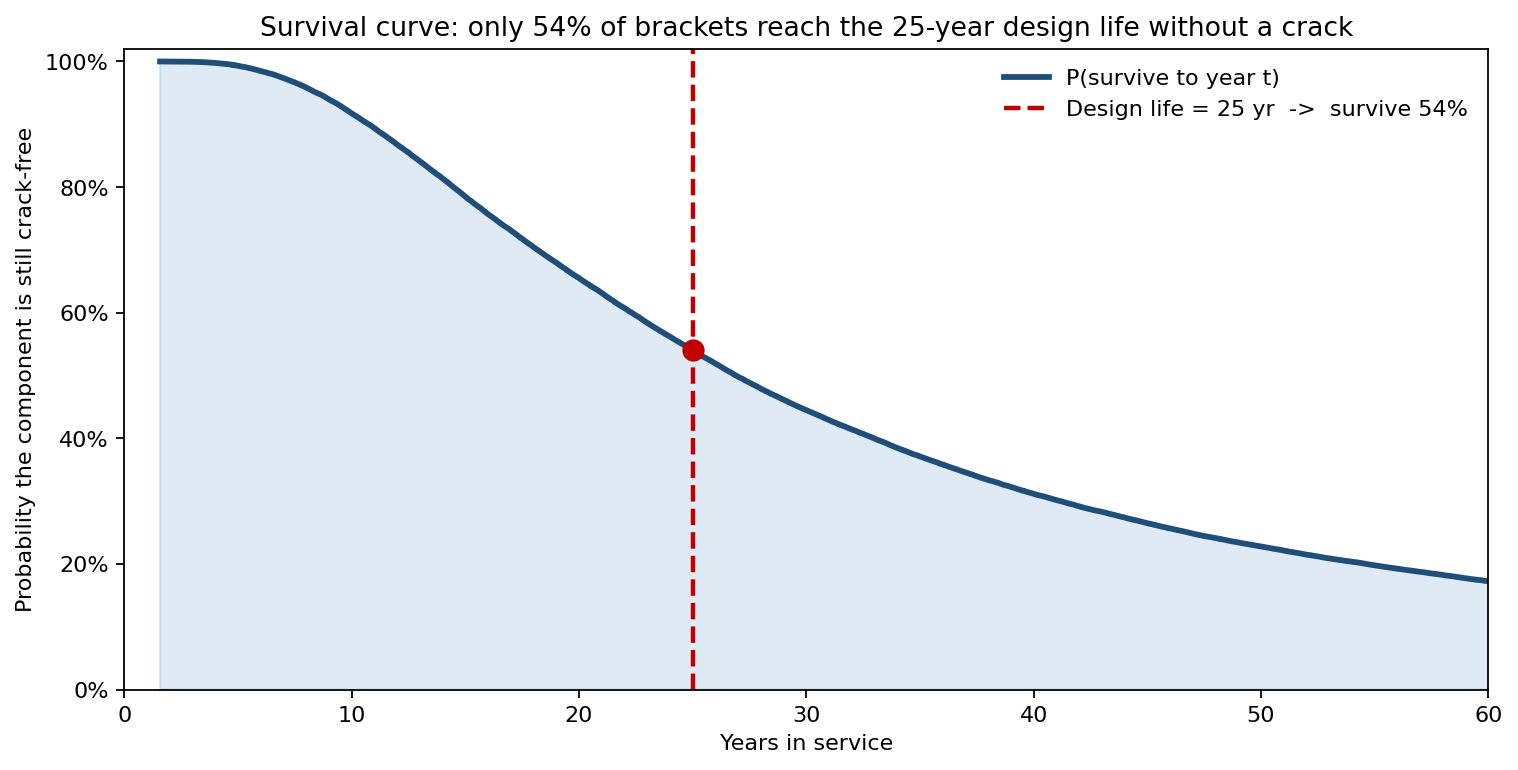
Re-expressed as a survival curve, the result becomes an inspection planning tool. The probability that a bracket is still crack-free is 91.7% at 10 years, 78.5% at 15 years, 65.5% at 20 years and 54.1% at the 25-year design life, falling to 44.5% at 30 years and 31.2% at 40 years. Rather than a single "safe until year 40" claim, the owner gets a continuous risk profile to set risk-based inspection intervals against.
Where the damage actually comes from
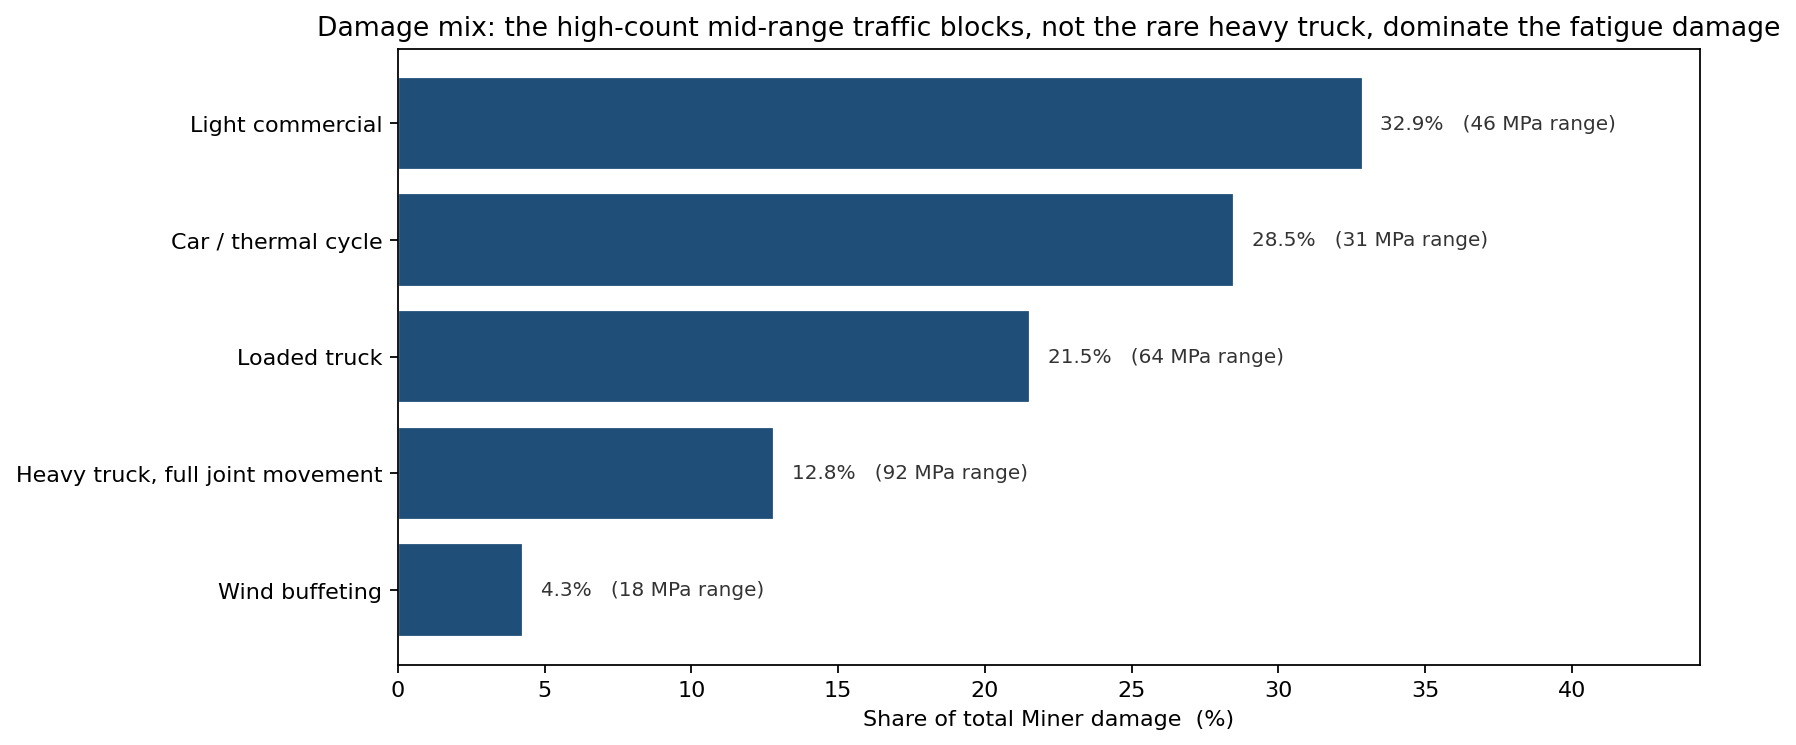
Decomposing the Miner sum shows that the rare heavy-truck event is not the main culprit. The light-commercial block (46 MPa range) contributes 32.9% of total damage and the car / thermal-cycle block (31 MPa) a further 28.5%, simply because their cycle counts are so high. The loaded truck (64 MPa) adds 21.5% and the heavy truck (92 MPa) only 12.8%, with wind buffeting at 4.3%. This is the kind of counter-intuitive insight a deterministic worst-case calculation hides: chasing the heaviest load would barely move the life.
What drives the early failures

A tornado on the P10 (early-failure) life, baseline 11 years, ranks the inputs by how far each moves that unlucky-tail life. The weld build-quality factor dominates (low +5.1 years, high -3.8 years, an 8.8-year spread), followed by the traffic-growth multiplier (4.5-year spread). The heavy-truck stress range and the endurance limit each move P10 life by under a year. The message for the asset owner is blunt: tightening weld inspection and acceptance criteria buys far more fatigue life than any change to the assumed load magnitudes.
What the model changed
The deterministic 40-year answer would have set a single mid-life inspection and treated the bracket as low-risk. The probabilistic answer reframes it as a population in which nearly half of installed brackets crack before the design life, with weld quality — not traffic loading — as the controlling variable. The consultancy moved to a risk-based inspection schedule keyed to the survival curve, front-loaded weld-quality acceptance on new fabrication, and reported the 45.9% pre-design-life failure probability to the owner as a number, not a reassurance.
ModelRisk functionality used
- Monte Carlo simulation propagating the full service-load spectrum and per-unit build factors through a fixed S-N curve and Miner's-rule damage summation.
- Weibull and LogNormal distributions for load-amplitude scatter and the shared build-quality and traffic-growth factors.
- Common-cause factors shared across all load blocks of a unit, preventing the artificial variance collapse that independent draws would produce.
- Sensitivity analysis (tornado) to rank drivers of the early-failure tail.
- Output statistics and percentiles delivering the survival curve and the probability of reaching design life directly.