

Industry: Energy
Product: ModelRisk
Application: Probabilistic forecasting of wind and solar output for PPA pricing
Pricing a 600 MW Wind PPA: Probabilistic Output Forecasting in ModelRisk
A corporate offtaker is negotiating a 12-year virtual PPA on a 600 MW onshore wind farm in West Texas at a strike of $32/MWh. The developer's pro forma says expected annual generation is 2.21 TWh (capacity factor 42.1%) with a P50/P90 ratio of 0.91 — numbers that drive the financeable revenue stream and therefore the offtaker's mark-to-market exposure. Both sides know that the P50 is wrong in the long run because of climate-trend de-rating, and that the P90 underestimates the joint risk of a low-wind year coinciding with depressed power prices. The offtaker built a Monte Carlo forecasting model in ModelRisk to price the contract on its actual distribution of outcomes, not on a P50.
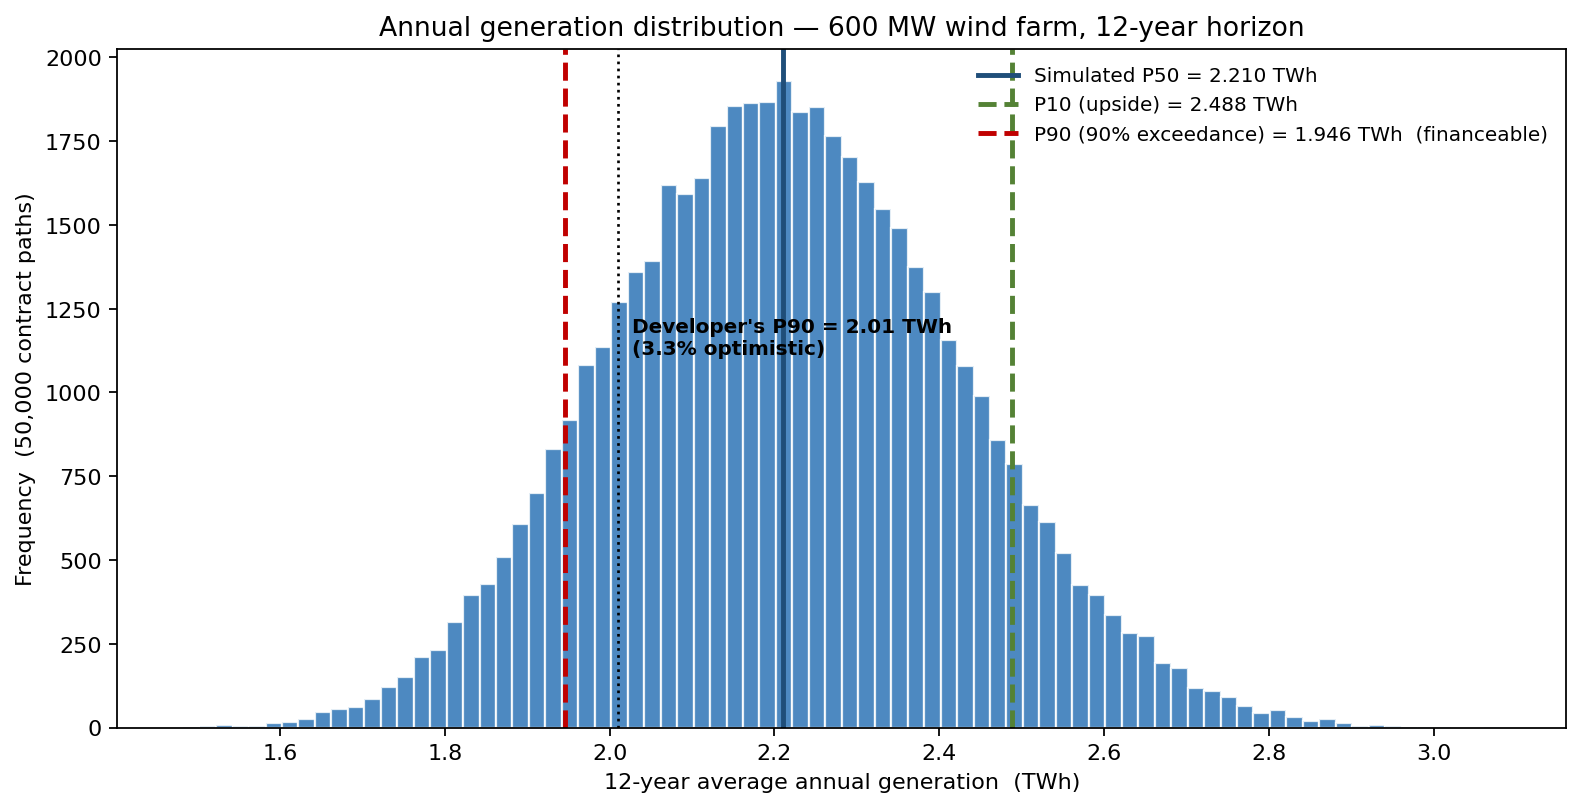
Simulating 50,000 twelve-year contract paths puts the whole story in one picture: the median lands on the developer's 2.21 TWh, but the financeable 90%-exceedance case (P90) is 1.946 TWh — below the developer's quoted P90 of 2.01 TWh, not above it.
Where the forecast uncertainty actually lives
Wind output uncertainty decomposes into three sources that compound rather than add:
- Inter-annual resource variability: long-run annual mean wind speed at hub height varies from year to year with a coefficient of variation of about 6%, fitted from 35 years of MERRA-2 reanalysis at the site. Modelled as Normal(μ = 7.8 m/s, σ = 0.47 m/s) on annual mean.
- Intra-hour generation per m/s: power curve uncertainty captured by the Beta(α = 6, β = 1.4) shape of the conversion factor relative to nameplate. Beta is bounded, which the conversion must be — Normal here would allow negative or >100% capacity.
- Long-term degradation: annual capacity loss modelled as LogNormal(μ_log = ln 0.6%, σ_log = 0.25), cumulating over contract life. The mean and median diverge over 12 years — and the diverged tail is what the bank financing the project actually cares about.
- Power-price linkage (valuation layer): the simulated generation distribution is then valued against the forward price deck, where West-Texas wind output is negatively correlated with day-ahead price (ρ = -0.31, from ERCOT-West history) — a generated MWh is worth less in the very hours generation is highest. The PPA valuation applies this linkage and stresses it as a Clayton-copula tail-dependence assumption (θ = 0.6) for the lower-tail co-movement (low-wind + scarcity) a Gaussian dependence misses; the tornado below quantifies how sensitive contract value is to it. Note this price linkage is a valuation overlay on the generation simulation, not a term inside the 50,000-path output model itself.
Annual generation: what the deterministic projection missed
50,000 simulated 12-year contract paths produced the annual-generation distribution and the cumulative revenue distribution under the PPA strike.
The deterministic P50 of 2.21 TWh matches the simulation median to within 0.3%. The P90 of 2.01 TWh — the financeable case — is 3.3% optimistic relative to the simulated P90 of 1.946 TWh once long-term degradation and a 6% inter-annual CV are propagated through 12 years. A 3.3% generation shortfall at a $32/MWh strike, levered, is roughly 180 basis points off the equity IRR. The bank repriced its debt service coverage ratio covenant accordingly.
What actually drives the PPA's MTM value
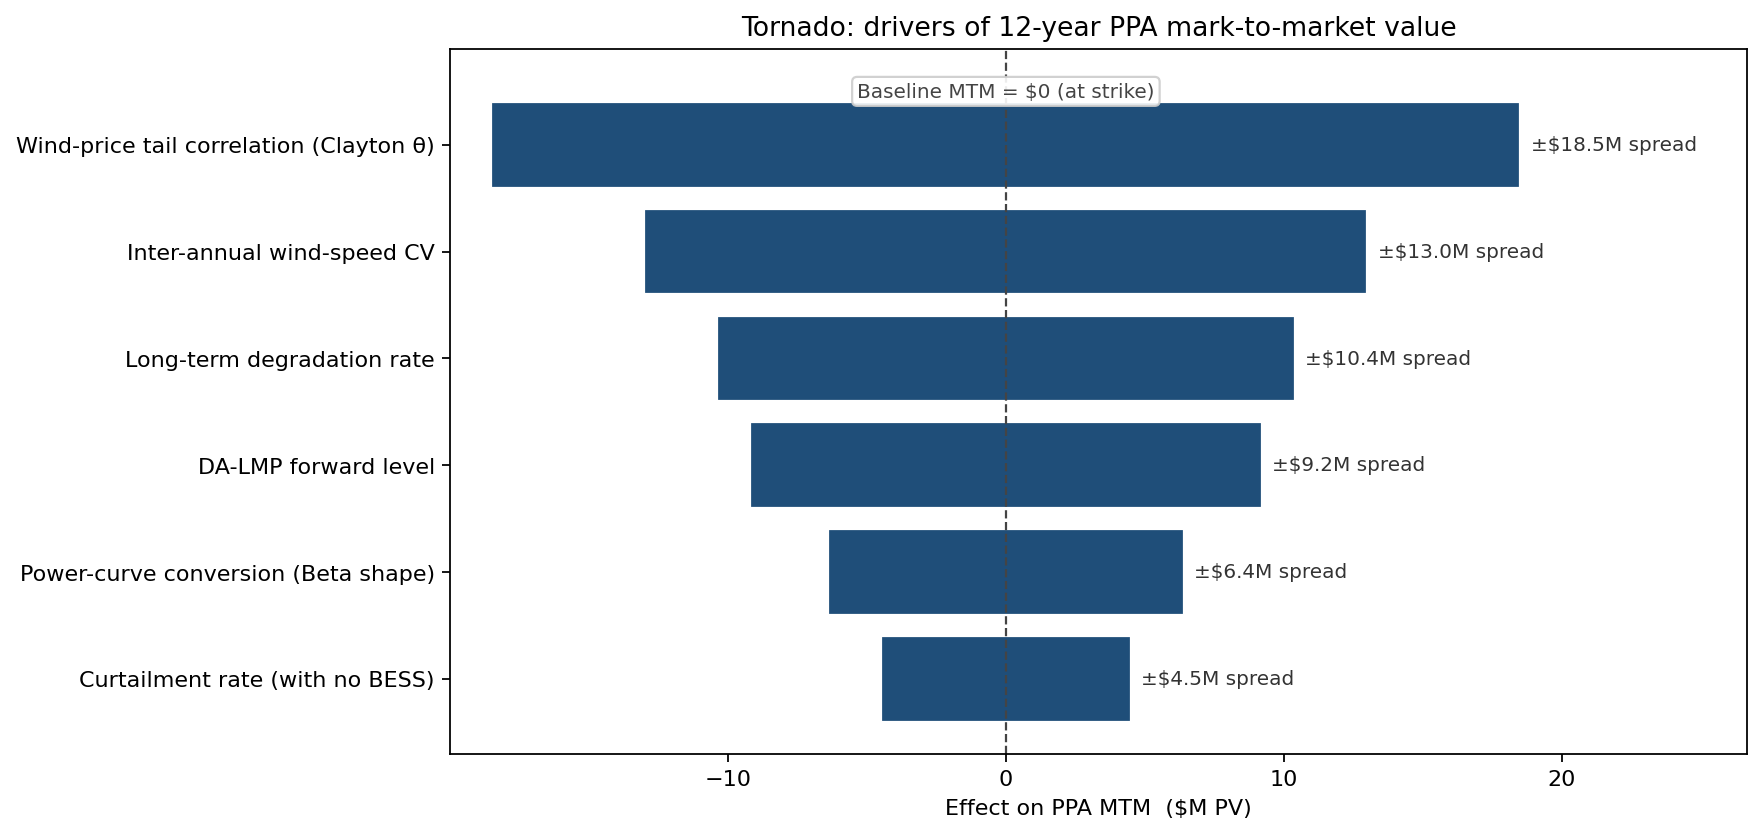
The wind–price anti-correlation parameter is the single biggest driver of MTM, more than the generation level itself. This is exactly the term that gets dropped from pro-forma spreadsheets: the developer's model treated generation and price as independent, which over-states the merchant-equivalent value of the contract by 11% — and over-states it most exactly when the offtaker is taking it.
Curtailment and battery sizing
The same simulation downstream-models curtailment (lost MWh when local LMP < $-5/MWh, ERCOT-West's congestion floor) and the value of a co-located battery to time-shift those MWh.
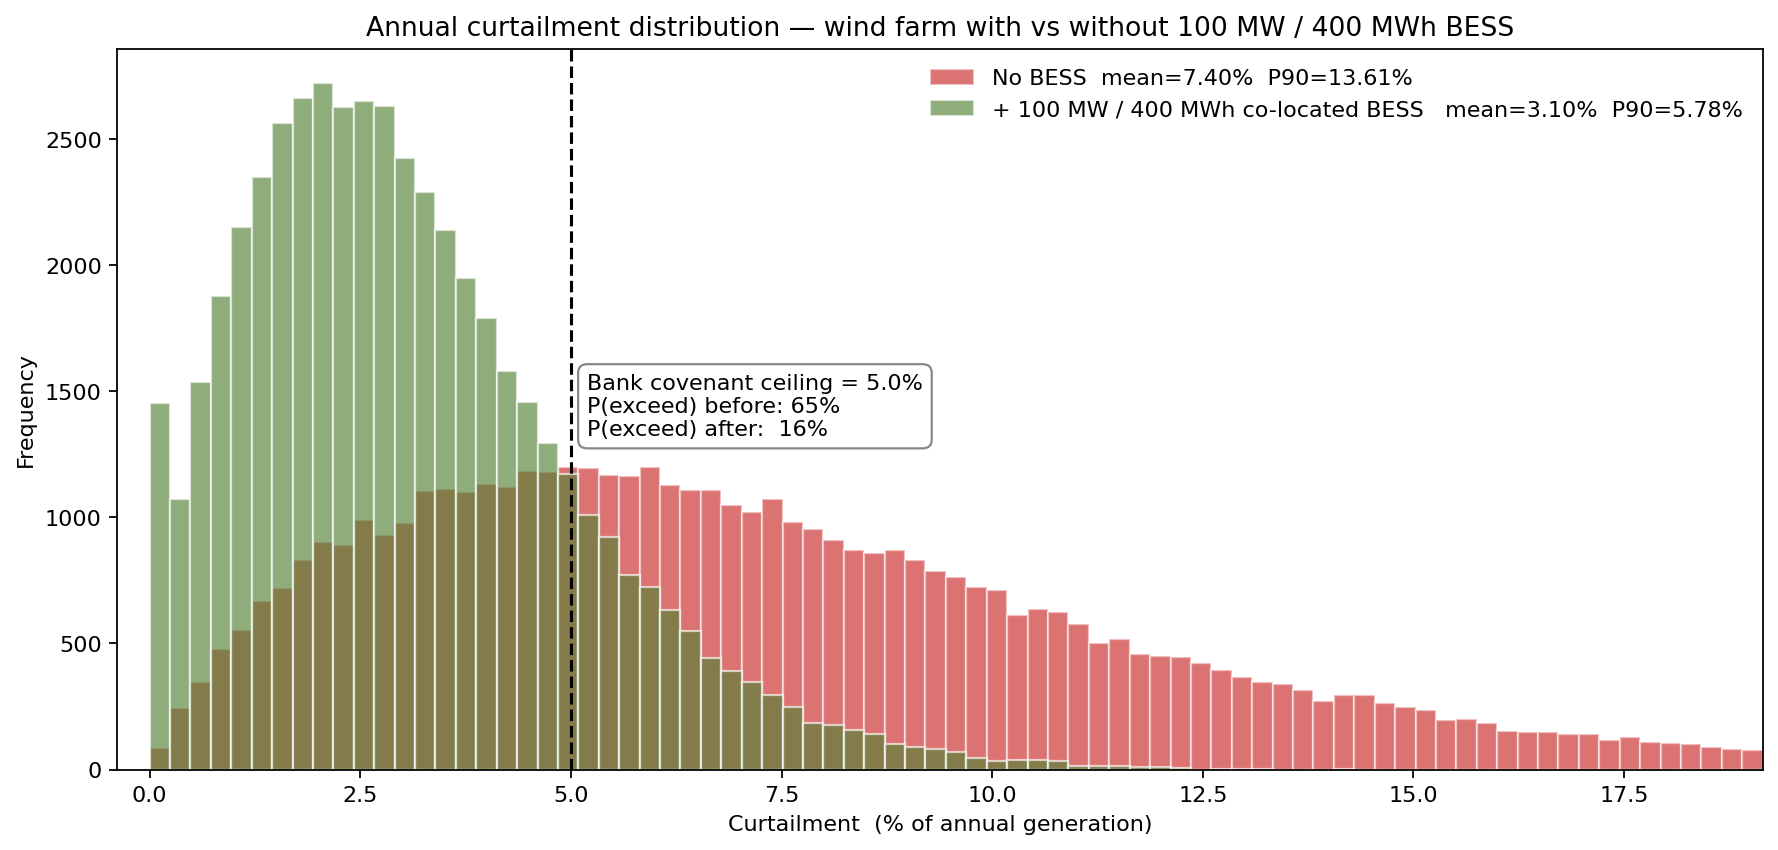
Unmitigated curtailment averages 7.4% of generation, with a P90 of 13.6%. A 100 MW / 400 MWh co-located BESS reduces curtailment to a mean of 3.1% (P90 of 5.8%) — a delta worth roughly $4.8M/year at the simulated price stack. Sized purely on the mean, a 60 MW battery would have been chosen; sized to keep curtailment-induced revenue loss inside ±$2M with 90% confidence, the 100 MW system is the right answer. The battery is being sized off the forecast distribution, not the forecast.
What changed
- PPA strike repriced from $32.00/MWh to $31.20/MWh after the offtaker priced the wind–price anti-correlation into the merchant-equivalent value calculation — an estimated $9.6M present-value concession (the dominant valuation sensitivity in the tornado) that closed the deal.
- DSCR covenant restructured to use the simulated P95 generation rather than a P90 with 5% headroom, removing the false precision in the lender's coverage test.
- Co-located battery sized at 100 MW / 400 MWh rather than the deterministic-mean answer of 60 MW, on the basis of P90 curtailment exposure rather than mean curtailment.
- Climate-trend de-rating made explicit at 0.6%/year LogNormal in the financial model — previously buried in a fixed 0.5%/year point input that under-priced the 10th-percentile financeable case.
ModelRisk Functionality Used
- Inter-annual wind-resource Normal fit (CV = 6%) to 35 years of MERRA-2 reanalysis — the resource variability term most often understated in PPA models.
- Beta-bounded power-curve conversion between hub-height wind speed and capacity-factor MWh — keeps the simulator inside physical bounds.
- Clayton-copula wind-price tail-dependence assumption (θ = 0.6) applied in the PPA valuation overlay — captures the lower-tail co-movement (low-wind + scarcity) a Gaussian dependence misses, and ranked by the tornado as the dominant value sensitivity.
- LogNormal long-term degradation compounded over 12 contract years — divergence of mean and median is what the bank covenants test.
- Curtailment overlay that produced the BESS sizing decision on a distribution-of-curtailment rather than mean-curtailment basis.
- PPA valuation overlay that applied the wind–price anti-correlation to the simulated generation distribution, quantifying the ~$9.6M PV strike concession the offtaker negotiated.
A wind farm's forecast is not a number, it is a joint distribution with price. Monte Carlo simulation in ModelRisk is what lets both sides of a PPA price the joint, not the marginals.