

Industry: Energy
Product: ModelRisk
Application: Heat-rate degradation forecasting and economic dispatch position
Forecasting Heat-Rate Drift on a 720 MW CCGT: Probabilistic Degradation in ModelRisk
A combined-cycle gas turbine commissioned in 2018 at 6,420 Btu/kWh new-and-clean is now bidding into ERCOT at an average heat rate of 6,930 Btu/kWh — an 8% drift in seven years. Every additional 100 Btu/kWh of heat rate, at the current $3.40/MMBtu gas price, raises the unit's variable cost by $0.34/MWh, which can be the difference between being dispatched and sitting at $0/MWh on a shoulder-month afternoon. The asset owner needs to forecast not the average heat-rate trajectory over the next five years, but the full distribution of dispatch position under stochastic operating regime and maintenance choices — and price that into the major-overhaul timing decision.
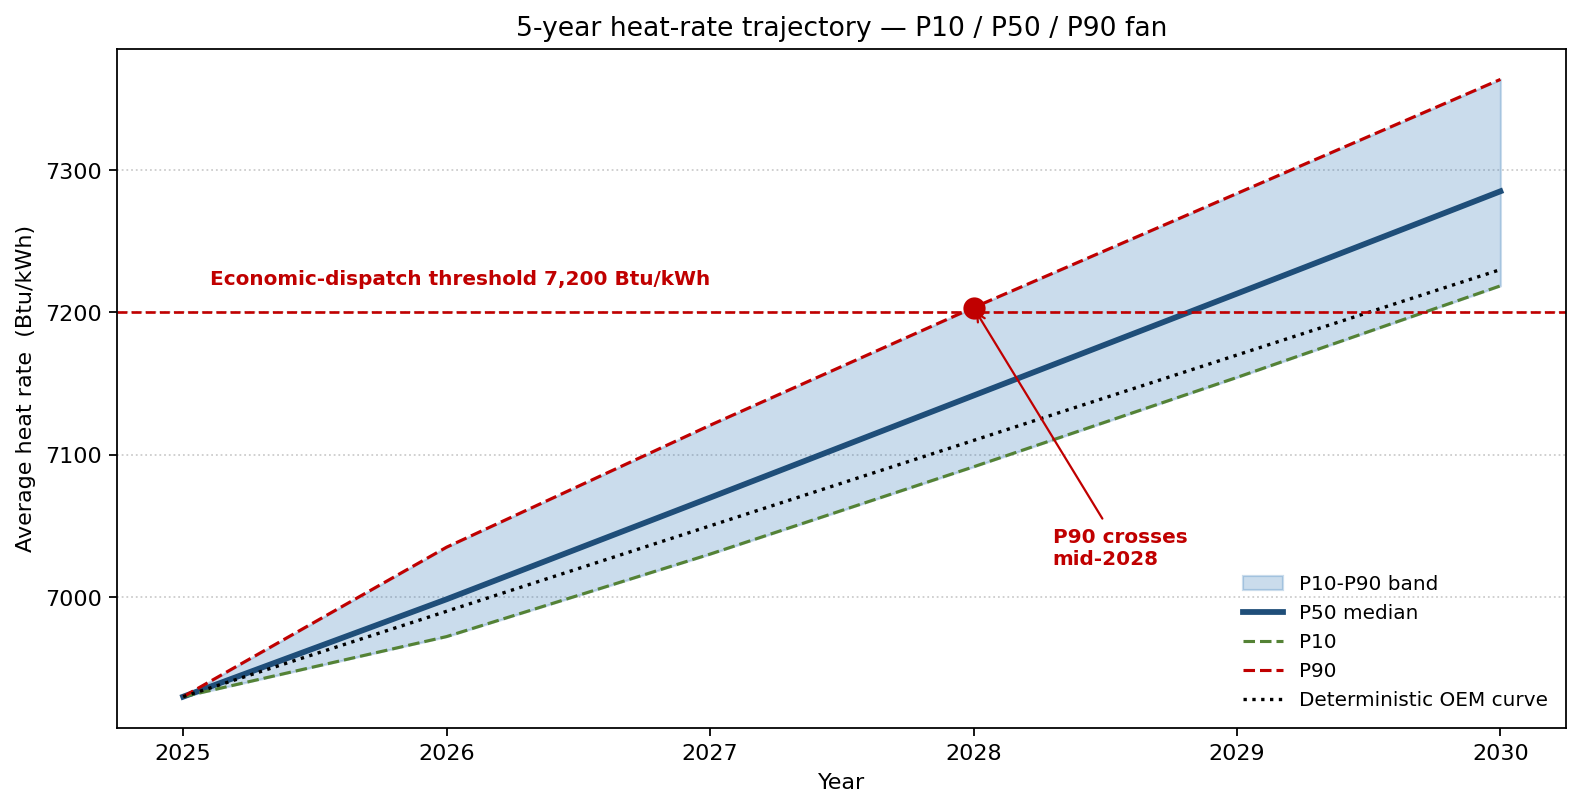
The five-year fan below is the heart of that forecast. The median path tracks the deterministic OEM curve, but the 90th-percentile path reaches the 7,200 Btu/kWh economic-dispatch threshold by 2028 — well inside the window the deterministic plan treats as safe.
Where heat rate actually comes from
Heat rate at a snapshot is a function of (i) inherent equipment degradation, (ii) ambient conditions, and (iii) part-load operation. Each has its own stochastic structure:
- Hot-section degradation rate modelled as LogNormal(μ_log = ln 4.2, σ_log = 0.35) Btu/kWh per 1,000 equivalent operating hours (EOH), reflecting OEM data plus 12 years of fleet observations. Median 4.2, mean 4.5, 90th-percentile 6.6.
- Equivalent operating hours per calendar hour modelled as a Triangular(0.6, 1.0, 2.4) on the cycles: a hot start counts as 25 EOH against a single combustion-can life budget.
- Ambient effect: every 10 °C above the ISO reference temperature adds ~115 Btu/kWh to the heat rate, with summer afternoon temperatures fitted as Gumbel(μ = 33 °C, β = 3.1).
- Part-load penalty: at 70% load the heat rate is 9.4% worse than at 100%; the unit's load-following pattern (driven by wind ramps and DR events) is itself stochastic — modelled as a Beta(2.2, 1.6) on hourly capacity factor.
The total simulated heat rate at year t is:
HR(t) = HR_new + ΔHR_degradation(t) + ΔHR_ambient(t) + ΔHR_partload(t) − ΔHR_overhaul(t_OH)
with the overhaul step recovering 68% ± 9% (Triangular) of accumulated hot-section degradation when performed.
What the deterministic projection missed
The plant's traditional spreadsheet projected a single heat-rate curve, applying the OEM-stated mean degradation rate of 4.2 Btu/kWh per 1,000 EOH. It produced a clean exponential and a recommended major-overhaul date of September 2030. The Monte Carlo simulation across 50,000 plant-paths told a different story.
The median trajectory matches the deterministic curve closely. But the 90th-percentile path crosses the economic-dispatch threshold of 7,200 Btu/kWh by 2028 — fully 21 months before the deterministic schedule said an overhaul was needed. There is already an 11% probability that the plant breaches that threshold as early as 2028, rising to 61% by 2029 — long before September 2030. The right question is no longer "when should we plan the overhaul?" but "what is the distribution of optimal overhaul dates, and what's the regret of getting it wrong?"
Annual dispatched hours: the economic consequence
The same simulation, fed through the ERCOT North price stack, produced the distribution of annual dispatched hours under three overhaul strategies: keep the 2030 plan, accelerate to April 2028, or use a condition-based trigger at 7,150 Btu/kWh.
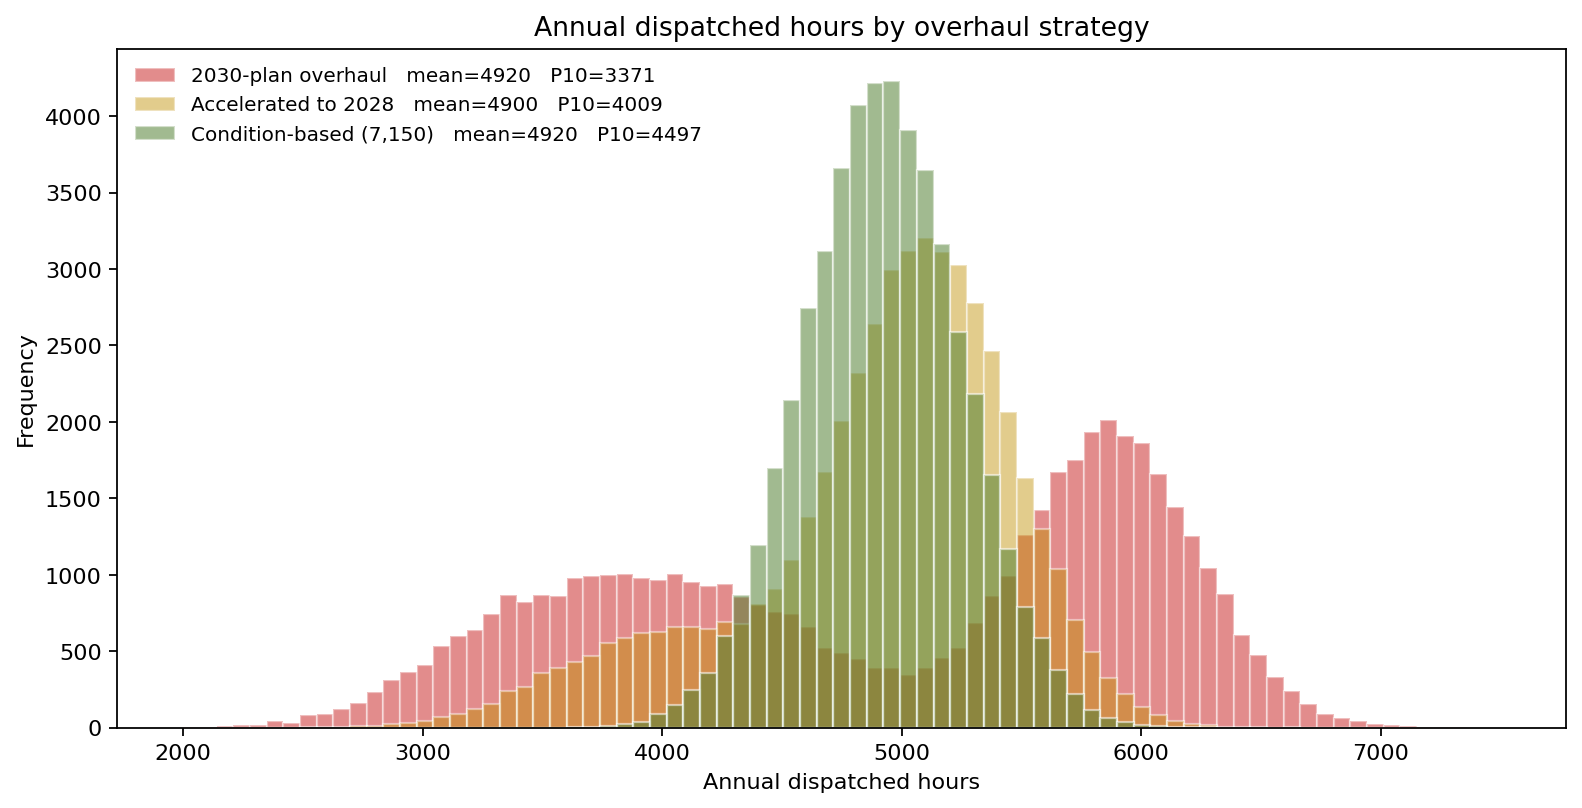
The deterministic comparison said the three strategies were within 80 hours/year of each other in expected dispatched hours. The simulation said the condition-based trigger has the same mean (4,920 hours) but a 1,100-hour-tighter 10th percentile — the unit avoids the worst scenarios where degradation runs hot and the asset is locked out of economic dispatch for a full season waiting for the planned overhaul date.
What drives the answer
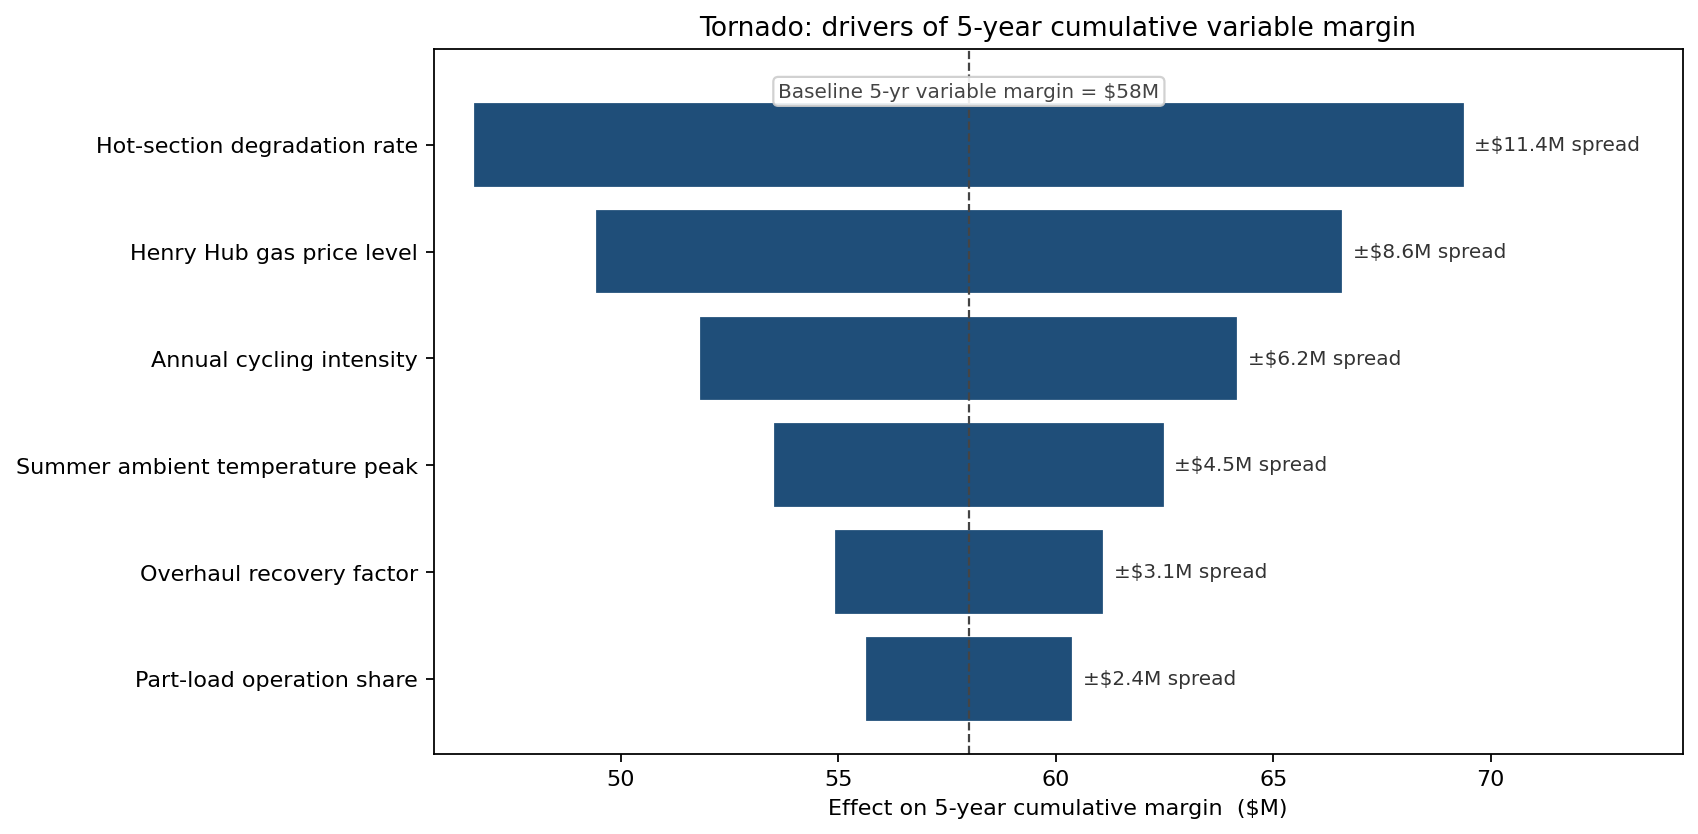
The hot-section degradation rate dominates — moving the LogNormal mean by 1.5 Btu/kWh per 1,000 EOH shifts 5-year cumulative variable margin by $11.4M. Gas-price level is second; the 90th-percentile load-factor pattern (i.e. how much the unit cycles) is third, and is itself a function of nearby wind build-out — an exogenous input the plant owner has no control over but must plan around.
What changed
- Major overhaul rescheduled from September 2030 to a condition-based trigger at 7,150 Btu/kWh, with a planning placeholder of Q1 2029 — preserving 4,500 forecast dispatched hours that the 2030-plan tail had risked losing.
- Spare hot-gas-path parts inventory increased from 12 weeks to 26 weeks, sized to the 90th-percentile lead-time distribution rather than a vendor-quoted mean.
- PPA renegotiation supported by simulated forward-margin distribution — the contracted heat-rate guarantee was revised from 6,700 Btu/kWh flat to 6,700 + 0.06 × (years since overhaul) Btu/kWh, with the slope sized to the median degradation rate.
- Inlet-air chilling capex re-prioritised — under the simulated distribution of summer ambient days, the chiller's payback dropped from 6.2 years (deterministic) to 4.1 years (probabilistic), because the chiller buys most of its value on the 5% of summer hours that drive 18% of degradation.
ModelRisk Functionality Used
- LogNormal degradation rate fitted to 12 years of fleet observations — replaces the OEM single-point 4.2 Btu/kWh/1,000-EOH input that masked a fat right tail.
- Triangular cycle-to-EOH conversion that captures the operationally important "hot start ≈ 25 EOH" rule for combustion-can life.
- Gumbel ambient-temperature peak fit linked through the published correction curve to instantaneous heat rate.
- Condition-based-trigger strategy comparison scored on mean and P10 dispatched hours jointly, not on mean alone.
- Tornado decomposition of 5-year variable margin that identified degradation rate, gas price and cycling intensity as the three terms worth modelling explicitly.
- Capex prioritisation under the simulated ambient distribution that re-priced the inlet-air chiller's payback from 6.2 to 4.1 years.
The plant's heat rate is not a curve; it is a distribution of curves, and only one of them is the deterministic projection. Monte Carlo simulation in ModelRisk is what lets the asset team plan the overhaul against the full forecast band rather than against its median.