

Industry: Energy
Product: ModelRisk
Application: Power trading desk P&L and VaR
What the VaR Number Hides: Sizing a Power Trading Book in ModelRisk
A prop desk trading PJM West, ERCOT-North and MISO-Indiana day-ahead and balance-of-month products runs an aggregate position limit of 1,200 MW long-or-short and a regulatory VaR cap of $4.5M at 95% over a 1-day horizon. The internal VaR engine, built on a historical-simulation window of 250 trading days, prints 95% VaR at $3.7M and gives the desk green light. The first time the desk hit a true 4-sigma summer event, realised one-day P&L was -$17.2M — far beyond the supposed tail. Historical simulation, calibrated to a mild prior year, had not seen what the power market can do, and the trading committee asked for a fully probabilistic re-build.
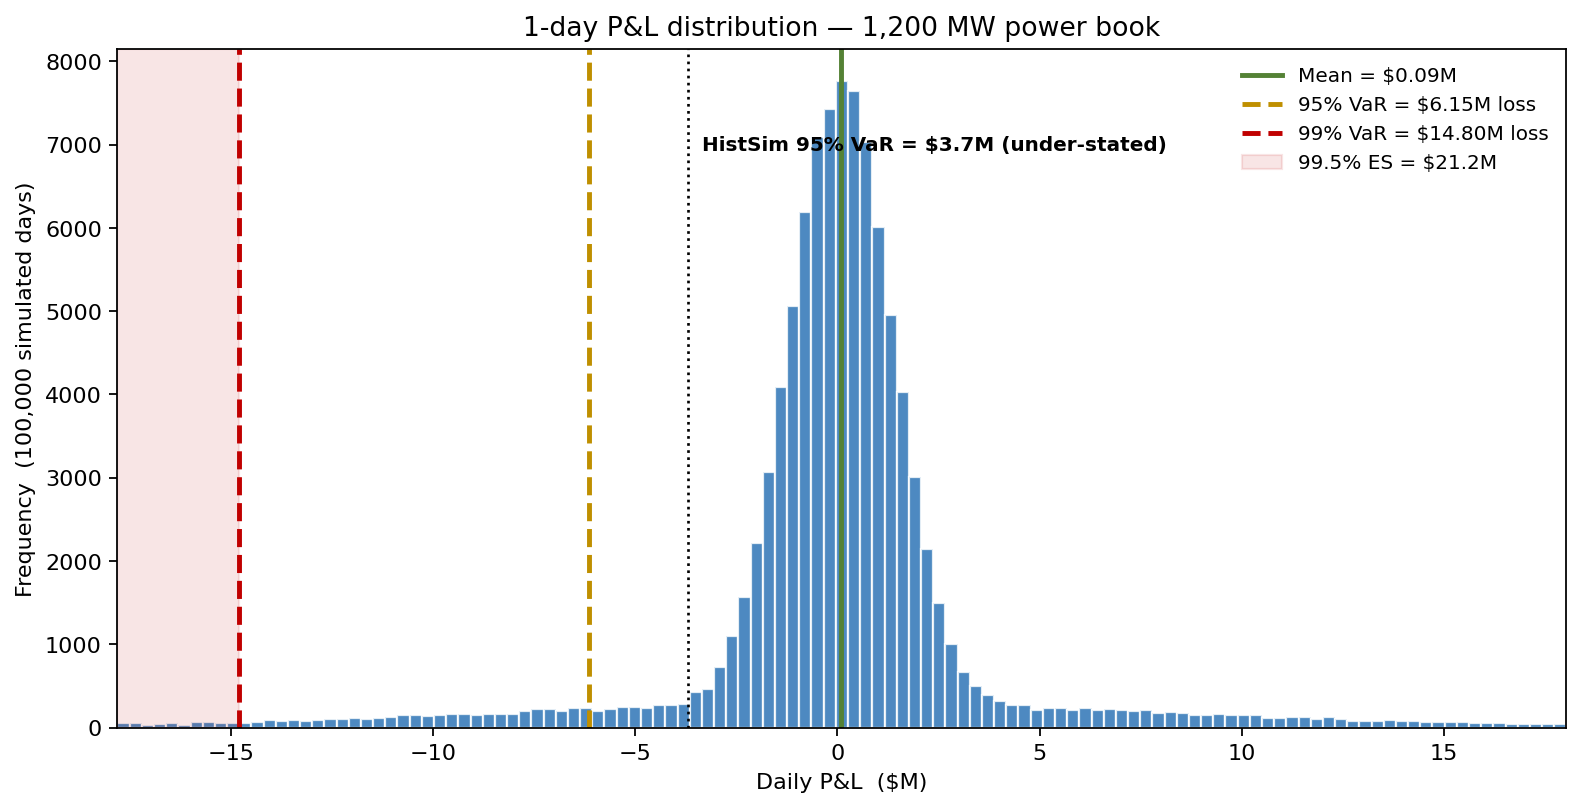
The rebuilt Monte Carlo engine, run on the same 1,200 MW book, tells a starkly different story: the 99% one-day VaR is $14.8M, four times the historical-simulation figure the desk had been planning against.
Why historical simulation fails on power
Power is the most poorly behaved liquid commodity traded. Three properties break standard market-risk machinery:
- Hourly returns are not stationary. Heat-rate spreads under summer load look nothing like winter shoulder-month returns. A trailing-250-day window contains 80% irrelevant observations.
- The distribution has two tails of different shapes. Negative-price events (oversupply, congestion, fuel must-run) and scarcity-price spikes ($5,000/MWh cap) have different physical drivers and need different parametric treatment.
- Hub-to-hub correlations spike during stress. PJM West and MISO-Indiana correlate at ρ = 0.42 in a normal week and ρ = 0.86 during a heat wave. A Gaussian VaR engine that uses the average correlation under-prices regional stress.
The rebuild
The desk's P&L was decomposed into 14 positions across 3 hubs × 4 products (DA energy, BoM energy, heat-rate spread, congestion FTR). Each was modelled as a stochastic price path:
- DA LMP at each hub: AR(1) in log price with regime-switching volatility — low-vol regime σ = $4.50/MWh, high-vol regime σ = $32/MWh, transition probability calibrated from a hidden Markov model on 7 years of clearing data.
- Scarcity spikes as a separate compound Poisson with rate λ that itself depends on day-ahead reserve margin (low margin → λ up to 8 events/day across hubs); severity drawn from a Generalized Pareto above the $250/MWh threshold (ξ = 0.38).
- Negative-price events modelled as a mixture Bernoulli + truncated Normal with mean -$28/MWh, fitted to ERCOT-West data.
- Inter-hub dependence via a t-copula (ν = 4.5) on the residuals, so tail co-movement is preserved.
What the new model said
Under the same desk position the historical engine had scored at 95% VaR $3.7M, the new probabilistic engine printed 95% VaR $6.2M and 99% VaR $14.8M — with a 99.5% ES (the average loss in the worst 0.5% of days) of $21.2M. The historical VaR was understating tail loss by a factor of 4. The size of the trading book had to come down by a third to bring the new 99% VaR back inside the $4.5M limit.
What actually drives the tail
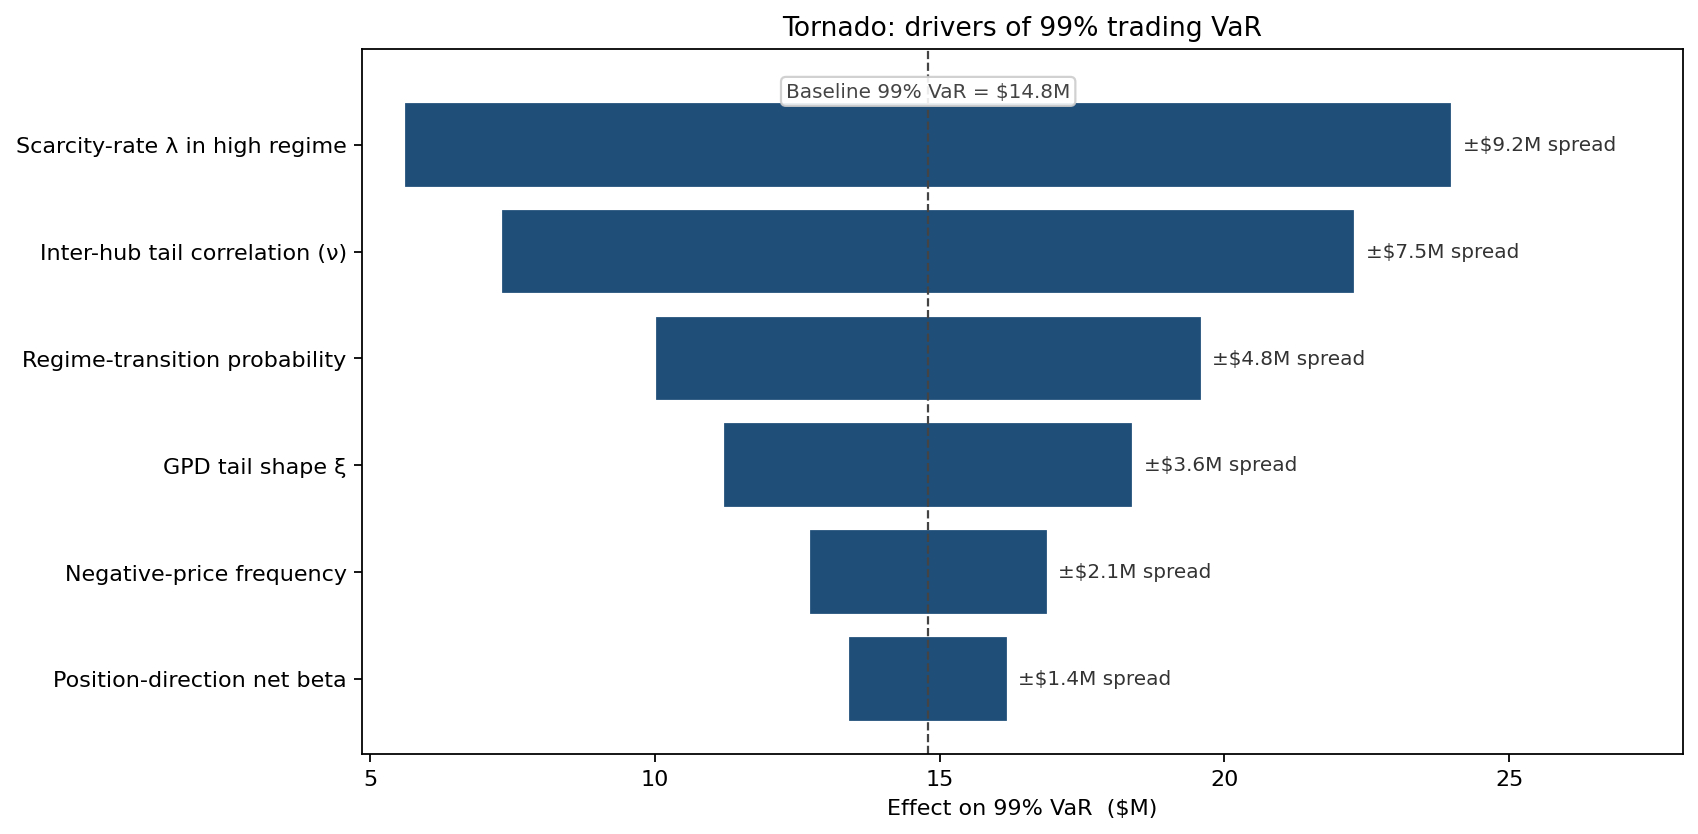
The scarcity-rate parameter and the inter-hub tail-correlation dominate. Both are exactly the terms the historical-simulation engine had been silently averaging away.
Stress scenarios
Three stress paths were run alongside the base distribution: a summer heat wave (90th-percentile load, 75th-percentile gas, scarcity hours ×3), a winter freeze (low gas plus generator forced-outage), and an oversupply weekend (negative-price probability ×4).
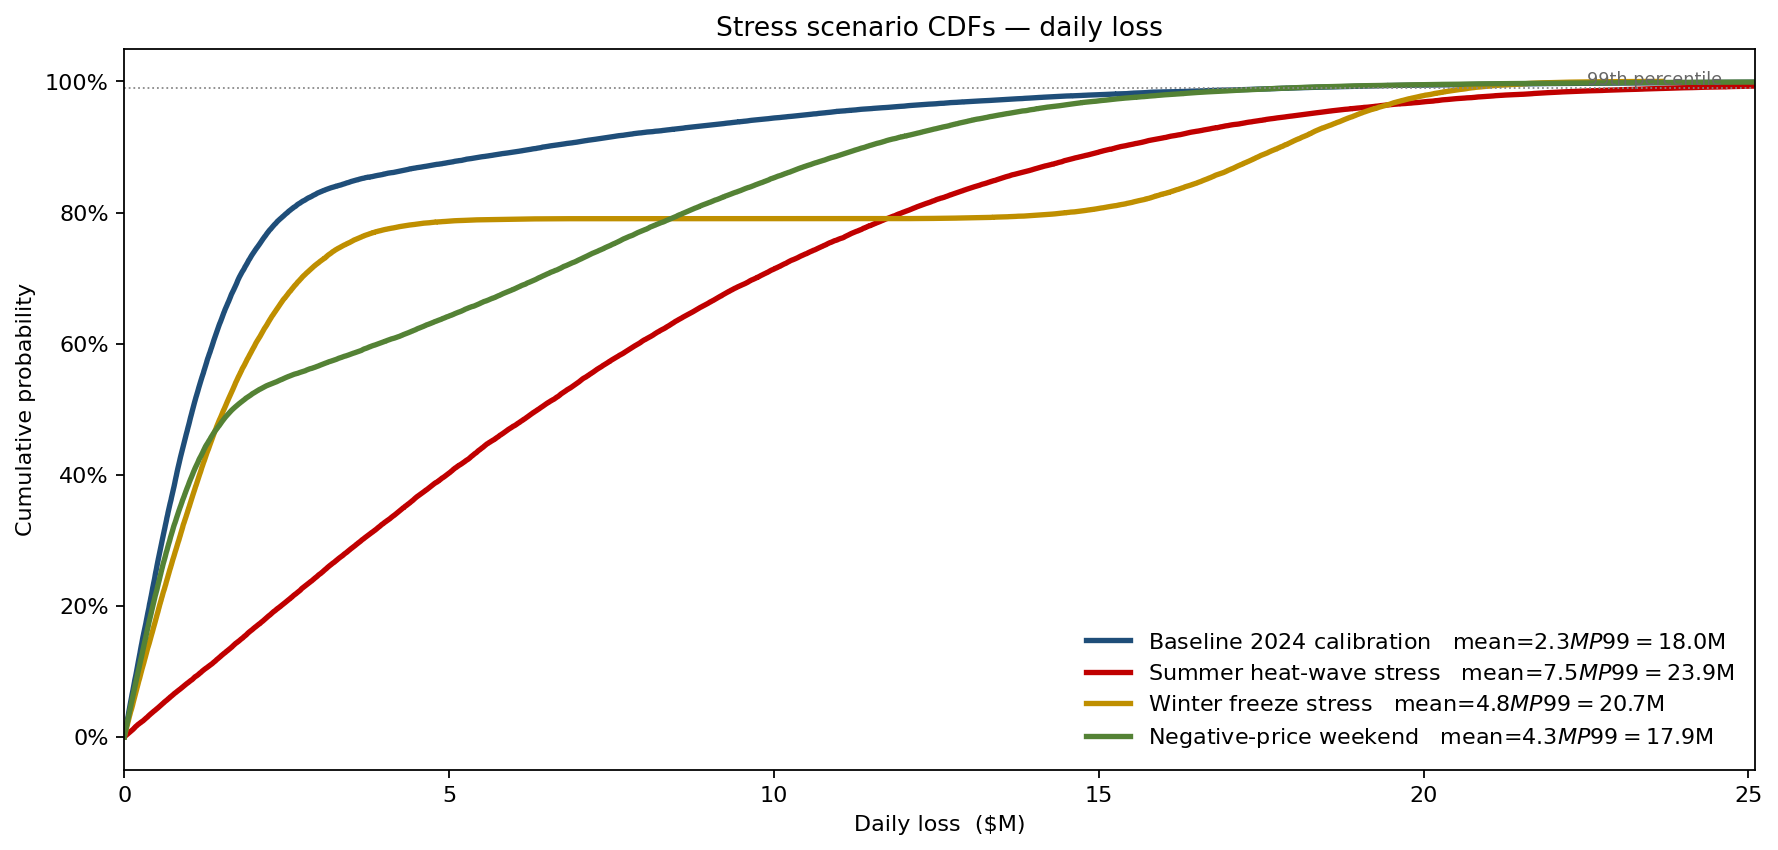
The 99th-percentile loss under the summer heat wave is $23.9M — within tolerance for the desk's reduced book but ruinous at the prior book size. The freeze scenario is bimodal (huge winners on long positions, huge losers on shorts), reinforcing the value of position-direction-aware limits rather than gross-MW limits alone.
What changed
- Aggregate position limit reduced from 1,200 MW to 800 MW to keep 99% VaR inside the $4.5M cap under the new engine; the desk reclaimed margin by tightening intra-day risk controls rather than gross MW.
- Limits framework upgraded from "MW" to (MW, hub-correlation-bucket, scarcity-regime). The same MW carries 2.3x the risk in a high-regime regional cluster.
- Daily VaR reported with the GPD-tail decomposition so the committee sees scarcity contribution explicitly — historically buried inside a single VaR number.
- Two cross-hub spread trades killed that had appeared profitable on history but priced as negative-expected-PnL under the t-copula tail (the spread's downside is realised exactly when both legs co-spike).
ModelRisk Functionality Used
- Regime-switching AR(1) in log-price for hub DA LMP, with hidden-Markov-calibrated transition probabilities — replaces a stationary-volatility assumption that under-prices summer.
- Compound-Poisson scarcity with rate dependent on reserve margin and GPD severity above the $250/MWh threshold — explicitly separated from the price-process body.
- t-copula (ν = 4.5) on hub residuals — preserves the 0.42→0.86 correlation increase during stress that a Gaussian engine averages away.
- Stress-overlay scenarios rerun on the same simulation engine (heat wave, freeze, oversupply) producing CDF comparisons rather than single point shocks.
- Tornado decomposition of 99% VaR identifying scarcity-rate and tail-correlation as the dominant terms, directing the next dollar of modelling investment.
- Tail-decomposed VaR reporting for the trading committee, with scarcity contribution called out separately rather than averaged into a single number.
The historical-simulation VaR is what the regulator accepts and the desk plans on; the simulated VaR is what the market actually charges. Monte Carlo simulation in ModelRisk closes that gap before the market does it for you.