

Industry: Energy
Product: ModelRisk
Application: Transmission and Distribution Capacity Planning
When to Defer the $480M Substation: T&D Capacity Planning Under Stochastic DER Penetration
A utility planning a new 230/69 kV substation and feeder rebuild faces a 7-year construction lead time and a $480M capital commitment that has to be approved before anyone really knows what the load will look like in 2032. The deterministic load forecast says peak demand grows 1.6%/yr and the substation is needed by 2031. The Monte Carlo simulation, with stochastic load growth, EV adoption, and behind-the-meter solar penetration, says there is a 47% probability the substation can be deferred by at least three years through a non-wires alternative — and a 9% probability the existing capacity is already adequate through 2035.
A regional electric utility serving 1.4 million customers used ModelRisk to evaluate whether to commit to the substation now or run a $62M non-wires alternative (NWA) programme — distributed solar plus battery, plus targeted DR — and revisit the substation decision after three years of observed load. The simulation's first output was the 2032 peak-demand distribution, set against the existing substation's firm capacity.
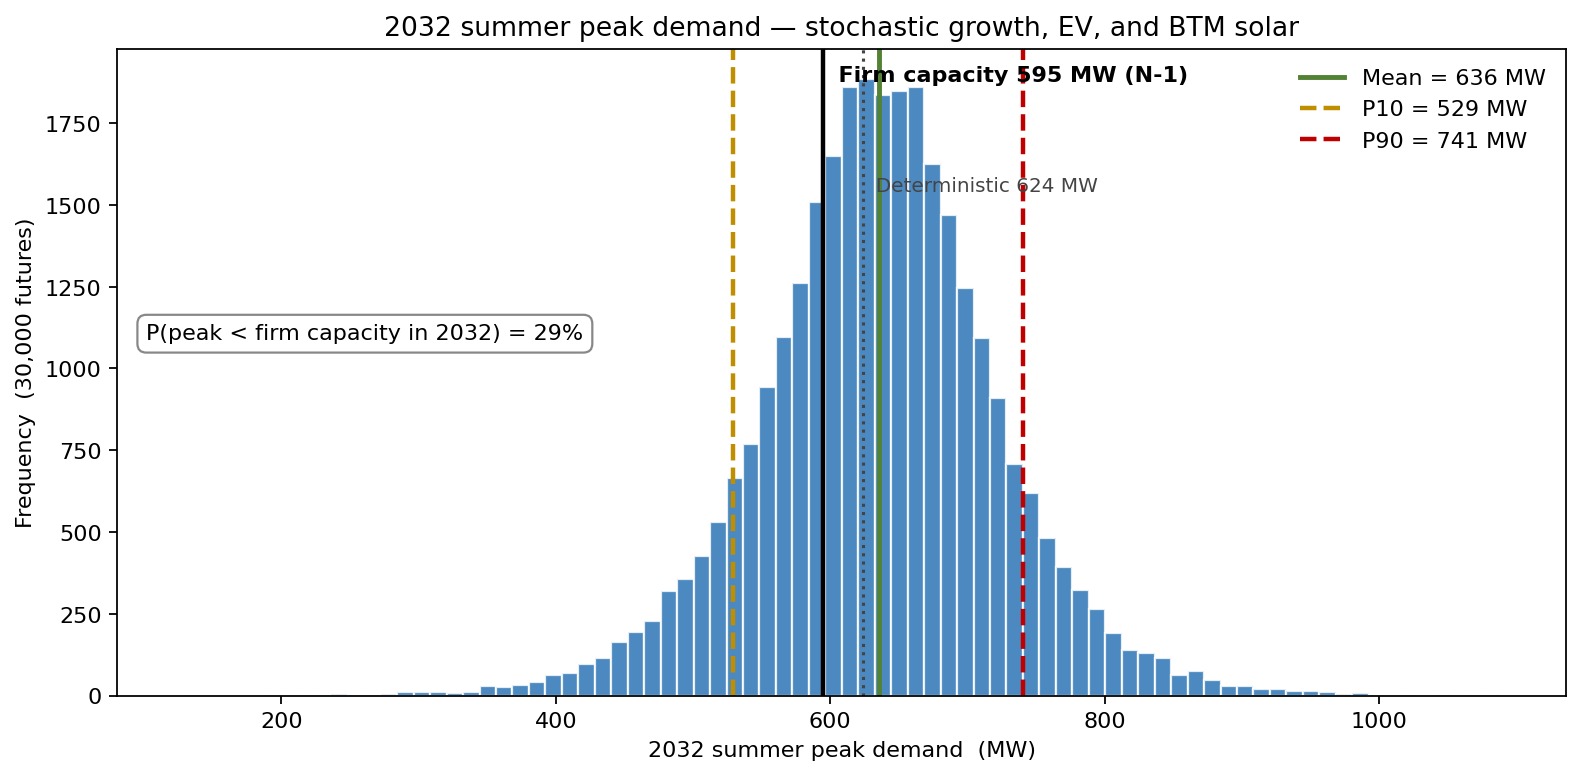
The simulated 2032 peak has a mean of 636 MW with P10 = 529 MW and P90 = 741 MW, against the existing substation's firm capacity of 595 MW (N-1). The deterministic forecast of 624 MW lands inside that band — but the simulation shows a 29% probability the 2032 peak is below firm capacity, which is exactly the slack a deferral strategy is built to exploit.
Peak demand as a function of weather, growth, and what's behind the meter
The substation is sized to serve the summer peak hour, not the average. Three correlated drivers move that peak:
- Underlying load growth: Normal-distributed annual growth rate, mean 1.6%, σ 0.8%, with autocorrelation ρ = 0.4 (a cool year is followed by another cool year more often than not). Over the 12-year planning horizon this produces a P10 of +13% cumulative growth and a P90 of +32%, against the deterministic +21%.
- EV adoption: a Bass-style diffusion curve where the ceiling (long-run EV share of light-duty fleet in service territory) is drawn from a Beta(3, 4) scaled to [10%, 65%], and the diffusion coefficient p is LogNormal-distributed. The peak-hour load adder from EV charging is modelled per-vehicle as 2.1 kW average coincident demand, scaled by the simulated fleet count.
- Behind-the-meter solar: stochastic adoption with Beta(2.5, 6) scaled to [4%, 32%] of single-family households by 2035. BTM solar reduces the daytime peak hour but adds to the evening ramp — the model tracks both. Coincidence factor for solar at the system peak hour is drawn from Beta(2, 8) with mean 0.20 (most peaks happen around 5–7 pm in this territory, when solar output is dropping).
Combining these three drivers, the 2032 summer peak distribution shown above has a mean peak of 636 MW with P10 = 529 MW and P90 = 741 MW. The existing substation has a firm capacity of 595 MW (N-1 contingency). The deterministic 2032 forecast of 624 MW says capacity is needed in 2031. The simulation says there is a 29% probability peak is below 595 MW in 2032 — and a 9% probability of being below 595 MW even by 2035.
Why the NWA's value lives in the deferral option
The NWA programme is engineered to shave 35–55 MW of summer peak (50 MW expected) through 30 MW of battery storage, 12 MW of utility-controlled DERs, and a 13 MW DR programme. On a static comparison the NWA loses: $62M for 50 MW of capacity that the substation would provide for $9.6M/MW. But the NWA produces a 3-to-5-year deferral option on the substation, and that option is what creates value when the peak distribution is wide:
\[ \text{NPV}_{\text{defer}} = \text{Capex}_{\text{sub}} \cdot \left[ \frac{1}{(1+r)^{T_{\text{base}}}} - \frac{1}{(1+r)^{T_{\text{deferred}}}} \right] - \text{Capex}_{\text{NWA}} \]
with each path's deferral year endogenously determined by when load + NWA shaving exceeds firm capacity.
The simulation reports mean deferral of 2.7 years, with a distribution: P10 deferral = 1 year, P50 = 2 years, P90 = 5 years (substation never needed within the planning horizon in roughly 9% of paths).
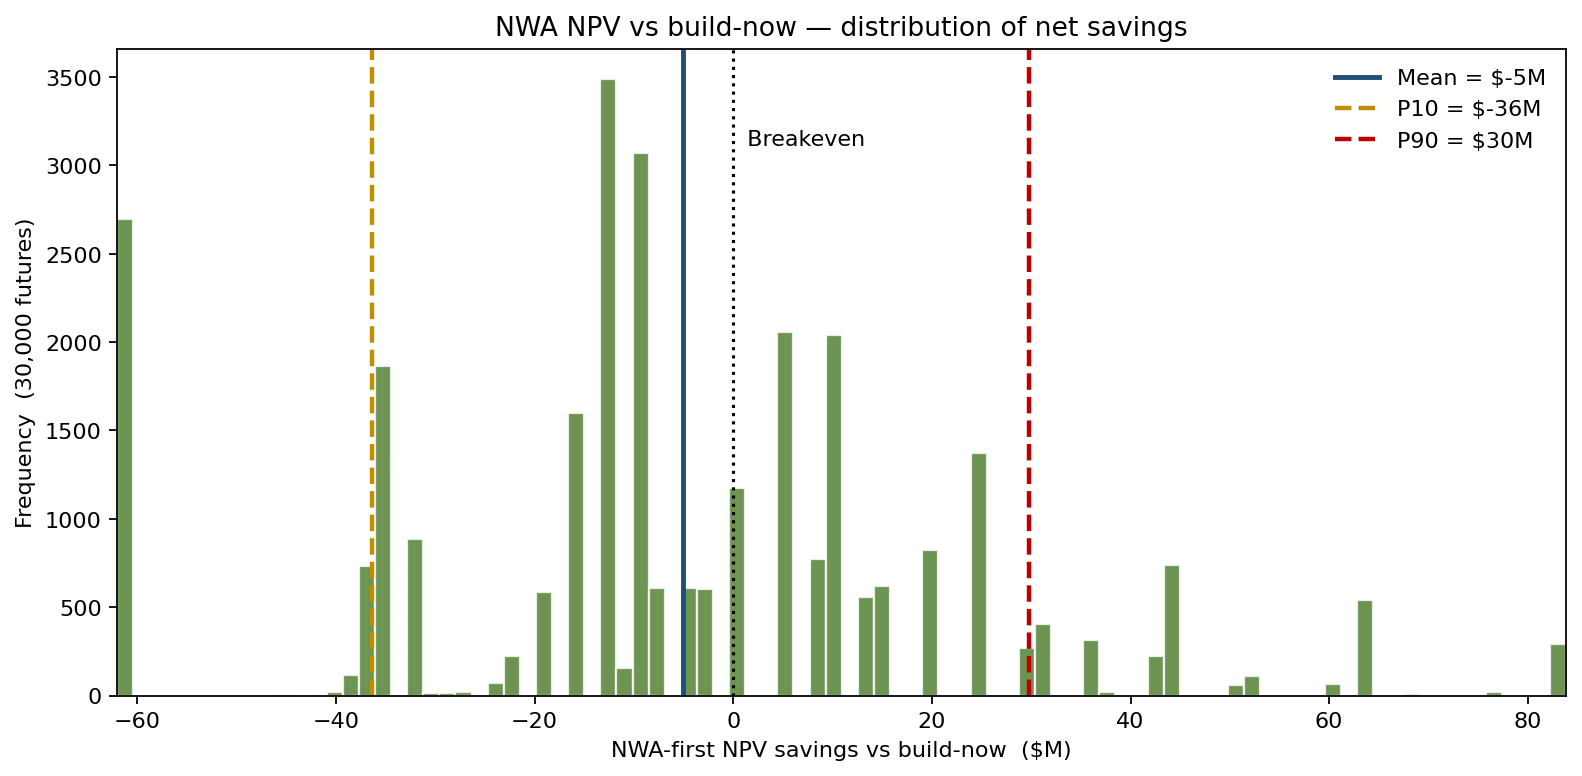
The NWA-first strategy produces mean NPV savings of -$5M, P10 of -$36M, and P90 of $30M — close to breakeven on the mean, with a 42% probability of a positive payoff. The value here is not in the expected number but in the option: the negative tail is the futures in which load grows fast and the NWA simply postpones an inevitable build; the upside is the futures in which BTM solar adoption and slow load growth render the substation unnecessary on the planning horizon. The deferral option is worth funding precisely because the peak distribution is wide enough to put real probability mass on both outcomes.
What actually drives the deferral
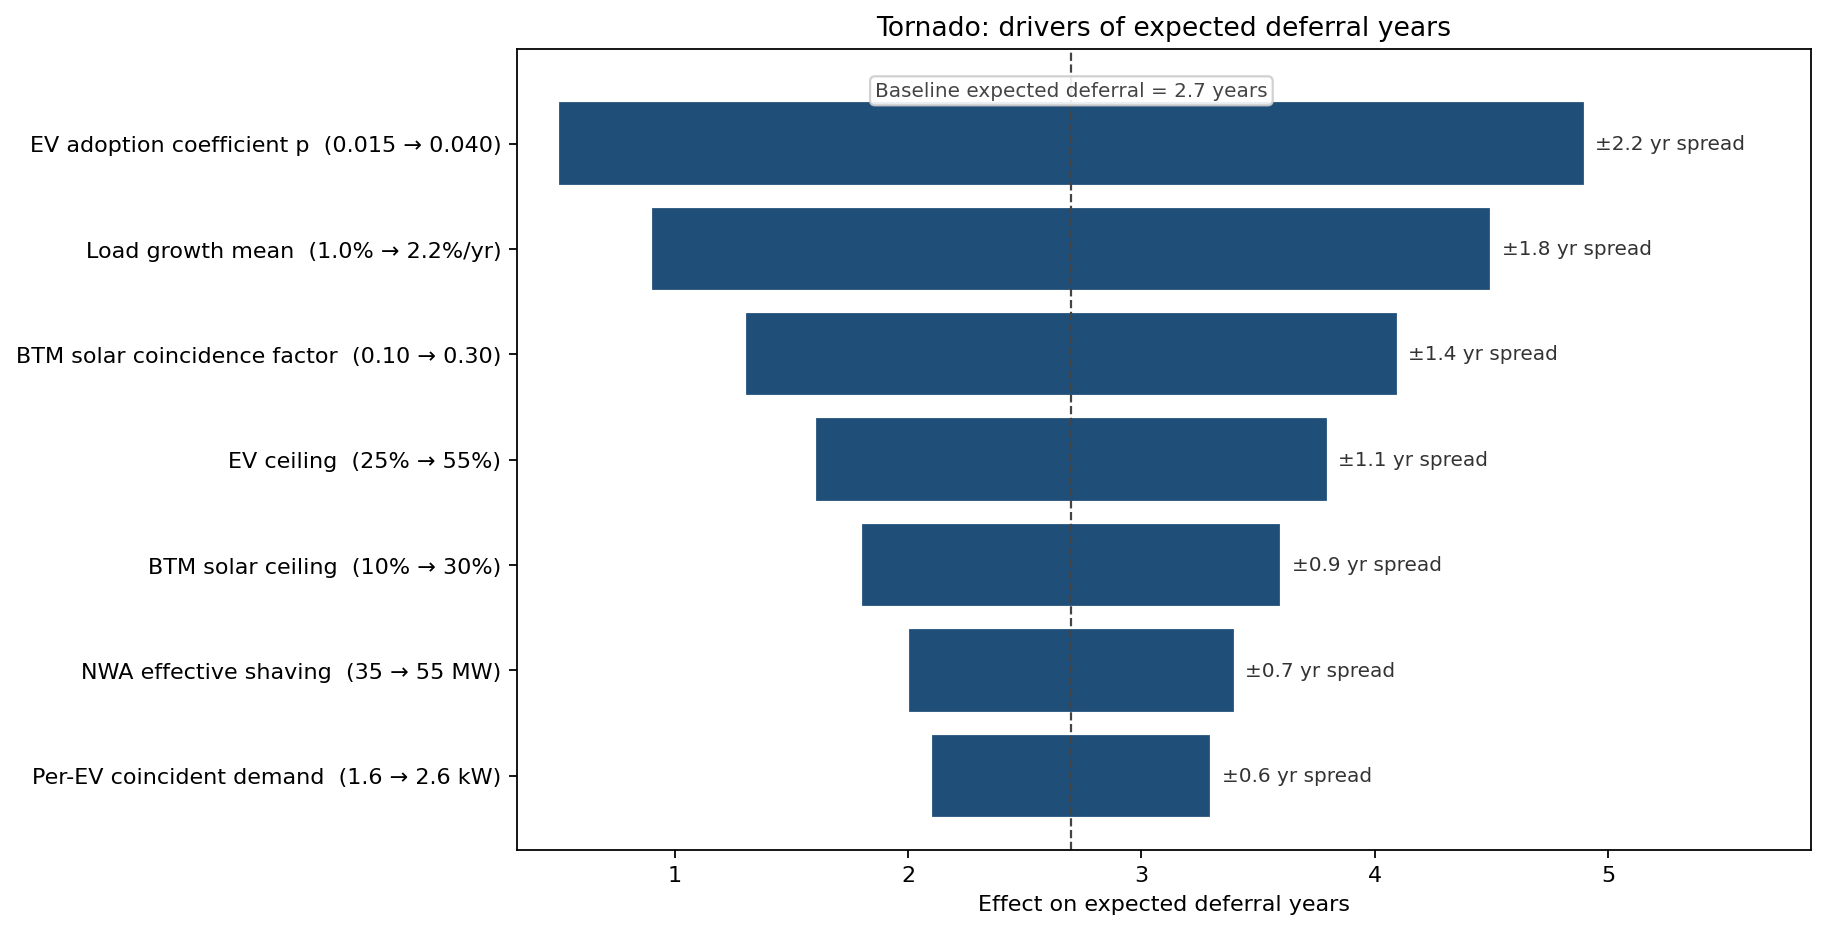
EV adoption coefficient and load-growth mean dominate; the BTM solar coincidence factor — the parameter most often modelled as a fixed 0.2 in deterministic forecasts — is in the top three. A 0.10 → 0.30 swing in solar coincidence shifts expected deferral by 1.4 years and the NWA NPV by $19M. The model also showed that adding 12 MW of additional DR capacity to the NWA programme is worth roughly $11M of expected NPV per MW in deferral value, dominating any other DER addition on a $/MW basis.
What changed
- Substation decision deferred to 2027 reassessment, with the NWA programme funded now at $62M.
- Connection queue restructured to require BTM solar inverters with smart-export profiles, so the simulation's 0.20 mean coincidence factor can be actively managed downward over time.
- Capital plan reports stochastic in-service dates for the substation under three scenarios (P10, P50, P90 deferral), not a single 2031 commitment.
- DR programme expanded by 6 MW based on the marginal $11M/MW deferral value the model identified — the cheapest reliable deferral lever in the portfolio.
ModelRisk Functionality Used
- Bass diffusion curve with stochastic ceiling and diffusion parameter for EV and BTM-solar adoption — calibrated to PG&E and SCE historical adoption rather than a single national projection.
- Beta-distributed coincidence factors for both EV charging and BTM solar at the system peak hour, which a fixed deterministic 0.2 misrepresents on both tails.
- Real-options NPV calculation with the deferral year endogenously determined per-path, not assumed.
- Tornado on expected deferral years, exposing the BTM solar coincidence factor as a top-three driver — the metric the planning team was previously treating as a constant.
- Custom Excel logic linking the firm capacity (N-1 contingency), the NWA shaving curve, and the load forecast into a per-path build trigger.
In T&D capacity planning, the most valuable question is not "when do we need the substation?" but "what is the probability we can defer it, and what does each year of deferral save?" Monte Carlo converts a single in-service date into a distribution, and the distribution is what makes the non-wires investment quantifiable.