

Industry: Energy
Product: ModelRisk
Application: Energy Arbitrage
Battery Arbitrage in a Day-Ahead Market: The Difference Between Expected NPV and the IRR Distribution
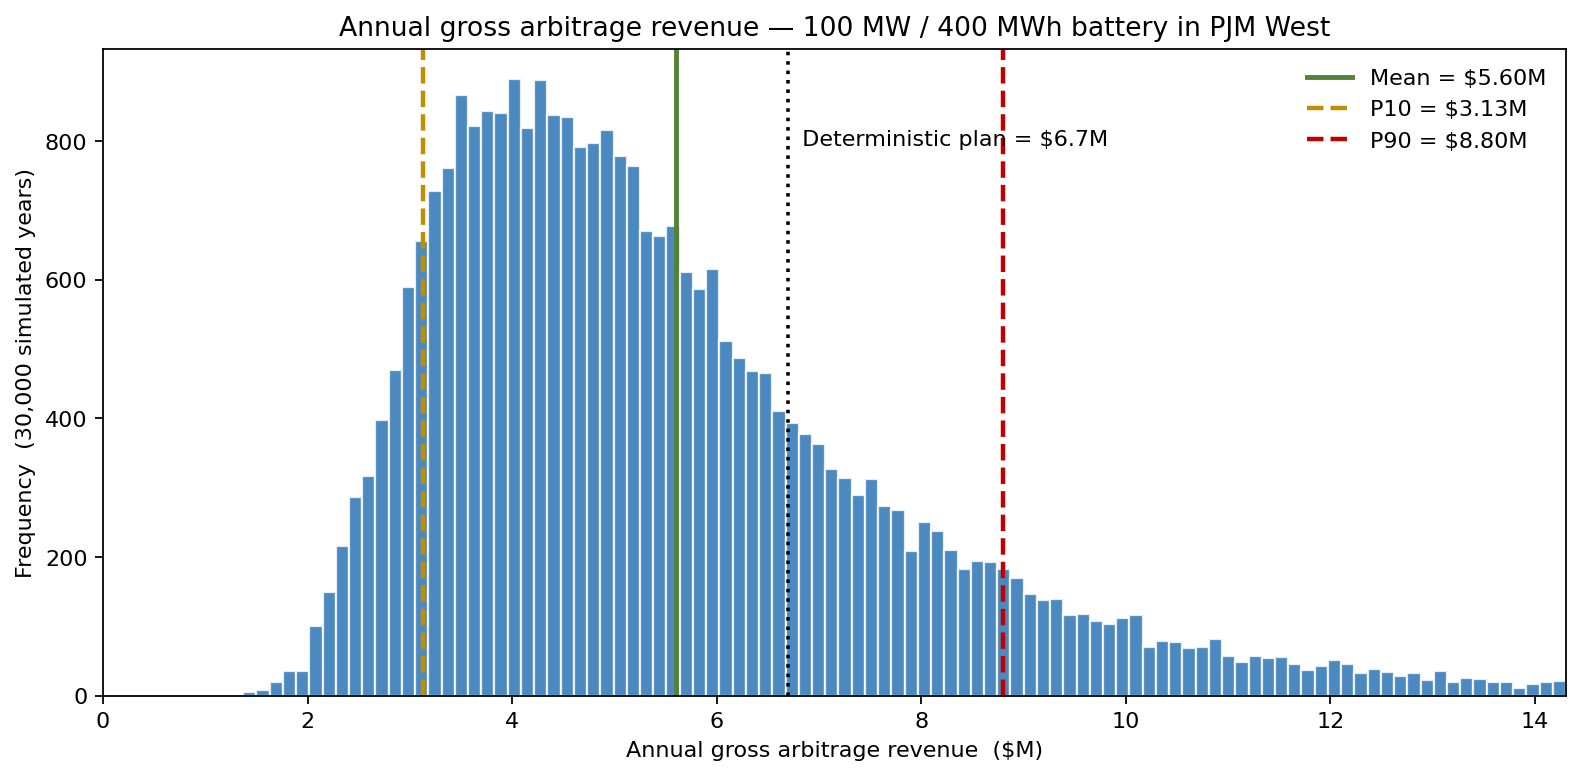
A 100 MW / 400 MWh lithium-ion battery in PJM's western hub can clear $80–110/MWh on a quiet July afternoon and $-30 to $5,000/MWh during a polar-vortex event. The deterministic pro forma multiplies an "average spread" of $42/MWh by 365 cycles a year and reports an annual gross revenue of $6.7M. The Monte Carlo model on the same project says that figure is optimistic: the mean annual revenue is $5.6M, the P10 is $3.1M, and the P90 is $8.8M — a right-skewed distribution in which the deterministic plan sits at the 75th percentile.
A merchant storage developer evaluating a battery investment in PJM rebuilt the revenue model in ModelRisk to capture three things the deterministic spreadsheet misses: stochastic intra-day LMP shape, spike events that drive most of the arbitrage P&L, and dispatch-rule realism (you cannot always cycle once a day at the perfect hours). The headline output is the annual-revenue distribution below.
LMP modelled as base + spikes, not as a Normal
Hourly day-ahead LMPs at PJM West average $48/MWh with a base-load standard deviation around $16. The standard mistake is to model the whole hourly series as Normal — which prices the diurnal shape correctly but misses the price spikes that generate roughly 40% of an arbitrage book's annual revenue. Spikes are sparse, fat-tailed, and clustered in heat events and cold snaps.
The model splits the LMP into two components:
\[ \text{LMP}_h = \text{Base}_h + \mathbb{1}{S_h} \cdot \text{SpikeMag}_h \]
- Base hourly LMP: log-normal around an hour-of-day shape, mean $48/MWh, σ_log = 0.30, with AR(1) persistence ρ = 0.78 within a day to honour the autocorrelation.
- Spike events: Bernoulli per hour with intensity 0.6%/hour (≈ 52 hours/year), with spike magnitude drawn from a Generalized Pareto with shape ξ = 0.45, scale $180, threshold $150 — so the 99th-percentile hour can clear above $1,200/MWh and the worst hour of the year can exceed $4,000.
A Normal-only model assigns essentially zero probability to a $1,500/MWh hour. In the GPD-augmented model those hours show up roughly 40 times a year, and the arbitrage P&L conditional on capturing one is enormous — which is why dispatch policy matters.
A dispatch rule that respects state-of-charge and degradation
A battery cannot always discharge at the peak hour: it has to be charged first, the round-trip efficiency is 86%, and every full cycle costs roughly $4/MWh in calendar-and-cycle degradation amortised against the warranty curve. The dispatch model is a one-day look-ahead heuristic with a state-of-charge constraint:
\[ \text{Cycle}_d = \arg\max_{(h_c, h_d)} \bigl[ \text{LMP}_{h_d} - \text{LMP}_{h_c} / \eta_{\text{rt}} - c_{\text{deg}} \bigr] \]
with one charge–discharge cycle per day, round-trip efficiency \(\eta_{\text{rt}} = 0.86\), and degradation cost \(c_{\text{deg}} = \$4/\text{MWh}\). When the spread does not clear the threshold the battery idles. Over a 15-year life the mean captured spread is $38.5/MWh, not the $42 the deterministic plan used — because the dispatch heuristic misses some perfect-hindsight opportunities.
As the opening chart shows, the annual revenue distribution is right-skewed: the mean is $5.6M with P10 = $3.1M and P90 = $8.8M, and the worst 5% of years (cold winter + low summer volatility) come in below $2.8M. The deterministic spreadsheet's $6.7M sits at the 75th percentile.
IRR is a distribution, not a number
Discounting 15 years of stochastic gross margin minus opex against the $40M all-in capex, with a 7% cost of capital and a stochastic warranty-call risk:
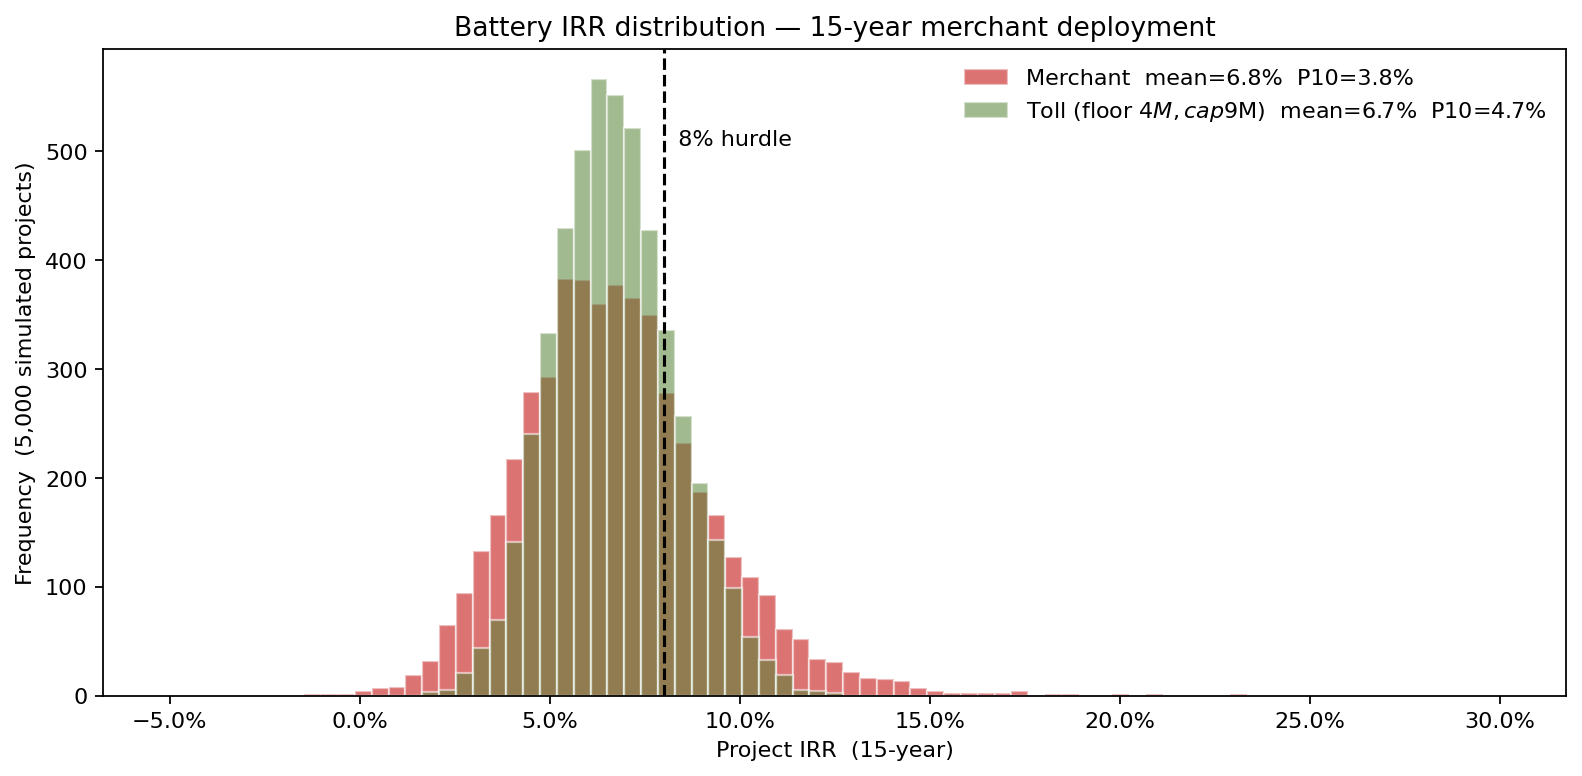
The merchant IRR distribution has a mean of 6.8%, a P10 of 3.8%, and a P90 of 10.0% — and the financiers' 8% hurdle is missed in 73% of futures, a number a single deterministic point can never convey. The negotiation moved to a floor contract: a tolling structure that pays the battery a floor of $4.0M/yr in exchange for capping the upside above $9M. The toll compresses the IRR band to P10 = 4.7%, mean = 6.7%, P90 = 8.8% — a much narrower distribution, but one that raises P(IRR < 8%) to 79%, because clipping the upside removes exactly the high-revenue years that would have cleared the hurdle. The simulation's blunt message: at this revenue level the toll buys the lender certainty, not a higher pass rate — the only real levers on hurdle-miss probability are build cost and spike capture.
What drives the spread
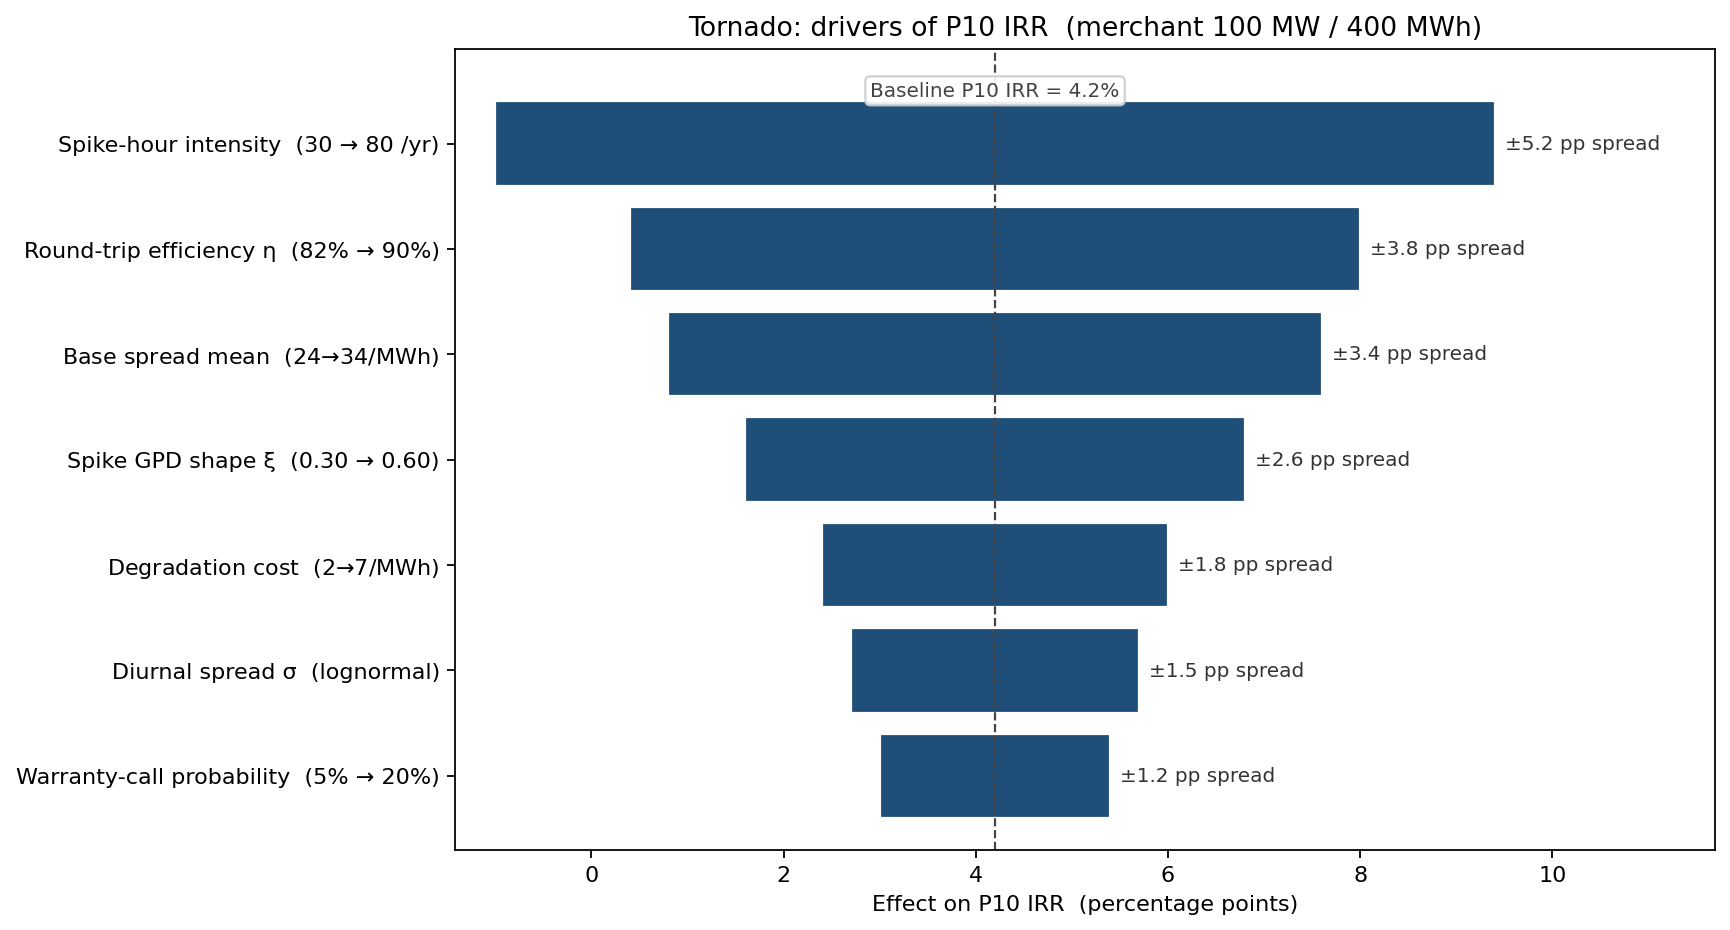
P10 IRR — the lender's risk number — is most sensitive to spike-hour intensity and round-trip efficiency. A Normal-only LMP model would have ranked diurnal-spread σ on top, missing the spike economics entirely.
What changed
- Capital structure switched to a partial tolling agreement that trades expected upside for a much narrower IRR band (P10–P90 of 4.7%–8.8% versus the merchant 3.8%–10.0%), giving the lender a tighter worst case even though it does not raise the hurdle-pass rate.
- Battery sized 100 MW / 400 MWh, not 100 MW / 200 MWh: the 4-hour duration captures more of the spike-hour stacks; the 2-hour configuration's IRR distribution had a P10 below the hurdle in 51% of futures.
- Operating budget treats degradation as a stochastic cost with a 12% probability of an early warranty call, rather than a fixed line.
- Dispatch heuristic re-tuned with one charge per day except in extreme-spike weeks, where the model allowed up to 1.4 cycles — a 6% revenue uplift that justified the warranty trade-off.
ModelRisk Functionality Used
- AR(1) base-LMP simulation with a calibrated diurnal shape and lognormal innovations, generating 100,000 hourly profiles across a year.
- Peaks-over-threshold spike model (Bernoulli intensity + Generalized Pareto magnitudes) layered on the base — the construction that is standard in extreme value statistics and that a Normal LMP model cannot reproduce.
- Custom dispatch heuristic in Excel evaluated per day, per simulated year, against the state-of-charge constraint and the degradation cost.
- Tornado on P10 IRR rather than expected IRR — the project finance threshold is on the lower tail, not the mean.
- Scenario CDF overlaying merchant, partial-toll, and full-toll capital structures on the same 100,000-path sample.
In merchant battery economics, the spike hours pay the IRR. A model that draws LMP from a Normal distribution writes those hours out of the simulation, prices the project on the diurnal spread alone, and gets the lender's question — "what is the probability the project misses the hurdle?" — exactly wrong.