

Industry: Energy
Product: ModelRisk
Application: Carbon Trading
Pricing EU ETS Allowances When the Market Stability Reserve Can Move the Forward Curve
EU Allowance (EUA) prices ran from €8/tCO2 in 2017 to a high above €100 in 2023, and a single Market Stability Reserve (MSR) announcement can move the front December contract €15 in a session. For a utility short 12 million tonnes of compliance allowances over the 2025–2030 phase, that volatility translates directly into balance-sheet risk — and the standard mean-reverting models that worked on EUA prices before the 2018 reform now systematically understate the upward drift and the policy-shock tail.
A continental European utility with a 12 Mt/yr compliance obligation and a small proprietary trading book rebuilt its EUA exposure model in ModelRisk. The brief was specific: stop pretending the price is mean-reverting around a long-term equilibrium, model the policy-jump tail explicitly, and quantify the hedge ratio that minimises 95th-percentile compliance cost — not expected cost. The first thing the rebuilt model produced was the picture below — the 5-year-ahead EUA price as a distribution, not the single forward point the desk had been pricing against.
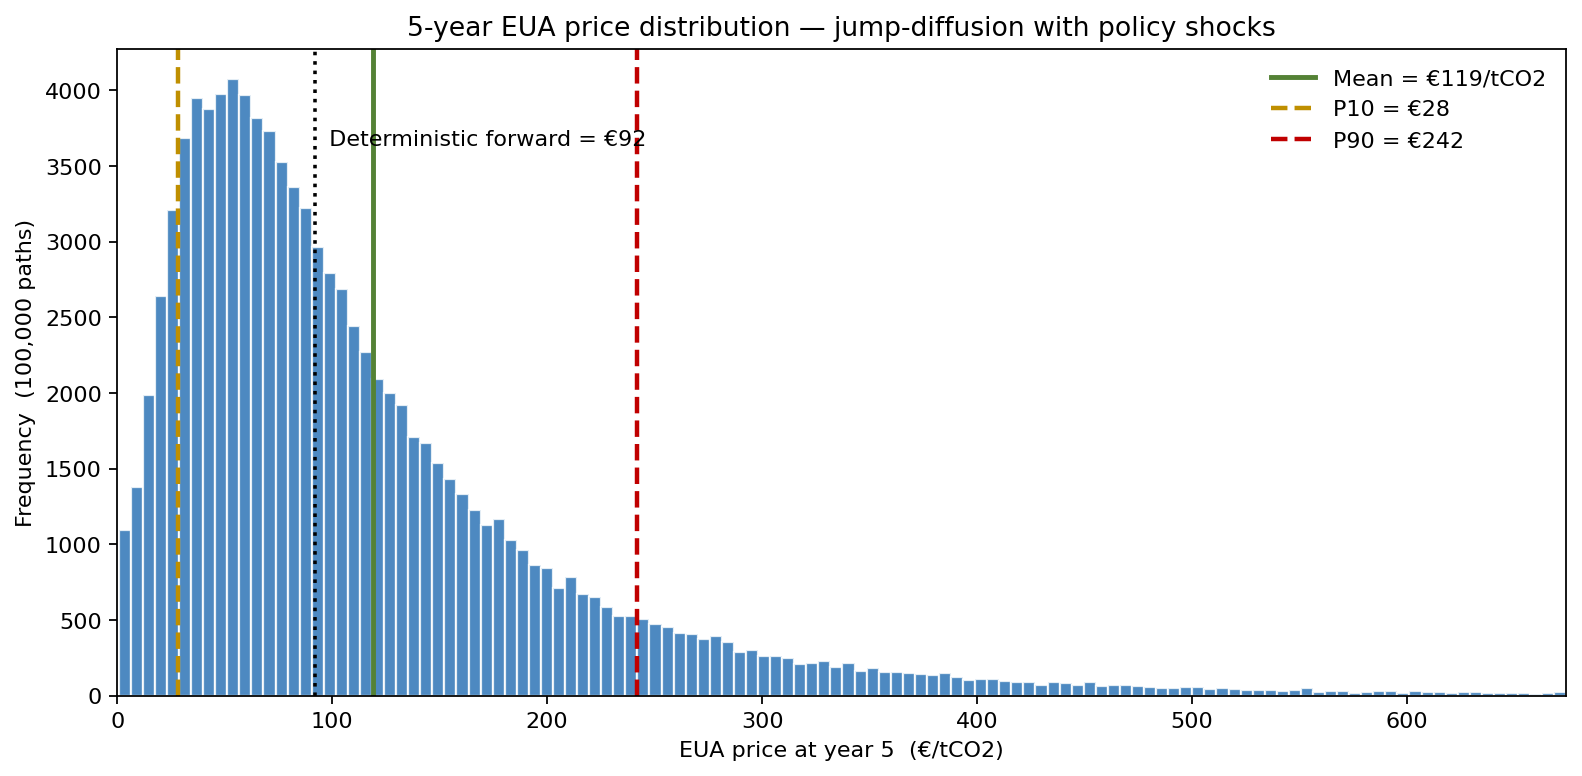
The deterministic forward curve put the 5-year price at a single €92/tCO2. The jump-diffusion simulation, starting from €72/tCO2, produced a mean of €119 with P10 = €28 and P90 = €242 — a spread of nearly 9× across the central 80% of outcomes, with the policy-jump tail dragging the mean well above the median of €88. That asymmetry is the whole story, and it is invisible to a single forward point.
Why mean-reversion is the wrong process for post-2018 EUA
A textbook Ornstein–Uhlenbeck process pulls prices back to a long-term mean μ. Fit one to EUA prices from 2013–2017 and it works; fit one to 2018–2024 and the residuals are systematically negative — the process underestimates the realised price level every single year because the equilibrium is itself rising. The MSR mechanically withdraws surplus allowances when the total number in circulation exceeds 833 Mt, and the 2023 Fit-for-55 package lowered the cap trajectory by 4.3% per year out to 2030. Neither feature looks like reversion to a static mean.
The model replaces OU with a jump-diffusion process with positive drift:
\[ dP_t = \mu P_t \, dt + \sigma P_t \, dW_t + J_t \, dN_t \]
where \(\mu = 4.5\%/\text{yr}\) reflects the trajectory of the linear reduction factor, \(\sigma = 38\%\) is the calibrated diffusion volatility, \(N_t\) is a Poisson process with intensity \(\lambda_J = 0.6\) jumps/year, and the jump size \(J_t\) is drawn from a mixture: 70% positive (mean +€18, std €9) for tightening announcements, 30% negative (mean −€12, std €6) for delays or carve-outs. The mixture is calibrated to the 18 policy-driven moves above €8 between 2018 and 2024.
As the distribution above shows, the starting price was €72/tCO2 and the 5-year-ahead simulation produced a mean of €119 with P10 = €28 and P90 = €242 — the wide, right-skewed range the deterministic forward curve hid behind a single point of €92.
What MSR uncertainty does to the compliance bill
The compliance obligation is 12 Mt per year for six years = 72 Mt. The deterministic answer multiplies 72 Mt by the forward of €92 = €6.6 billion. The simulation aggregates over a stochastic price path and reports a mean compliance cost of €8.1 billion, a P95 of €22.0 billion, and a P99 of €37.7 billion. The deterministic number sits at the 55th percentile of the simulated distribution — there is roughly a 45% probability the bill exceeds €6.6 billion and a 26% probability it exceeds €10 billion.
What actually drives the tail
The drivers of P95 compliance cost are not what intuition suggests. Calibrating the jump intensity and the upward-jump fraction matters far more than the diffusion volatility, because the right tail is built almost entirely from compounding upward policy jumps.
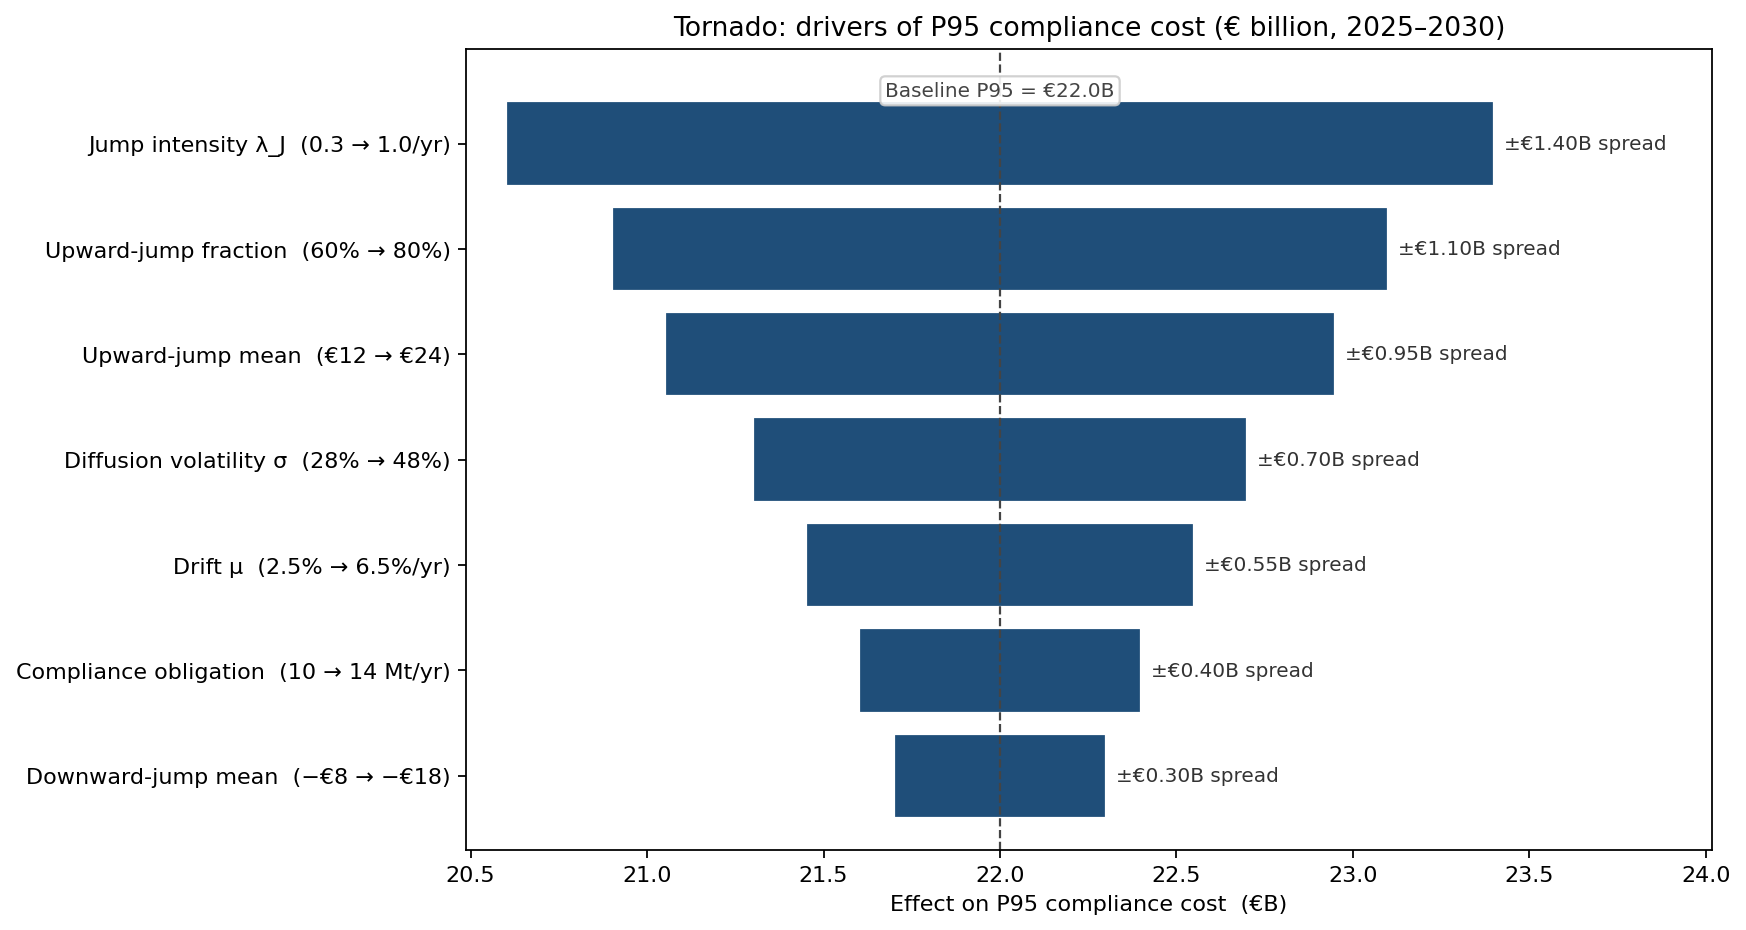
Jump intensity \(\lambda_J\) and the upward-jump probability together account for roughly 57% of the P95–P5 spread. Diffusion volatility ranks fourth. This re-ranking redirected the research budget: the team funded a quantitative tracking system for EU Council and ENVI Committee calendars rather than another GARCH refit.
Hedge ratios optimised on P95, not the mean
Three hedge programmes were compared, each layering forward purchases plus call options struck at €130:
- Unhedged: carry full exposure, hope MSR action is delayed.
- Forward-only 60%: lock in 60% of obligation at the live forward curve.
- Forward 50% + 25% calls at €130: layered hedge with optionality on the upside tail.
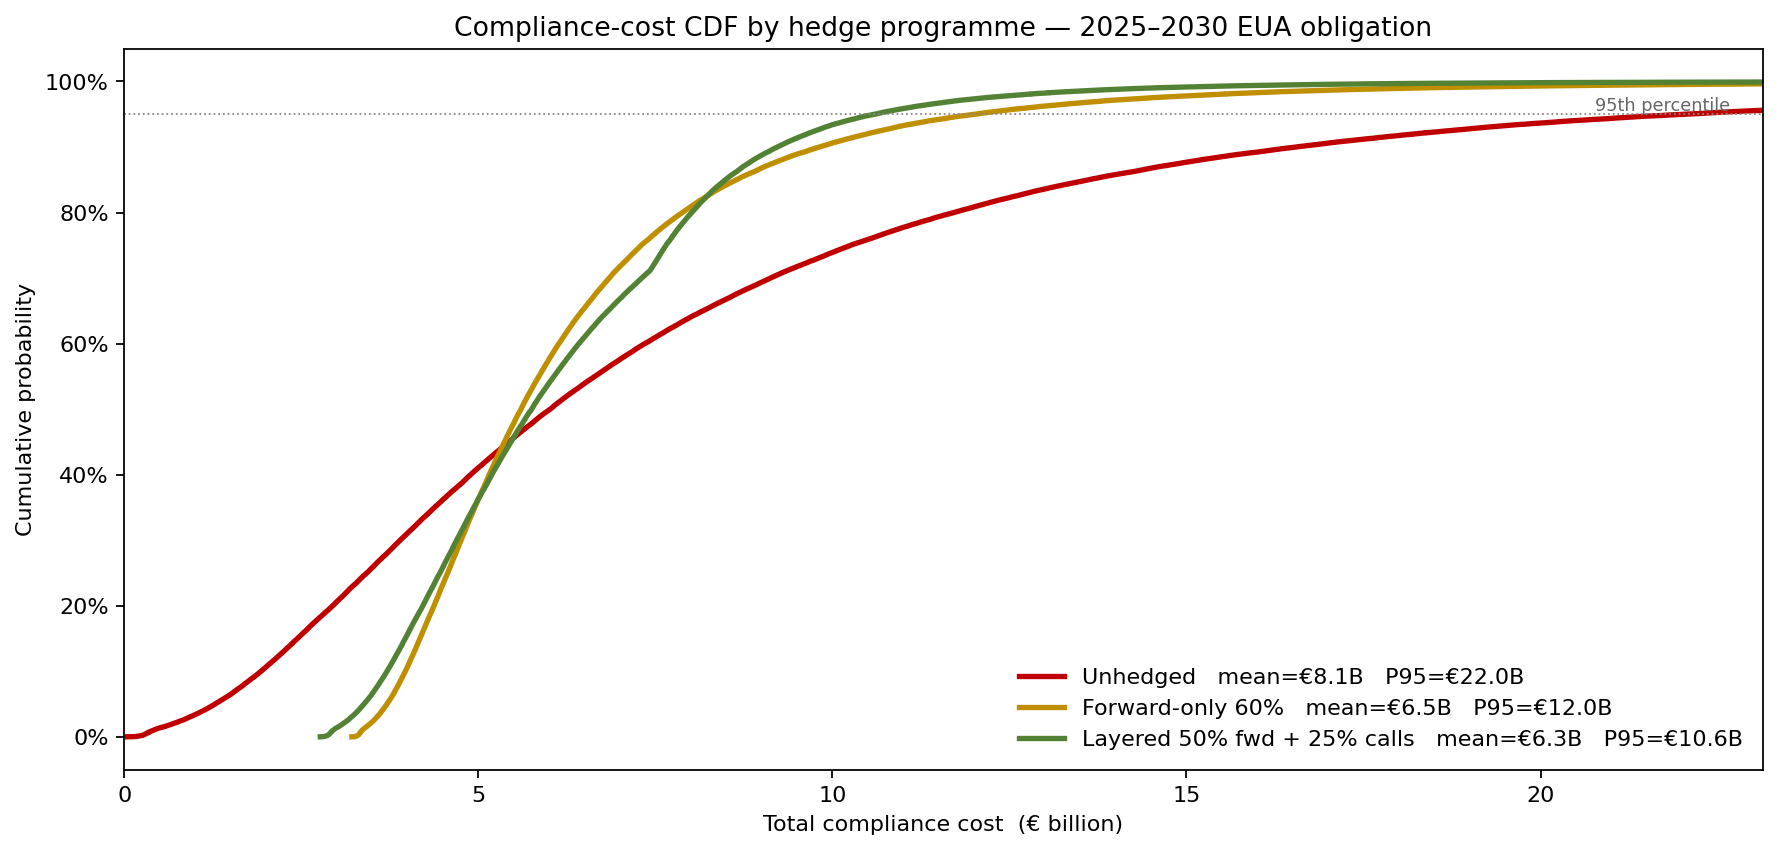
The layered hedge lowers expected cost to €6.3B and cuts the 95th-percentile cost by €11.4 billion versus unhedged — from €22.0B to €10.6B. The forward-only hedge looks similar on the mean but leaves a fatter upper tail (P95 €12.0B) because forwards do not catch the post-purchase rally that follows a tightening announcement.
What the model changed
- Hedge programme moved from forward-only 40% to layered 50% forward + 25% calls, which cut the P95 from €22.0B to €10.6B without raising expected cost.
- Phase-IV budget set on the P75 (€10.3B), not the mean — the CFO no longer has to ask the trading desk for a top-up halfway through the cycle.
- Policy-tracking cell added inside the risk function, because the simulation showed the marginal value of a one-week lead on Council announcements exceeds the cost of the cell several times over.
- Discontinued the OU-based pricing model that the desk had been running in parallel since 2019.
ModelRisk Functionality Used
- Jump-diffusion time-series simulation for EUA price paths, with mixture-distributed jump sizes calibrated to historical MSR-driven moves above €8.
- Custom Excel formulas for layered hedge payoffs (forward × ratio + call option × strike) evaluated against each simulated price path.
- Tornado on P95 rather than on the mean, because compliance budgets are set on the upper tail and the driver ranking is genuinely different.
- Scenario CDFs overlaying three hedge programmes on the same 100,000 price-path sample to show where in the distribution each strategy pays off.
- Distribution fitting of the historical jump-size sample to a two-component Normal mixture, used to seed the simulated jumps.
For a post-MSR carbon market, "the EUA price" is not a number, it's a distribution with a positive drift and a fat upper tail driven by policy. Pricing the hedge book on the mean of that distribution buys the wrong amount of cover; pricing it on the P95 buys the right amount.