

Industry: Defense
Product: ModelRisk
Application: Weapon system performance under uncertainty
Mean Availability 0.884, but a 32% Chance the Campaign Misses Its KPI
A fleet of eight launcher systems is contracted to hold an operational-availability KPI of 0.85 across a 30-day campaign. The sustainment model — characteristic life, mean repair time, expected uptime — returned a mean availability of 0.884, comfortably above the line. The Monte Carlo agreed on the mean and then exposed the number the sustainment brief omitted: across 60,000 simulated campaigns, 31.6% miss the 0.85 KPI. The mean clears the bar; nearly one campaign in three does not.
This is a sustainment and reliability-engineering problem, not engagement geometry. System effectiveness is a chain — availability × reliability × accuracy — and the deliverable is mission-effective rounds on target across a campaign, plus the contractual availability KPI.
Why a point estimate fails here
The deterministic chain multiplies the expected values: mean availability 0.884 × round reliability 0.93 × accuracy 0.80 × 240 planned rounds ≈ 158 mission-effective rounds. One tidy number.
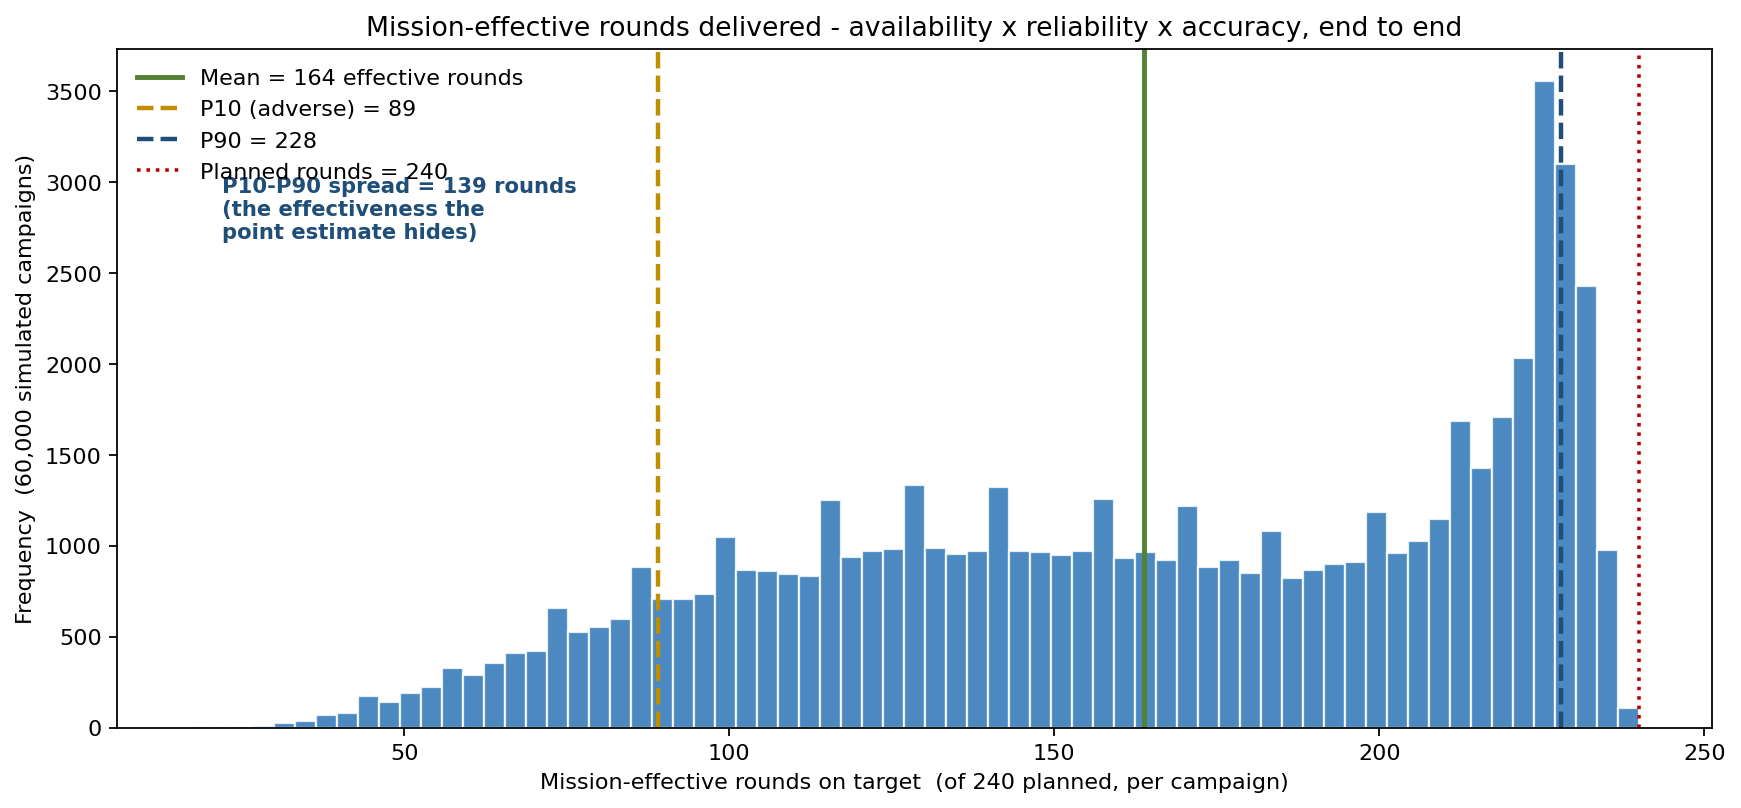
The Monte Carlo returns a distribution: mean 164, but a P10 of 89 and a P90 of 228 — a 139-round spread, well over half the planned load. A campaign that draws a harsh theatre and an unlucky run of wear-out failures delivers barely a third of the planned rounds on target. The point estimate of 158 sits inside that spread and tells a planner nothing about how often the campaign comes up short.
The reason the tail is heavy is correlation. A harsh campaign — heat, dust, sortie tempo — does not degrade one launcher; it degrades every launcher together. We model that as a shared campaign-harshness factor (Gamma, mean 1.0) that scales the Weibull wear rate and the accuracy of the whole fleet at once. The verification is explicit:
- Mean cross-launcher availability correlation: 0.207 under the shared-campaign model, versus −0.001 when each launcher is independent. Launchers fail together on a bad campaign.
- P(miss the availability KPI) = 31.6% with the shared factor, versus 24.6% without it — ignoring the common-mode harshness understates the KPI-miss probability by 7 points.
The sustainment model behind the chart
Each launcher runs a wear-out-and-repair timeline across the 720-hour campaign:
- Wear-out failures follow a Weibull with shape β = 2.3 (increasing hazard — genuine wear-out, not random failure) and characteristic life 520 hours, shortened on harsh campaigns.
- Repair times are LogNormal with a 10-hour median and a right tail to multi-day, drawn per failure. A finite maintenance capacity means a launcher that fails while all repair crews are busy waits in a queue — downtime is wait plus repair.
- Operational availability A_o = uptime / total time, fleet-averaged over the campaign.
- Per round, a planned fire mission is mission-effective only if the launcher is up (availability), the round functions (reliability, mean 0.93) and it hits (accuracy, Beta(8, 2), mean Ph 0.80).
Across 60,000 campaigns: mean A_o 0.884 (P10 0.738), mean 164 effective rounds (P10 89, P50 168, P90 228).
The KPI the mean clears and the tail misses
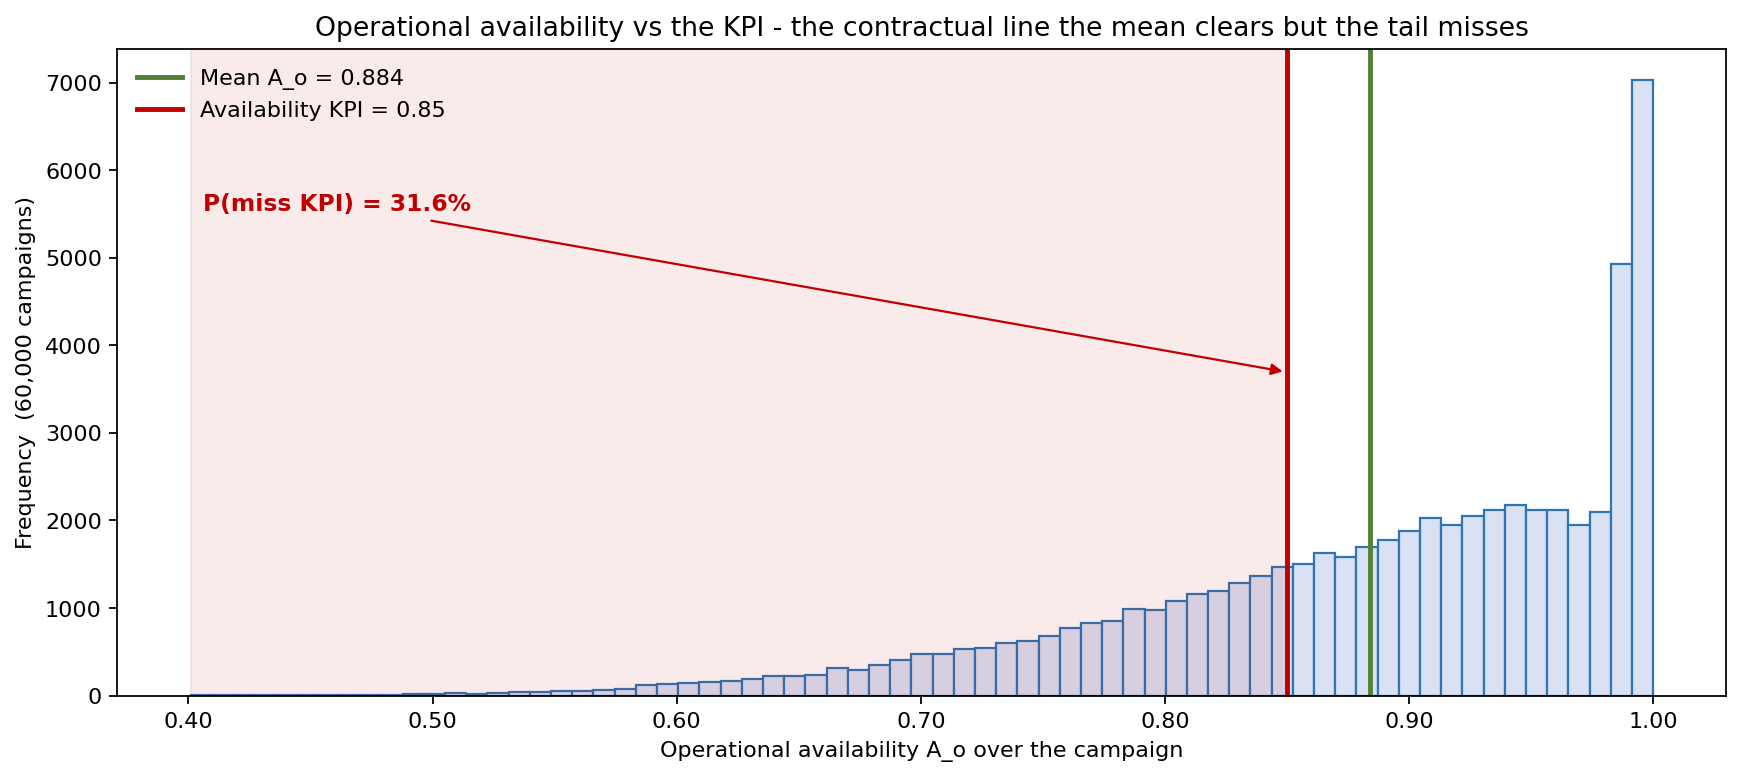
The availability histogram makes the contractual exposure concrete. The mean A_o of 0.884 sits to the right of the 0.85 KPI line — but the left tail spills well across it, and 31.6% of campaigns land below 0.85. A P10 of 0.738 means a realistic bad campaign runs more than ten availability points under contract. For a performance-based logistics contract with KPI penalties, that 31.6% is the number that prices the risk — and it is exactly the number the deterministic mean hides.
How much maintenance capacity buys
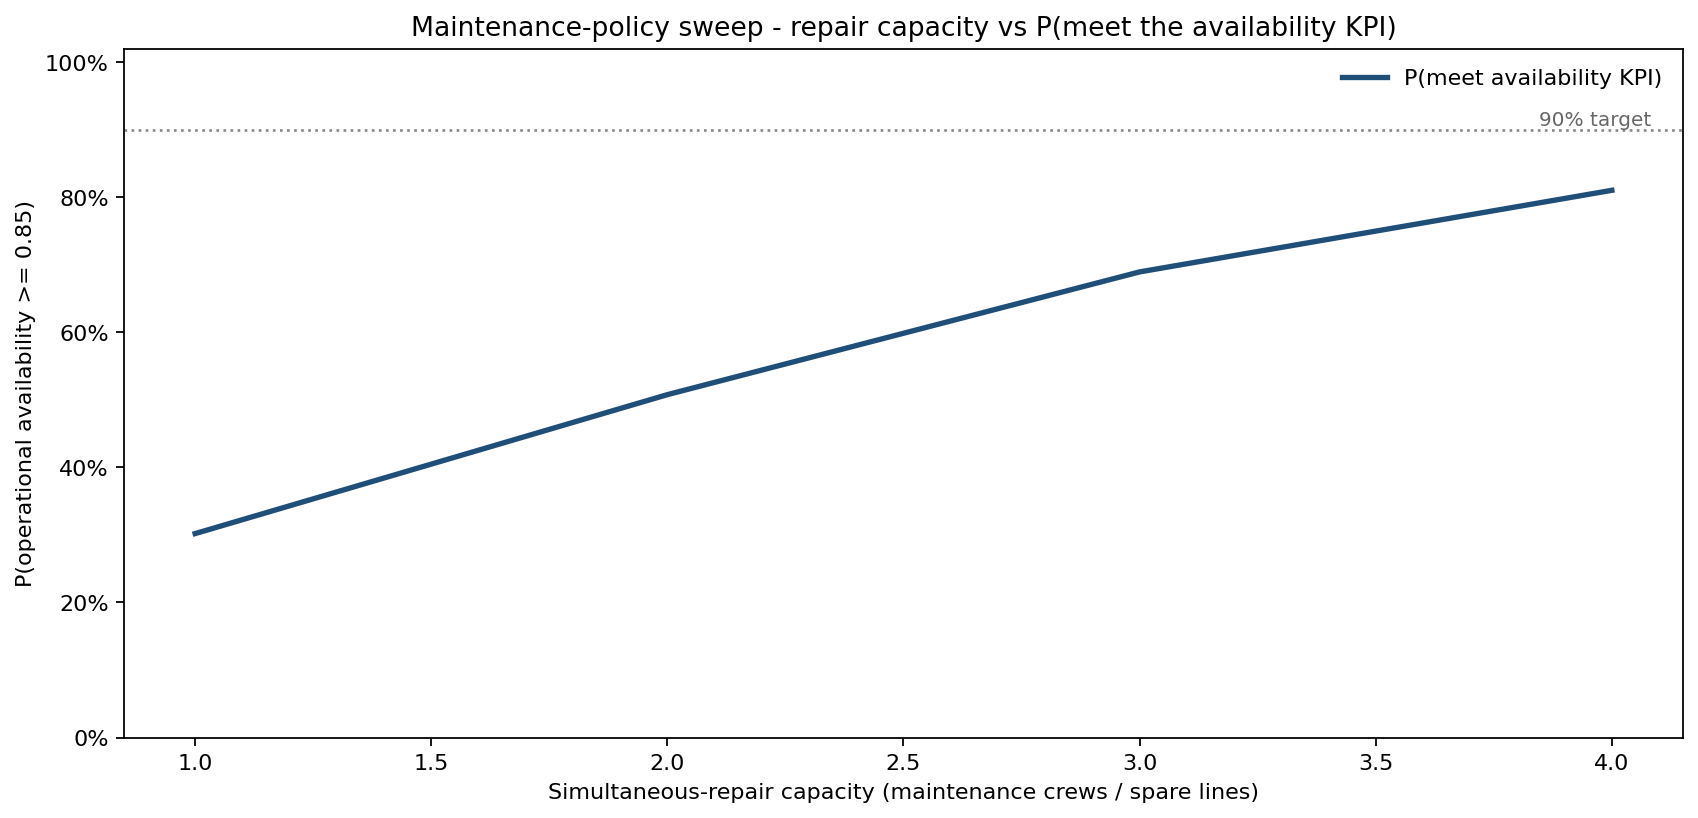
The actionable lever is repair capacity — how many launchers the maintenance detachment can work simultaneously before the rest queue. Sweeping it:
| Repair capacity (crews) | P(meet KPI) | Mean A_o |
|---|---|---|
| 1 | 30.2% | 0.750 |
| 2 | 50.8% | 0.833 |
| 3 | 68.9% | 0.885 |
| 4 | 81.0% | 0.917 |
Each added crew is worth roughly 17–20 points of KPI-meet probability across the relevant range — but even four crews leave a fifth of campaigns short of the KPI and never reach a 90% confidence target. The queue, not the mean repair time, is what drives availability: capacity removes the wait that turns a 10-hour repair into days of downtime when failures cluster on a harsh campaign.
What drives mission-effective rounds
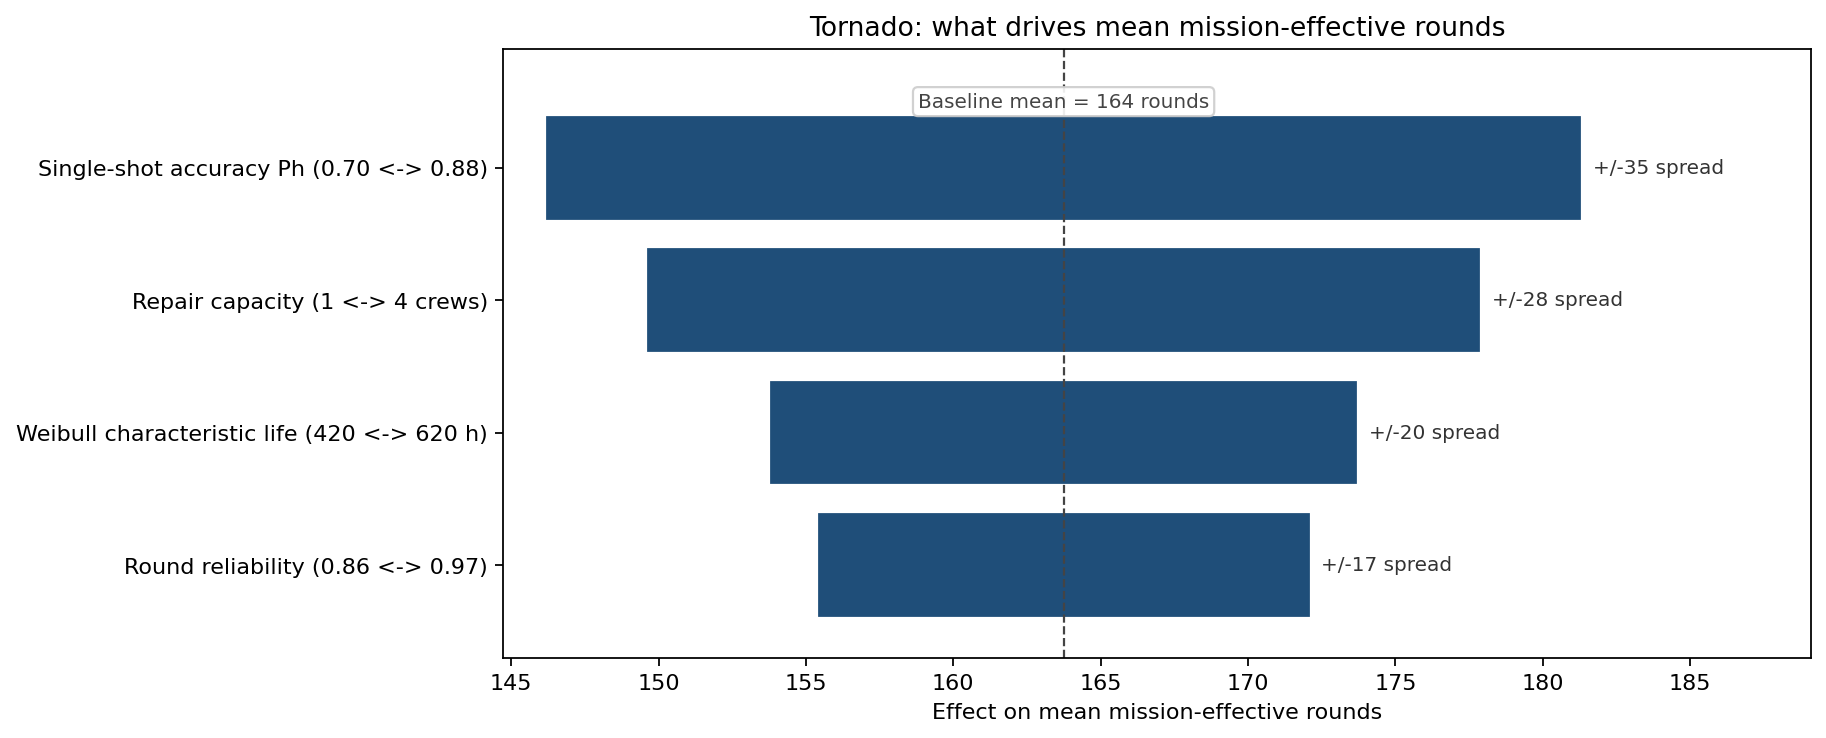
Ranked by effect on mean effective rounds (baseline 164):
- Single-shot accuracy Ph (0.70 to 0.88): ±18 rounds — accuracy is the largest single lever on rounds delivered.
- Repair capacity (1 to 4 crews): ±14 rounds — sustainment matters as much as the warhead.
- Weibull characteristic life (420 to 620 h): ±10 rounds — component wear-out life.
- Round reliability (0.86 to 0.97): ±8 rounds.
Accuracy and sustainment are comparable drivers — a finding that argues against pouring the whole modernization budget into the seeker while the maintenance tail goes unfunded.
What the model changed
- Repair capacity raised from two to three crews for the campaign, lifting P(meet KPI) from 51% to 69% — the cheapest path to the contractual line, justified directly by the sweep.
- The KPI risk re-priced at 31.6% miss probability, not zero, feeding a realistic penalty-exposure reserve into the performance-based logistics bid rather than the deterministic "we clear 0.85" assumption.
- Wear-out flagged for condition-based maintenance: because β = 2.3 means failures cluster late in component life, the program shifted from run-to-failure toward scheduled replacement before the hazard rate climbs, flattening the downtime that the queue amplifies on harsh campaigns.
ModelRisk Functionality Used
- Weibull wear-out model (β = 2.3) for time-to-failure — an increasing-hazard distribution that a constant-failure-rate assumption would have got badly wrong late in component life.
- LogNormal repair times feeding a finite-capacity repair queue, so downtime captures the wait when failures cluster — the mechanism behind the 32% KPI-miss tail.
- Shared campaign-harshness factor (Gamma, mean 1.0) scaling wear and accuracy across the whole fleet, with the induced 0.207 cross-launcher availability correlation verified empirically against a 0.000 independent baseline.
- availability × reliability × accuracy composed end to end into mission-effective rounds, returning a P10–P90 spread of 139 rounds the deterministic chain collapsed to a single 158.
- Maintenance-capacity sweep mapping crews to P(meet KPI) as a sustainment decision curve, and a tornado ranking accuracy against repair capacity.
Weapon-system effectiveness is not the product of average availability, reliability and accuracy — it is the distribution that emerges when a harsh campaign degrades the whole fleet at once, and only a Monte Carlo that ties them together shows the one-in-three chance the KPI is missed.