

Industry: Defense
Product: ModelRisk
Application: Optimizing Surveillance System Deployment Under Uncertainty
A 3-Platform ISR Fleet Holds a Manoeuvring Target for Just 70% of the Mission — and Drops It Entirely 41% of the Time
A wide-area ISR (intelligence, surveillance, reconnaissance) cell tasked with maintaining a persistent track on a moving target of interest runs a rotation of three platforms — a mix of UAV orbits and satellite passes — at a roughly 14-minute per-platform revisit. The deterministic plan, built on nominal sensor specs and a clear-day re-acquisition probability of 0.95, concluded that the target would be held essentially continuously: a 95% re-acquire at every revisit, multiplied out, "obviously" keeps the track alive.
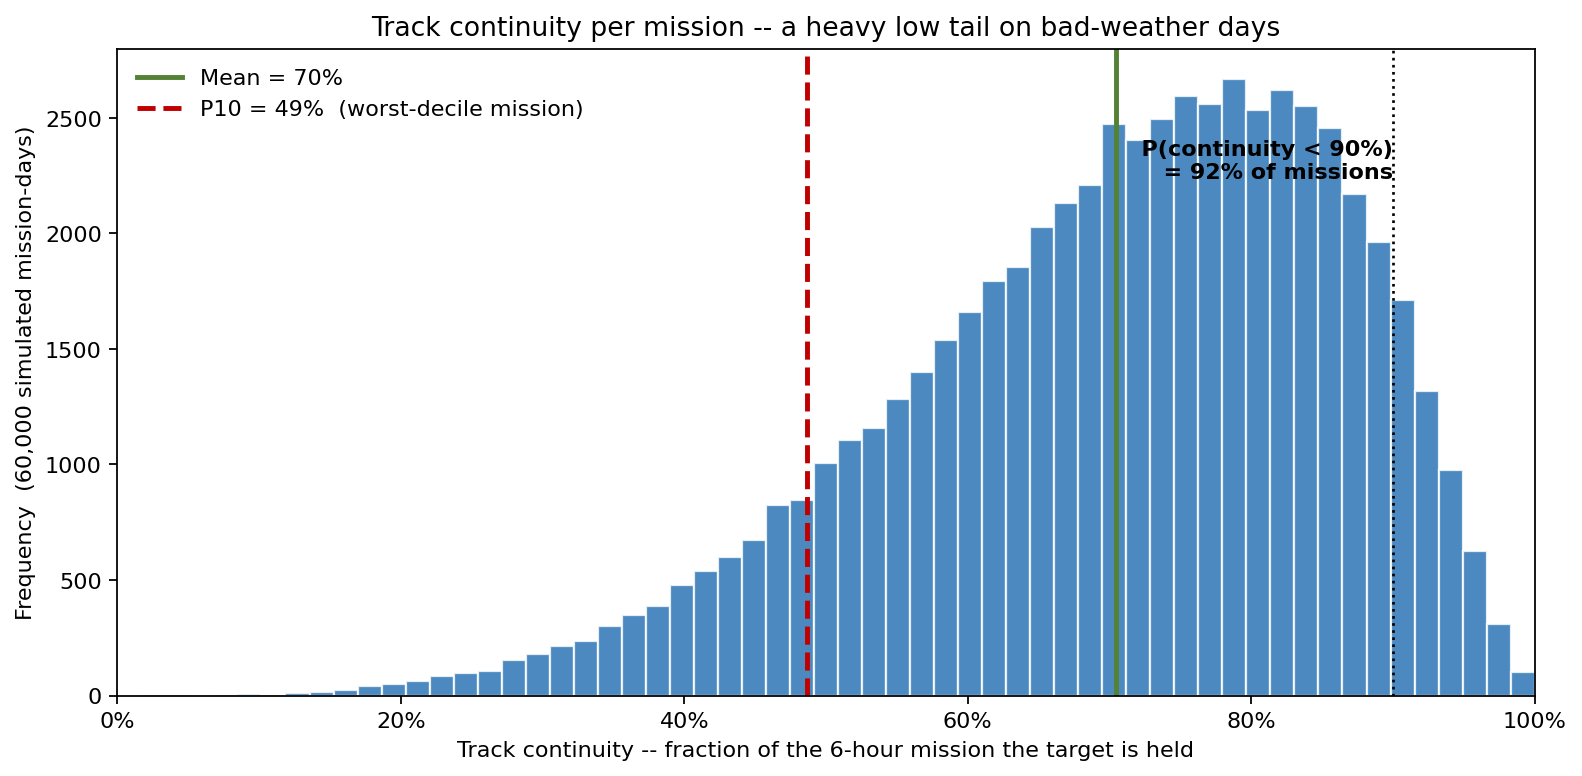
Run as a Monte Carlo over 60,000 simulated mission-days — with target manoeuvre, position-uncertainty growth between revisits, and a shared mission-wide environment factor that degrades every platform's re-acquisition together — the picture is very different. The fleet holds the target for a mean of just 70% of the 6-hour mission, the worst-decile mission holds it only 49% of the time, and on 41% of missions the track is lost outright (a coasting gap longer than 20 minutes). The nominal "continuous track" was a clear-day fiction; track continuity is a wide distribution, and its low tail lands on exactly the cloudy, contested days the mission matters most.
Why a point estimate fails here
Two things break the multiply-the-re-acquire-rates calculation.
First, the target moves and the track coasts. Between revisits the ISR cell holds only a motion-model estimate, and its position uncertainty grows. If the target manoeuvres far enough that it falls outside the search basket by the next revisit, re-acquisition probability collapses — so re-acquire probability is not a constant 0.95, it decays with the coast time since the last good fix. A single number cannot represent a probability that depends on how long ago you last saw the target.
Second, and decisively, re-acquisition failures are correlated across the whole fleet. A cloud deck, EM interference, or dust does not pick on one platform — it degrades every platform's sensor on every pass that day. We model this with one mission-wide environment factor drawn per mission and applied to every revisit. The empirical check confirms the coupling is real and strong: the Spearman correlation between the environment factor and mission track-continuity is +0.91, and between the environment factor and the longest coasting gap is −0.70. Under an independence assumption those failures would average out across platforms and the track would almost never break; in reality they cluster on bad-weather missions, which is precisely where the 41% loss rate comes from.
The headline distribution
Track continuity — the fraction of the 6-hour mission the target is actually held — has a mean of 70%, a P10 of 49%, and a long low tail: 92% of missions fall below 90% continuity, and a perfectly continuous track (≥95%) occurs on under 2% of missions. The shape is the whole point. Reporting "70% mean continuity" to a tasking authority hides that one mission in ten holds the target less than half the time, and that the bad missions are not random — they are the cloudy ones.
Revisit interval and platform count are the levers
How much fleet, and how fast a revisit, does it take to actually maintain a track? Sweeping both:
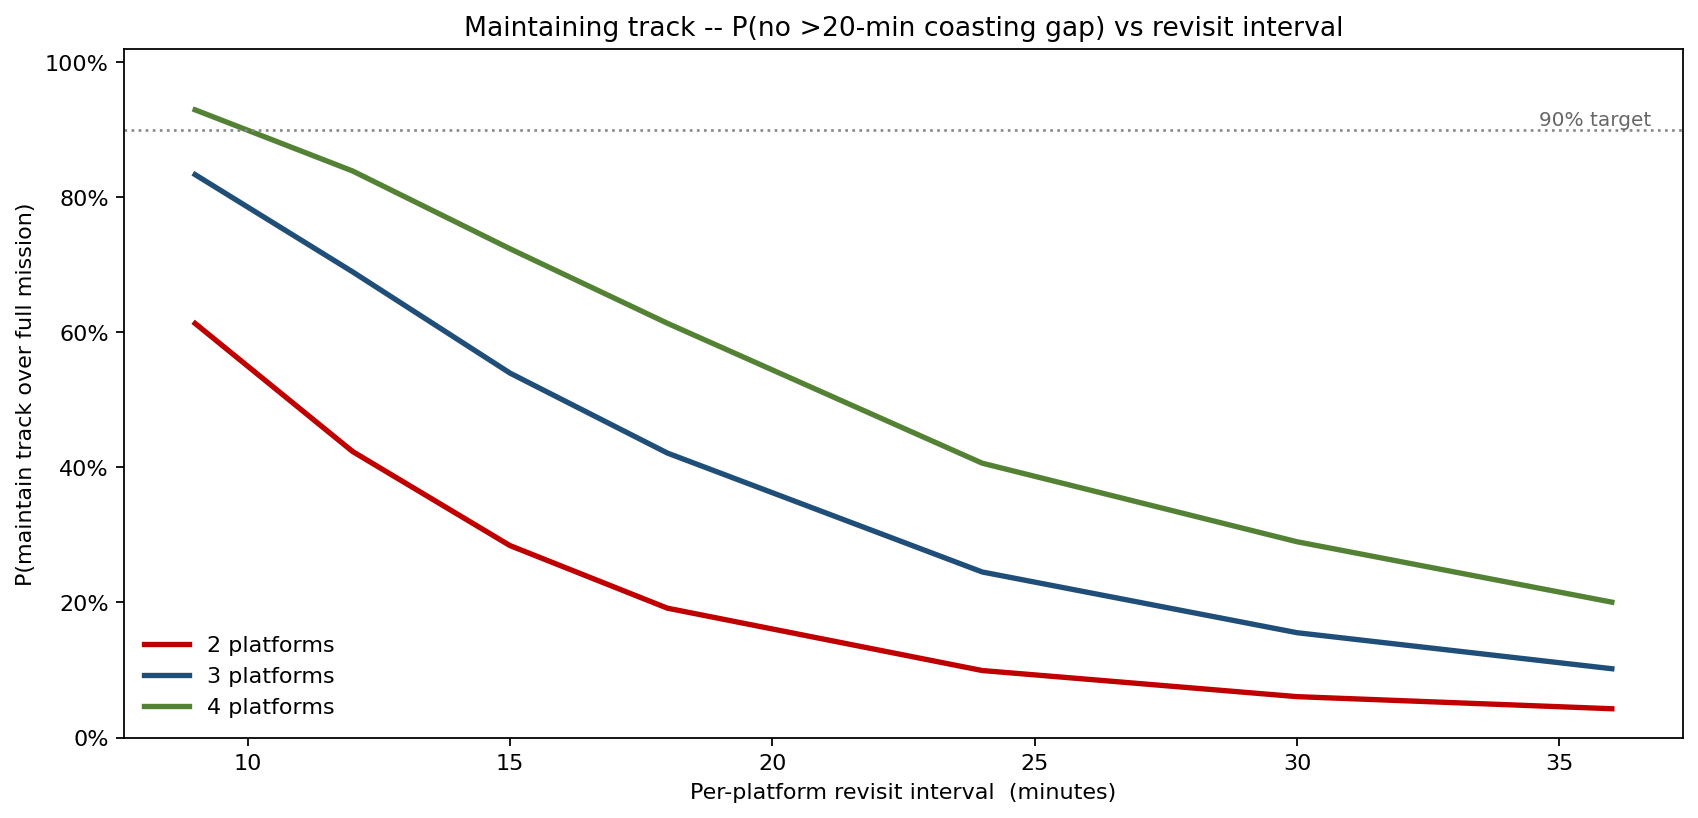
P(no >20-minute coasting gap) is acutely sensitive to revisit interval. With 3 platforms it runs 83% at a 9-minute revisit, 69% at 12 minutes, 54% at 15, and just 42% at 18. The current 14-minute posture sits at roughly 60% — well short of a 90% maintain-track target. Only a 4-platform fleet at a ≤10-minute revisit clears the 90% line (93% at 9 minutes); a 2-platform fleet never gets close, topping out at 61% even at the tightest revisit. The relationship is steeply convex: every minute added to the revisit interval costs far more track-maintenance probability near the operating point than the linear planning assumption implied.
A shared cloud deck shifts the whole constellation's coverage
The same common environment factor drives area-of-interest coverage, not just point-target track.
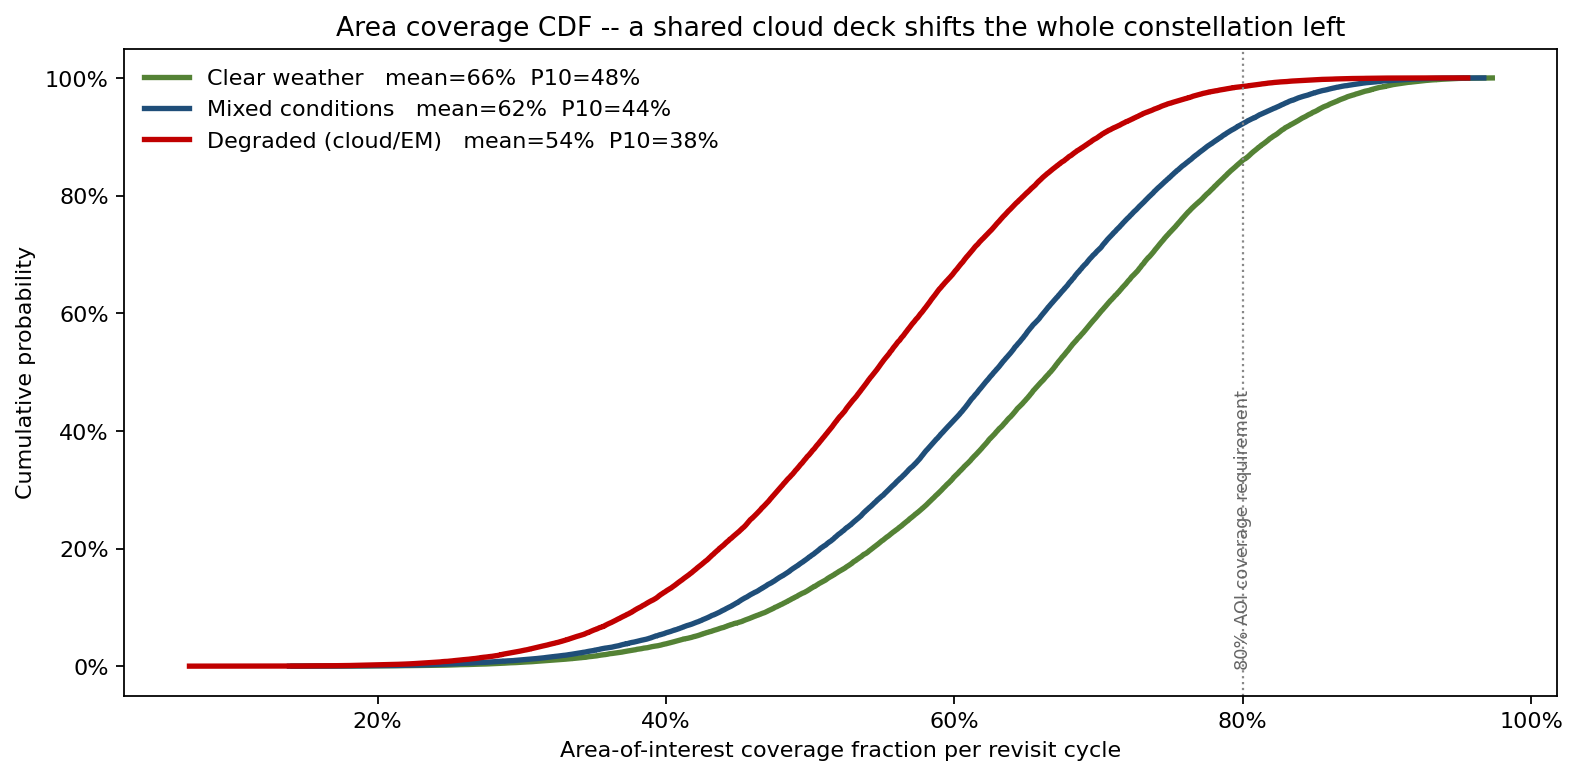
Comparing three weather regimes, mean AOI coverage per revisit cycle falls from 66% (clear) to 62% (mixed) to 54% (degraded cloud/EM), and the whole CDF shifts left together — a degraded mission is uniformly worse across the constellation, not patchily worse. Against an 80% AOI coverage requirement, the probability of meeting it is only 14% on clear days, 8% mixed, and 1% degraded. The requirement was set as if coverage were a fixed number; the model shows it is a scenario-dependent distribution that the current fleet rarely satisfies.
What actually drives track loss
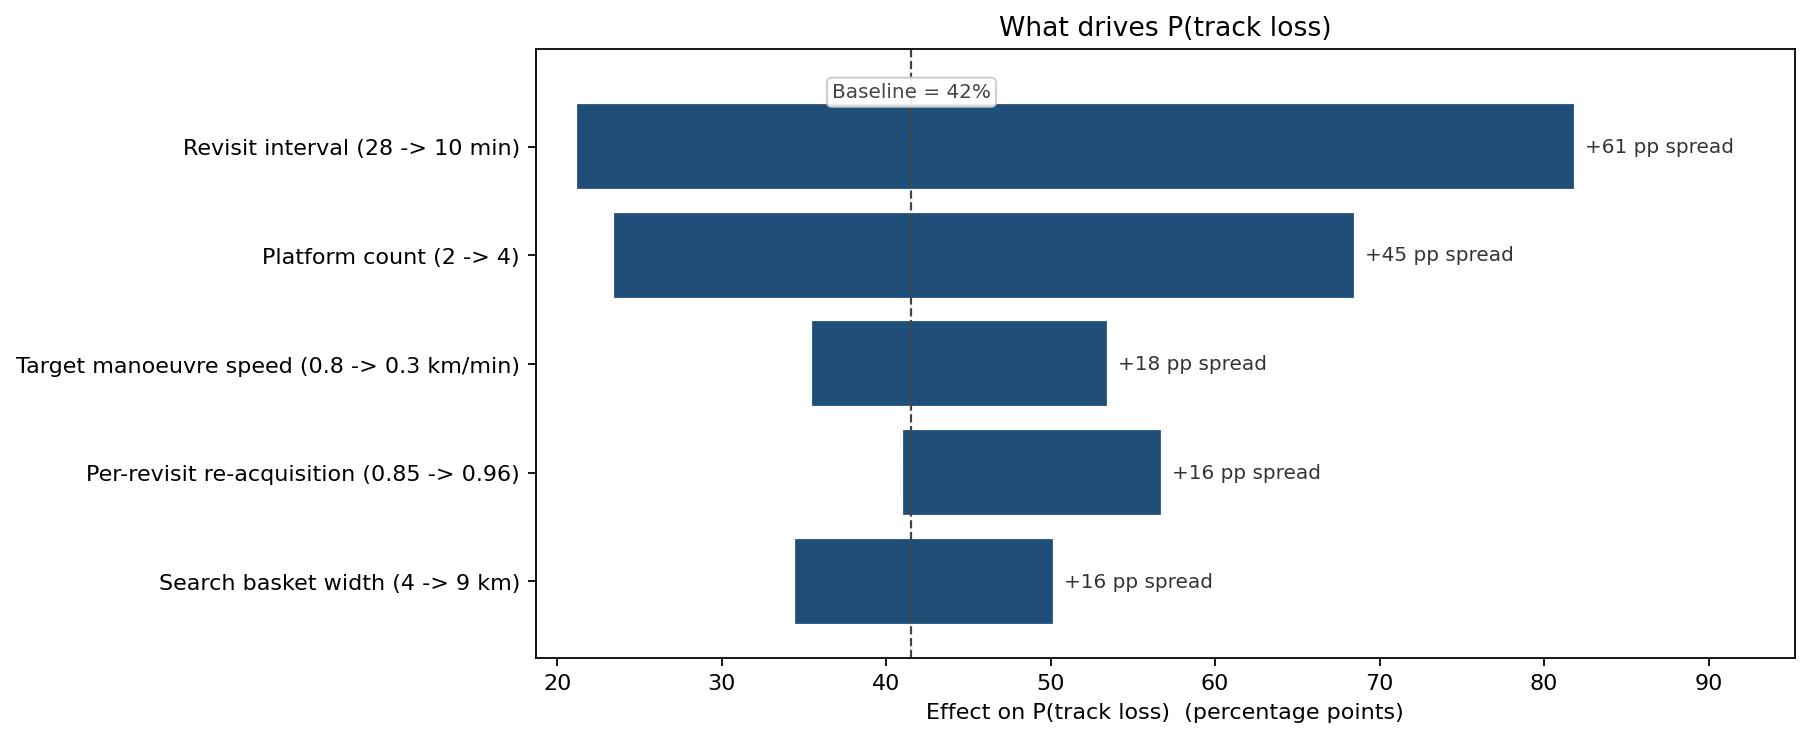
Ranking the levers by their swing on P(track loss), baseline 41%:
- Revisit interval (28 to 10 minutes): 61 pp swing — by far the dominant lever. Tightening the revisit beats every other intervention.
- Platform count (2 to 4): 45 pp — adding airframes works, but a 4th platform buys less than halving the revisit interval on the platforms you already have.
- Target manoeuvre speed (0.8 to 0.3 km/min): 18 pp — adversary-controlled, but it sets how much revisit rate the target's behaviour demands.
- Per-revisit re-acquisition quality (0.85 to 0.96): 16 pp.
- Search basket width (4 to 9 km): 16 pp — better motion modelling and a wider re-acquire basket help, but are second-order to cadence.
What the model changed
- The "continuous track" planning assumption was replaced with a continuity distribution — mean 70%, P10 49%, 41% loss rate — that the tasking authority now uses to set realistic expectations and prioritise targets.
- Investment was steered toward revisit cadence over raw platform count: the tornado showed a tighter revisit returns more track-maintenance probability per dollar than a fourth airframe, reordering the procurement priority.
- The 80% AOI coverage requirement was re-examined against a 14%-on-clear-days reality, prompting either a coverage-requirement revision or a fleet increase rather than a paper compliance claim.
- Tasking became weather-aware: because the environment factor couples the whole fleet, the cell now surges platforms or accepts reduced tasking on forecast-degraded days instead of assuming the fleet averages out the weather.
ModelRisk Functionality Used
- Coast-dependent re-acquisition model in which per-revisit re-acquire probability decays with time since the last good fix, target manoeuvre speed, and position-uncertainty growth — not a fixed re-acquire constant.
- Shared mission-wide environment factor drawn per mission and applied to every platform's every revisit, imposing the +0.91 environment-to-continuity correlation that makes track loss cluster on bad-weather days instead of averaging out.
- Beta-distributed coverage fractions scaled by the same environment factor, producing the clear/mixed/degraded coverage CDFs and the P(meet 80% requirement) figures.
- Two-dimensional sweep over revisit interval and platform count, yielding the convex maintain-track curves and the 4-platform/≤10-minute operating point that clears the 90% target.
- Sensitivity (tornado) ranking on P(track loss) that put revisit cadence ahead of platform count, target speed, sensor quality and basket width — reordering the investment priority.
Maintaining surveillance on a moving target is not the re-acquire probability stamped on a sensor; it is the probability of holding an unbroken track across a full mission, on the cloudy day when every platform degrades at once. Monte Carlo simulation in ModelRisk is what turns a clear-day "continuous track" assumption into the 70%-continuity, 41%-loss distribution an ISR cell can actually plan and resource against.