

Industry: Defense
Product: ModelRisk
Application: Strategic deterrence under uncertainty
A Mean of 500 Surviving Warheads, a 21% Chance the Second Strike Falls Short
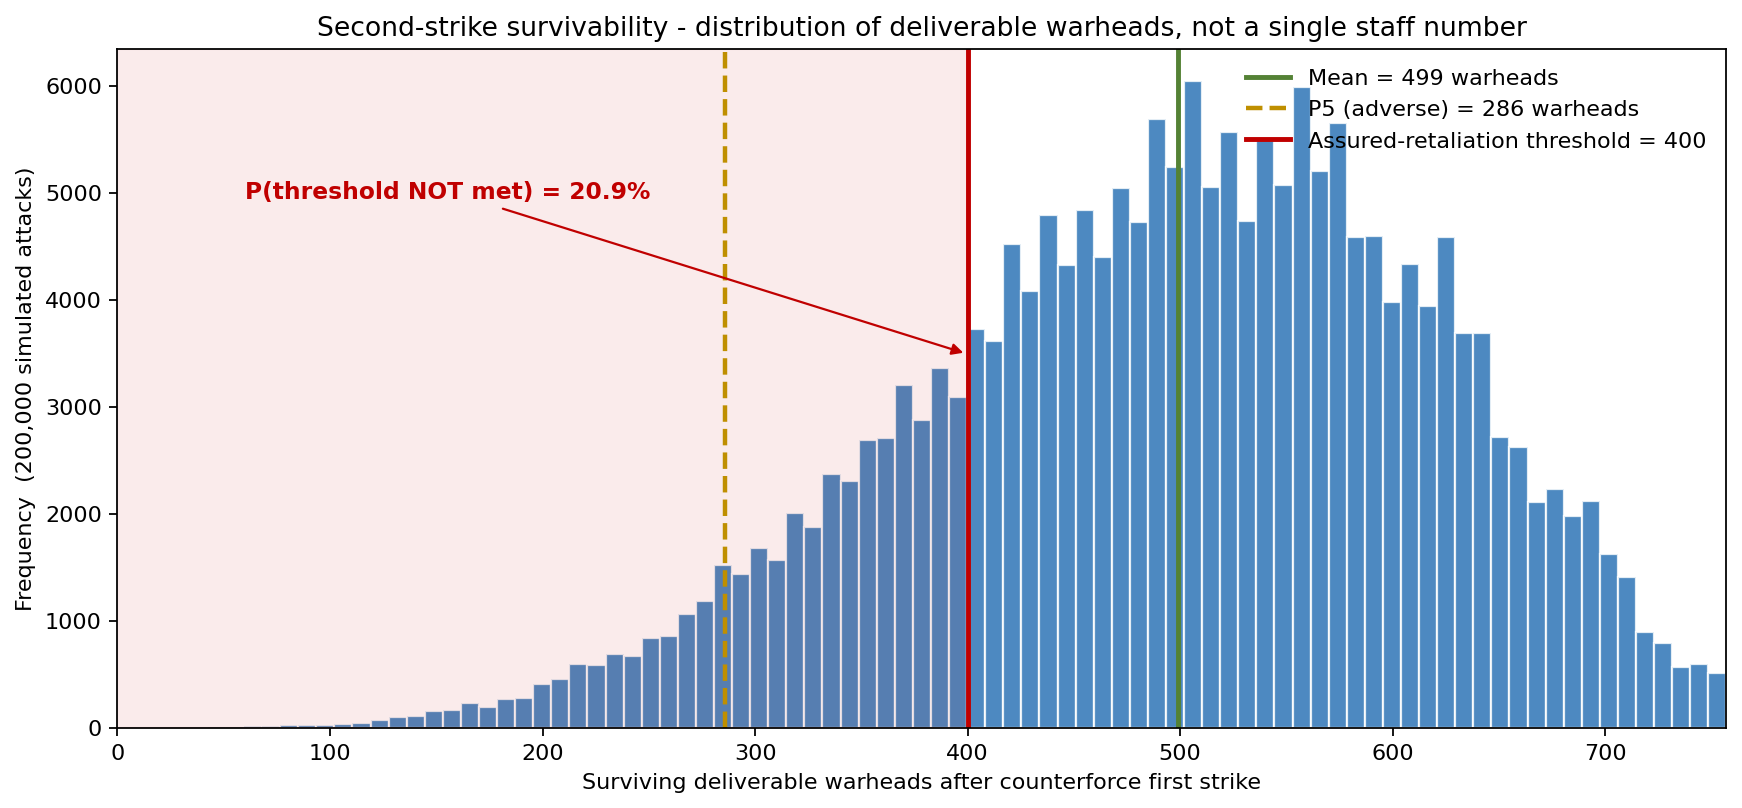
The staff brief said the triad would field roughly 500 deliverable warheads after an adversary counterforce first strike — comfortably above the 400-warhead assured-retaliation threshold the doctrine demands. The Monte Carlo confirmed the mean of 499 and then delivered the number the brief could not: a 20.9% probability that surviving forces fall below the threshold — better than a one-in-five chance the second strike is not assured, driven almost entirely by a correlated readiness failure that hits the whole force at once.
This use case is about the survivability of one's own forces under attack, not the interception of incoming weapons. The question is not "can we shoot it down?" but "after they shoot first, do enough warheads survive to retaliate?"
Why a point estimate fails here
A deterministic survivability calculation multiplies expected survival rates leg by leg and reports one number — about 500 warheads, well clear of 400. It cannot represent the event that actually threatens deterrence: a surprise attack that catches the entire force in a low-readiness posture simultaneously.
We modelled that as a shared readiness state. On any given day a per-attack readiness multiplier — Beta(7, 3), mean ~1.0 with a left tail toward 0.4 — scales the SSBN at-sea rate and the bomber generation rate together. A bad readiness day depresses both survivable legs at once. The effect is large and verifiable:
- Correlation between SSBN-leg and bomber-leg surviving warheads: 0.428 under the shared-readiness model, versus 0.000 when each leg draws its posture independently. The dependency is real and measured, not asserted.
- P(threshold not met) = 20.9% with the shared factor, versus 14.0% without it. Treating readiness as independent across legs understates the failure probability by nearly 7 points — exactly the common-mode risk that a surprise attack exploits.
- The adverse-case floor drops from a P5 of 348 warheads (independent) to 286 warheads (correlated) — the tail that crosses the threshold.
The triad model behind the chart
Each leg contributes surviving deliverable warheads through its own kill chain across 200,000 simulated attacks:
- ICBM — 150 single-warhead silos. Each silo faces an adversary single-shot kill probability with mean 0.86, scaled by a shared per-attack effectiveness factor (the adversary's accuracy, reliability and fratricide on the day apply to all silos at once). Survivors fire at 0.80 post-attack reliability. Mean surviving: 18 warheads — the fixed, soft leg is largely consumed.
- SSBN — 10 boats × 64 warheads. Survival is governed by dispersal: at-sea boats survive at 0.98, in-port boats at 0.05. The number at sea is binomial around a 60% patrol rate, itself depressed on a low-readiness day. Mean surviving: 349 warheads — the backbone.
- Bomber — 48 aircraft × 6 ALCMs. Generated/dispersed aircraft survive at 0.90, ungenerated at 0.10. Generation rate ~55%, also readiness-driven. Mean surviving: 132 warheads.
Total surviving deliverable warheads: mean 499, P5 = 286, P50 = 506, P95 = 686.
Where survivability lives
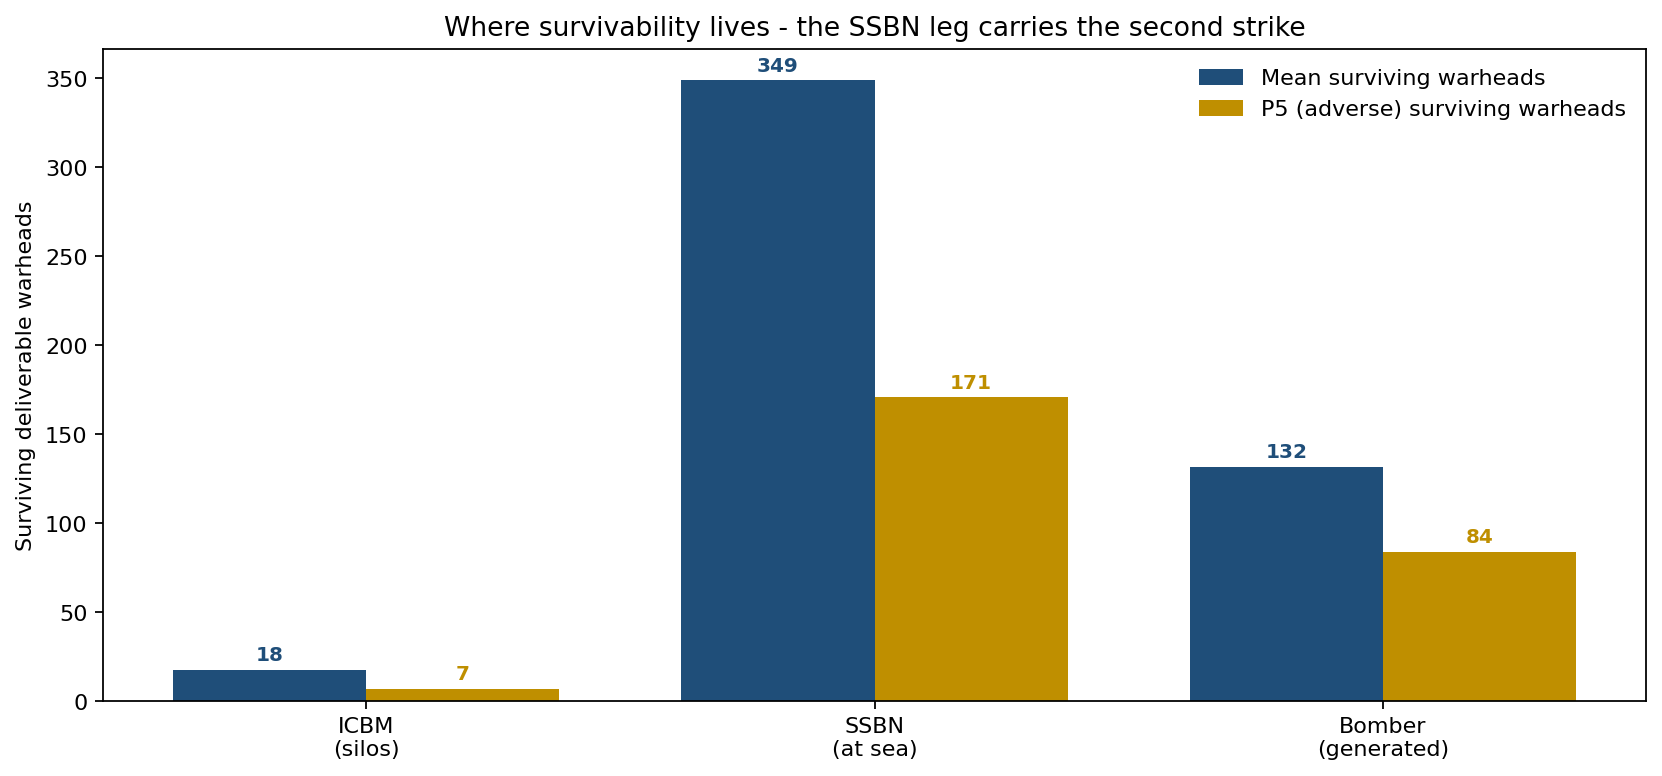
The leg breakdown is the strategic argument for the sea-based deterrent in one chart. At the mean the SSBN leg carries 349 of the ~500 surviving warheads; the ICBM silos — fixed, located, and individually targetable — survive with just 18. But the adverse case is starker: at P5 the SSBN leg still delivers 171 warheads while the silos collapse to 7. Survivability is not spread evenly across the triad; it is concentrated in whichever leg is dispersed and hidden when the strike lands.
How dispersal buys assured retaliation
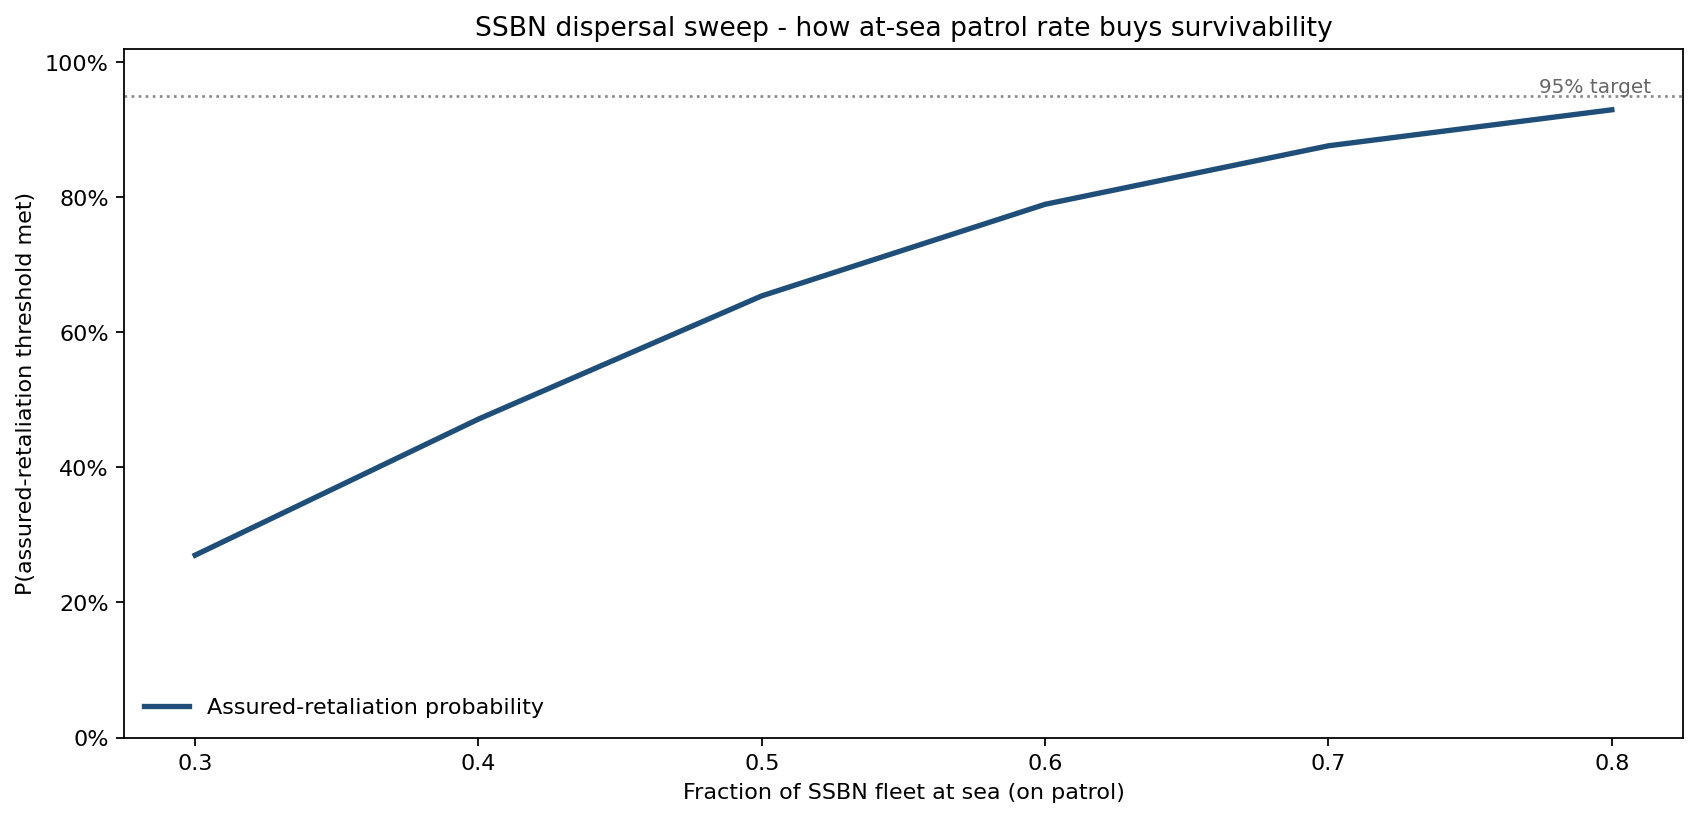
Because the SSBN leg dominates, the single most powerful lever is the at-sea patrol rate. Sweeping it:
| SSBN at-sea rate | P(threshold met) | Mean surviving warheads |
|---|---|---|
| 0.30 | 27.0% | 338 |
| 0.40 | 47.2% | 392 |
| 0.50 | 65.4% | 445 |
| 0.60 | 79.1% | 499 |
| 0.70 | 87.6% | 551 |
| 0.80 | 93.0% | 604 |
Lifting the patrol rate from 30% to 80% moves assured-retaliation probability from 27% to 93%. The curve does not reach the 95% target even at an 80% patrol rate — a finding that argues for combined posture measures rather than relying on dispersal alone.
What moves the survivability floor
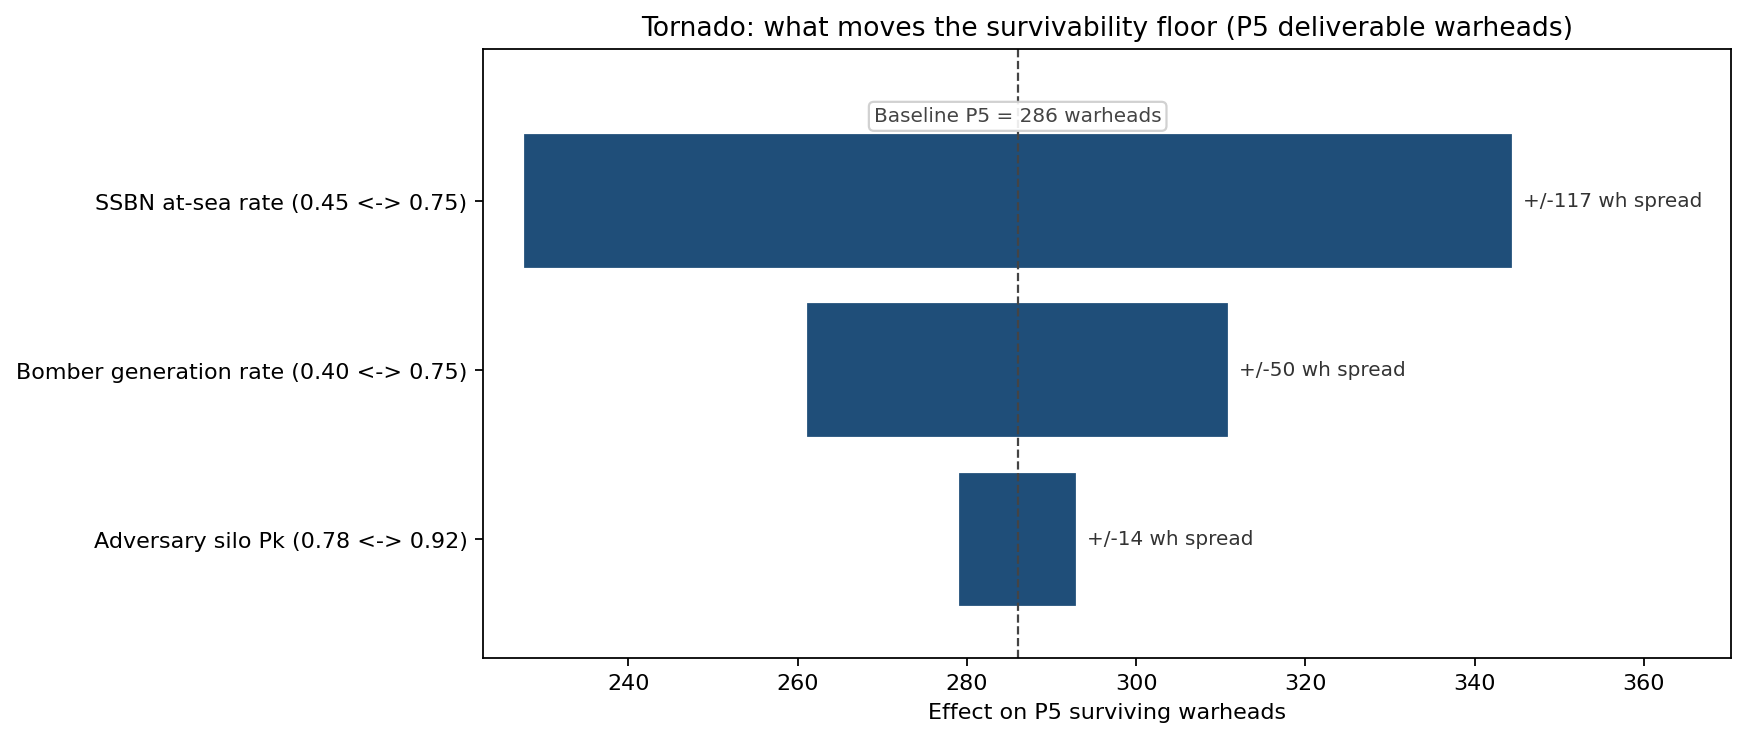
Ranked by effect on the P5 floor (baseline 286 warheads):
- SSBN at-sea rate (0.45 to 0.75): ±58 warheads — the dominant survivability lever.
- Bomber generation rate (0.40 to 0.75): ±25 warheads.
- Adversary silo Pk (0.78 to 0.92): ±7 warheads — the silo leg is so soft that the adversary's marginal accuracy barely changes the surviving total.
The ranking is a procurement argument: spending to harden silos against a more accurate adversary moves the floor by 7 warheads; spending to raise patrol availability moves it by 58.
What the model changed
- Patrol-rate floor written into posture doctrine at 60%+ to hold assured-retaliation probability near 80%, with surge guidance to 70%+ during elevated tension.
- Readiness common-mode flagged as the dominant deterrence risk: the 0.428 cross-leg correlation showed that a single surprise-attack-in-low-readiness scenario, not independent leg failures, is what crosses the threshold — reshaping indications-and-warning priorities toward force generation.
- Silo hardening de-prioritised relative to sea-leg availability on the strength of the tornado: the marginal warhead is far cheaper to buy through patrol availability than through silo survivability.
ModelRisk Functionality Used
- Shared readiness-state factor (Beta(7, 3)) broadcast to both the SSBN at-sea rate and bomber generation rate, imposing the common-mode posture correlation that lifts P(failure) from 14.0% to 20.9%.
- Empirical correlation check: the 0.428 cross-leg surviving-warhead correlation (vs 0.000 independent) computed directly from the leg outputs, confirming the common factor was active.
- Per-leg binomial survival chains — silo kill with a shared attack-effectiveness multiplier, boat dispersal, bomber generation — composed into one deliverable-warhead total.
- Dispersal sweep mapping at-sea rate to P(threshold met) as a posture decision curve.
- Tornado on the P5 floor ranking patrol rate, bomber generation and adversary accuracy, which inverted the intuitive procurement priority.
Strategic deterrence is not a single survivability number; it is the probability that enough warheads survive a correlated bad day — and only a model that ties the legs together through a shared readiness factor can see the one-in-five chance the threshold is missed.