

Industry: Defense
Product: ModelRisk
Application: Military logistics planning under uncertainty
The Plan Says the Force Closes in 16 Days; the Simulation Gives It a Coin-Flip Chance of D+30
Moving a brigade-equivalent force into theatre means downloading roughly 120,000 short tons of unit equipment and sustainment at the destination ports and airfields, by a mix of strategic airlift and sealift. The movement plan, built on nominal lift capacity, says the force closes — the last required ton on the ground, combat-ready — in about 16 days, comfortably inside the D+30 requirement. Then reality multiplies through: ports run at 80% of rated throughput, not 100%; a theatre at high operational tempo throttles every download together; ships and aircraft are down for maintenance and attrition; transit times stretch. Stack those onto the same plan and the simulation returns a mean closure of 30 days, a P90 of 44 days, and only a 57% probability of closing the force by D+30 — a planning requirement the deterministic timeline reported as a near-certainty.
A joint movements staff rebuilt its time-phased force-deployment estimate in ModelRisk after a rehearsal-of-concept exercise blew through its planned closure date. The mandate was to attach a probability to the D+30 closure requirement and to find which lever actually buys it down — not to defend a single-point timeline that assumes everything runs at its rated capacity.
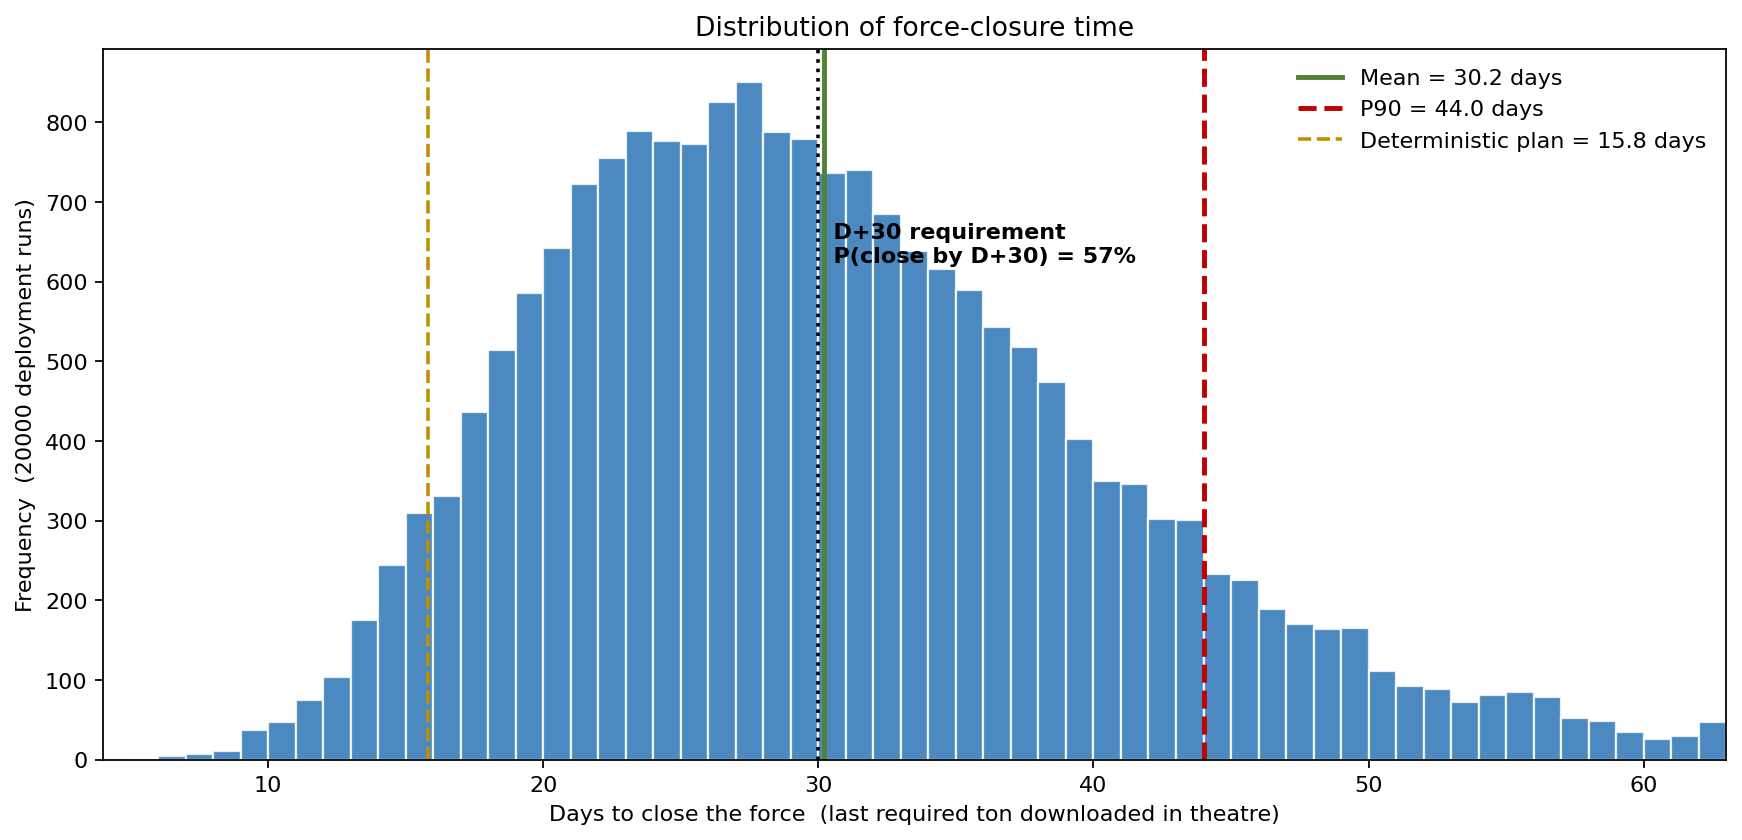
The gap between the dashed deterministic plan and the body of the distribution is the entire story. The nominal-capacity plan sits at day 16; the realized closure day piles up around 29–30, with a long right tail past the D+30 line. The force closes on time a little better than half the time — not because any single input is catastrophic, but because every throughput input degrades the same flow at once.
Force closure as a throughput race, not an inventory problem
This is a movement-and-throughput model: a daily race to download tonnage faster than the deadline arrives — not a spares or reorder problem. The simulation runs 20,000 deployments, advancing each day until cumulative downloaded tonnage reaches 120,000 tons:
- Airlift — 14 strategic sorties scheduled per day at 65 tons each, with day-to-day Poisson variation in completed sorties.
- Sealift — large RO/RO ship arrivals (Poisson, about 2.6 a week) at 18,000 tons per download — the bulk mover, sparse and lumpy.
- Port/airfield throughput efficiency — a Beta(8, 2) factor, mean 80%, gating both modes: materials-handling equipment, ramp space and stevedore labor cap how fast a ship or aircraft can actually be cleared.
- Asset availability — Beta factors for airlift (mean ~88%) and sealift (~91%) capture maintenance and attrition removing lift from the schedule.
- Transit / turn-time delay — a Triangular(1.0, 1.15, 1.6) multiplier that stretches effective cycle time.
- Theatre-tempo factor — a single Beta draw per campaign, on the band [0.45, 1.0], that scales every day's throughput together. One surge, weather state or threat posture moves the whole flow, so daily deliveries are not independent. That shared factor is what keeps the closure-day distribution genuinely wide instead of collapsing to its mean.
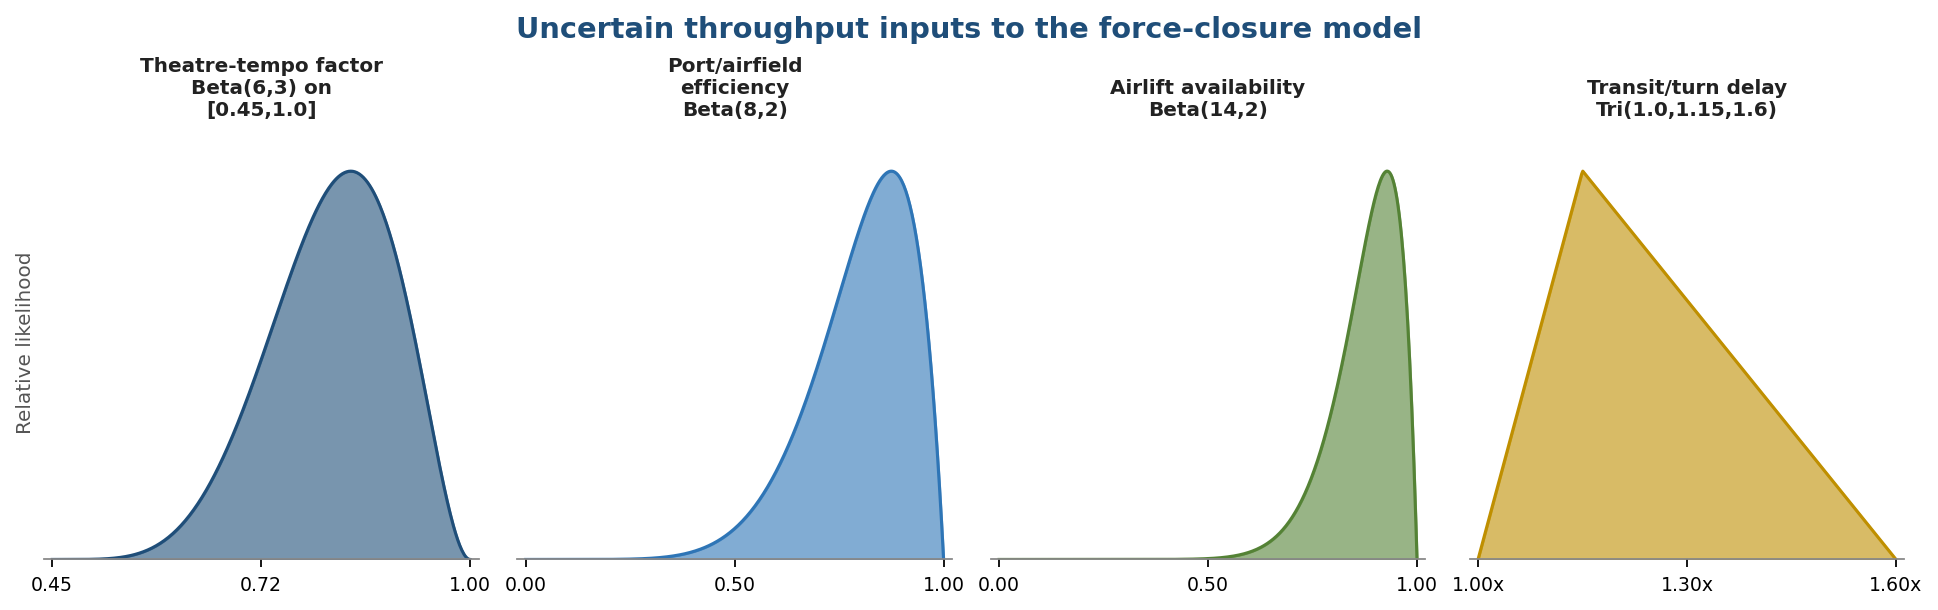
The four inputs span real ranges: the theatre-tempo factor (mean 0.82) can drop to the low 0.5s in a hot theatre; port efficiency (mean 0.80) carries most of the spread; airlift availability sits high (mean 0.88); and the transit-delay multiplier (mean 1.25×) rarely improves on schedule and frequently slips.
Why a point estimate fails here
The deterministic plan divides 120,000 tons by nominal daily capacity and returns 16 days. Every input it fixes at its rated value is one the simulation lets vary — and they vary together, because the tempo factor is shared. The result is not a small wobble around 16 days; it is a distribution whose mean (30 days) is nearly double the deterministic answer, because degraded throughput compounds across the whole movement rather than averaging out. The number a commander actually needs — P(closed by D+30) = 57% — is invisible to a plan that reports a single closure date.
The reception node is the lever — but it can't close the gap alone
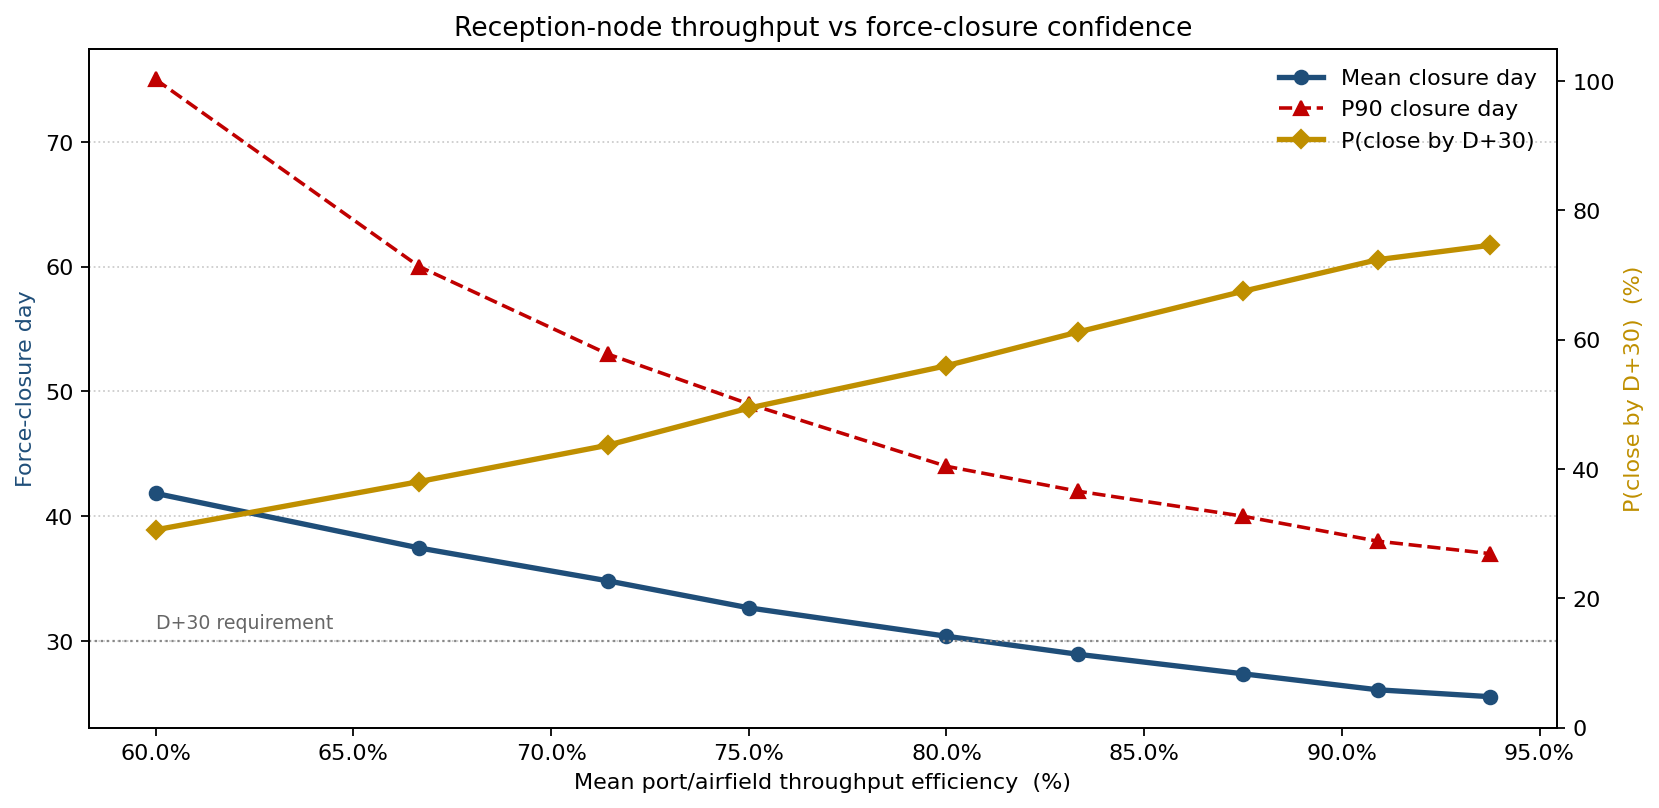
Sweeping mean port/airfield throughput efficiency from 60% to 94% shows the reception node — not the lift fleet — is the binding constraint. As efficiency climbs, mean closure falls from 42 days to 25 days and P(close by D+30) rises from 31% to 75%. Investing in materials-handling equipment, ramp space and labor at the destination is the highest-leverage move on the board. But the curve flattens before it reaches 90%: even at 94% port efficiency, the shared theatre-tempo risk floors the flow, so reception-node improvements alone cannot push closure confidence past about three-in-four. Buying down the last stretch of risk requires reducing the tempo/threat exposure itself — pre-positioning, additional sealift, or an earlier start — not just a faster port.
What drives closure time
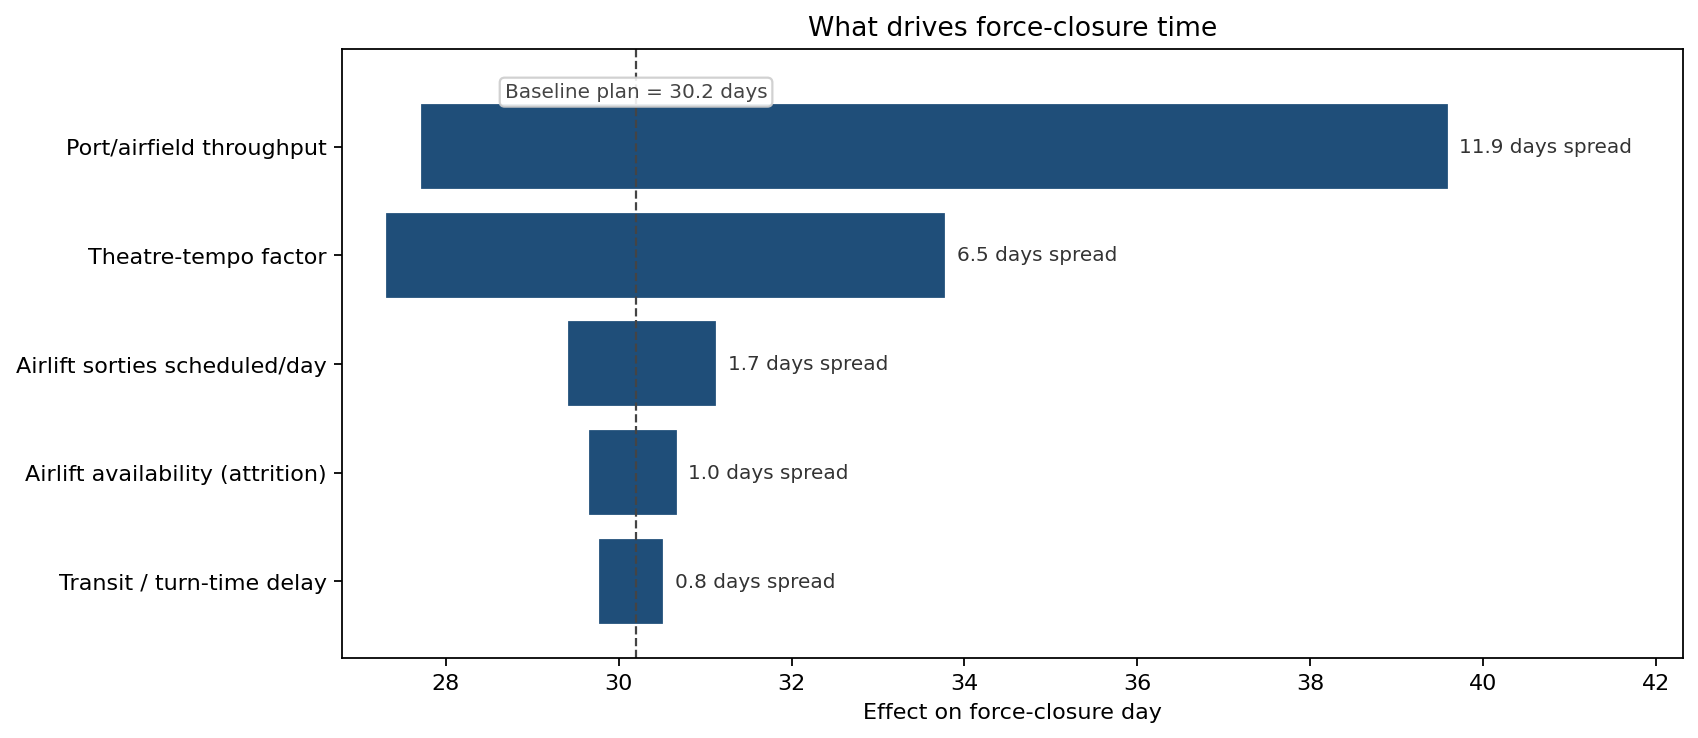
Around the 30-day baseline, the tornado is unambiguous. Port/airfield throughput is the largest driver — a swing from a congested to a high-performing reception node moves closure by about 12 days, and asymmetrically: a bad port adds 9 days while a good one saves only 2.5, because there is a floor on how fast a ship can be cleared. The theatre-tempo factor is second (~6.5 days), confirming why the throughput sweep cannot reach 90% alone. Airlift sorties, asset availability and transit time follow well behind — a direct rebuttal to the instinct to "throw more aircraft at it" when the bottleneck is on the ground in theatre.
What the model changed
- The D+30 requirement was restated as a probability, not a date. The 57% baseline confidence forced an explicit decision about how much closure risk the operation could accept.
- Reception-node throughput became the funded priority — port-handling equipment and ramp/berth augmentation — after the sweep showed it lifting P(close by D+30) from 57% toward 75%, far outweighing additional airlift.
- A sealift uplift and earlier movement start were added to attack the residual theatre-tempo risk the port investment could not reach, recognizing the 90% confidence target needs both levers.
- Planning shifted from the 16-day nominal timeline to the P90 of 44 days for sequencing follow-on forces, removing the optimistic-closure assumption that had cascaded into downstream schedules.
ModelRisk Functionality Used
- Day-by-day throughput simulation across 20,000 deployments — Poisson airlift and sealift arrivals, Beta efficiency and availability factors, and a shared theatre-tempo common factor — producing the closure-day distribution a nominal-capacity plan cannot.
- Port-efficiency sweep mapping P(close by D+30) from 31% to 75% across reception-node performance, identifying the binding constraint and showing where its leverage runs out.
- Tornado analysis ranking port/airfield throughput (≈12 days of swing) above the theatre-tempo factor and far above airlift capacity — redirecting investment from lift to reception.
- Input-distribution panel documenting the Beta and Triangular assumptions behind every throughput factor, so the closure forecast is auditable rather than asserted.
A movement plan written against rated capacity and a calm theatre is a plan for a deployment that closes on paper and slips in execution; the staff that mistakes its 16-day nominal timeline for a 16-day promise is the one that arrives late. ModelRisk turns "when does the force close?" into "what is the probability it closes by D+30, and which lever moves that number most?"