

Industry: Defense
Product: ModelRisk
Application: Defense strategy simulation
The Highest-Scoring Strategy On Average Was The Best Choice In Only 37% Of Futures.
A defense planning agency had to commit to one of four force-structure investment strategies for the next decade. Ranked on a single point estimate of mission-effectiveness-per-dollar, the modular/adaptive strategy won — payoff 1.445 against 1.428 for the balanced hedge, 1.399 for the legacy heavy force, and 1.239 for the tech-forward portfolio. A committee reading that table picks the modular strategy and moves on. The Monte Carlo version, run across 100,000 uncertain futures in ModelRisk, says the modular strategy is the single best choice in only 37% of those futures — and that which strategy wins flips entirely depending on how technologically disruptive the world turns out to be. The point-estimate ranking was answering a question the agency wasn't actually asking.
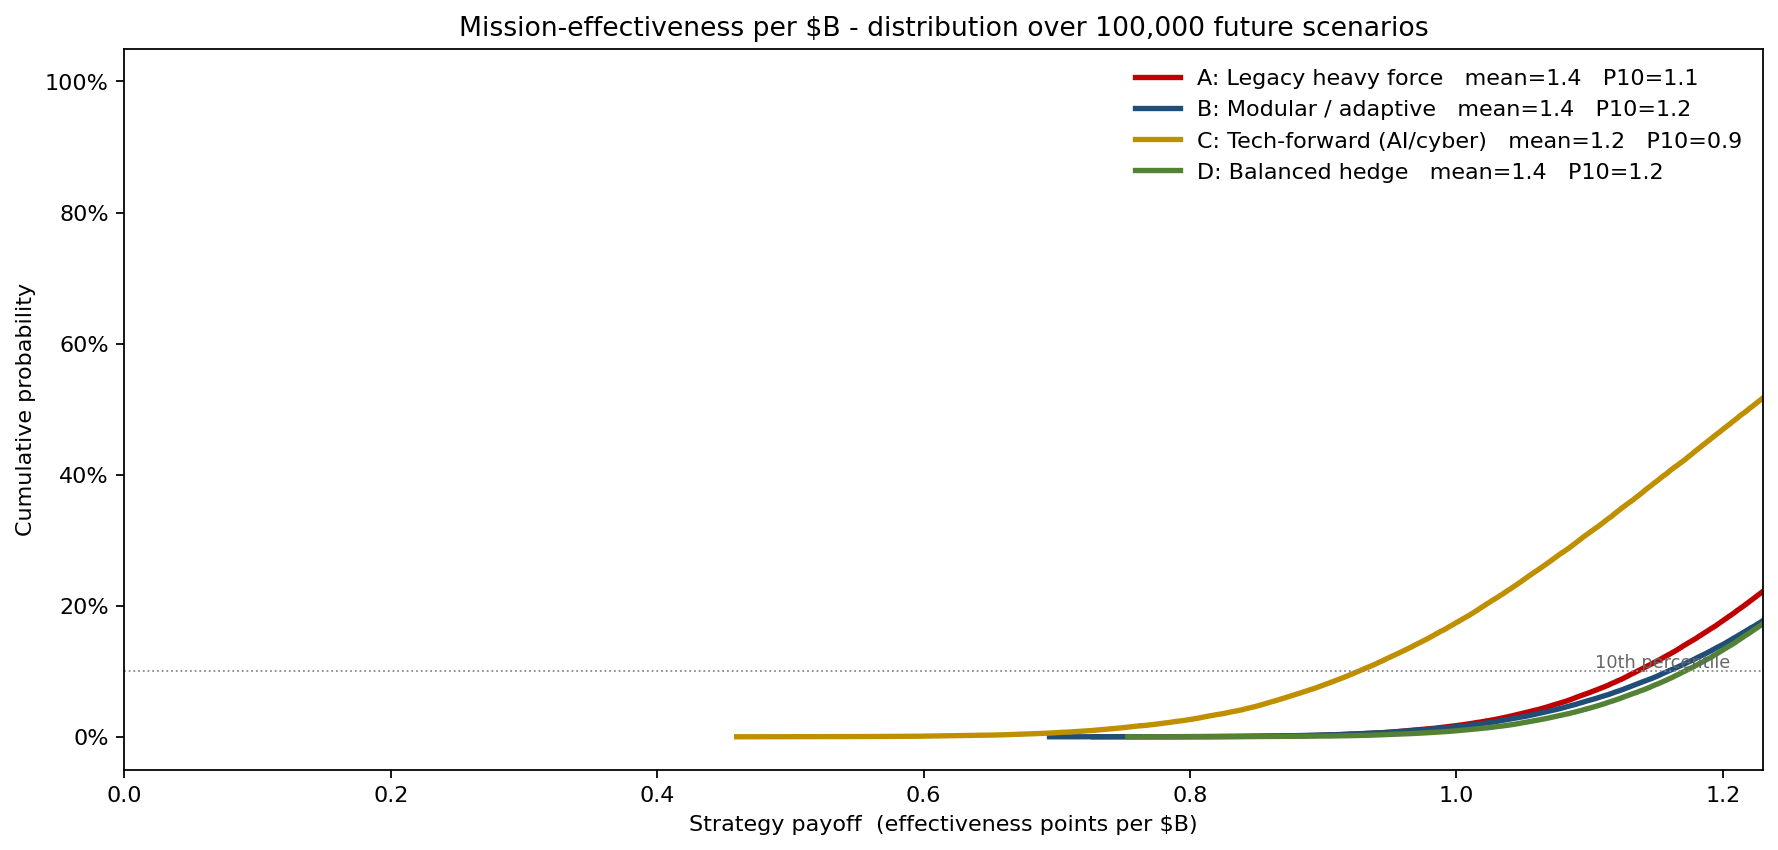
The agency rebuilt its strategy-selection model in ModelRisk to score every candidate strategy across a common ensemble of futures rather than against one assumed future. Each simulated future draws three shared scenario drivers — threat intensity, adversary tech-disruption, and the realised budget factor — and all four strategies are scored under the same drawn future, so the comparison is a fair head-to-head every trial. The strategies differ in how exposed they are to those shared drivers. The resulting payoff distributions, over 100,000 futures, are the picture the ranking table collapsed:
Why a point-estimate ranking fails
A single-number ranking assumes one future. Real strategic choice is a bet placed before the future is known, and the strategies are not just different — they are differently exposed. The legacy heavy force scores well in a low-disruption world and collapses in a high-disruption one; the tech-forward portfolio does the reverse. Because every strategy in a given trial is scored under the same shared scenario draw (one threat level, one disruption level, one budget realisation), the model captures the real correlation structure: a bad future is bad for several strategies at once, but not equally. That is exactly the information a mean discards. Scoring each strategy against its own private "expected" future — the deterministic shortcut — would rank them on averages that no single future ever delivers, and would never reveal that the favourite loses two times in three.
The downside, not just the average
The CDFs above are read at the P10 — the downside / worst-case readout that matters for a robustness-minded planner. The modular strategy's mean payoff is 1.445, the highest, but its P10 is 1.159; the balanced hedge has a slightly lower mean of 1.428 yet a slightly better P10 of 1.171 — it gives up a little upside for a firmer floor. The tech-forward portfolio is the cautionary tale: a mean of 1.239 and a P10 of just 0.927, the steepest downside of the four. A committee optimising for the average would never see that the tech-forward bet carries roughly 25% more downside than its mean suggests.
Mean, tail, and how often each actually wins
Comparing the strategies on mean, P90 and P99 together — and on how often each is the single best choice across the ensemble — reframes the decision:
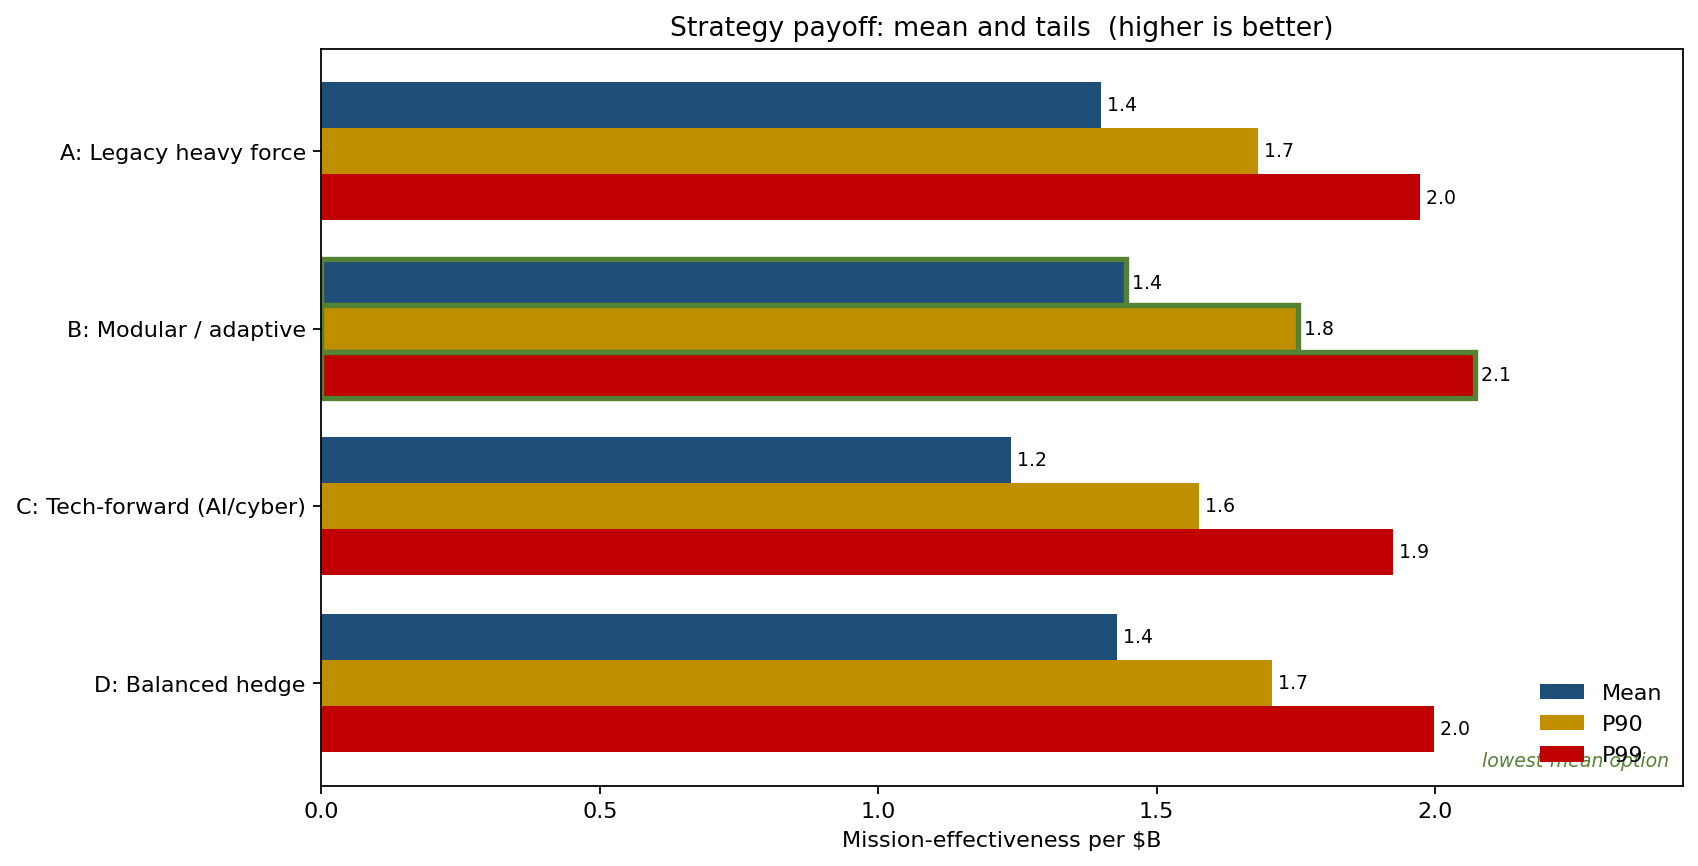
The modular strategy leads on mean (1.445) and on the P90 upside (1.754), and is the single best choice in 37.2% of futures. But the balanced hedge wins 28.3% of futures and the legacy force 24.7% — between them they are the right call in more than half of all futures, despite ranking second and third on the average. Head-to-head, the modular strategy beats the balanced hedge in only 54% of futures: a near coin-flip, not the decisive edge the 1.445-versus-1.428 gap implies. The tech-forward portfolio is best in only 9.8% of futures — but those are not random futures, which is the point of the next chart.
Where the ranking comes from
Decomposing the modular strategy's payoff into its drivers shows where its uncertainty originates:
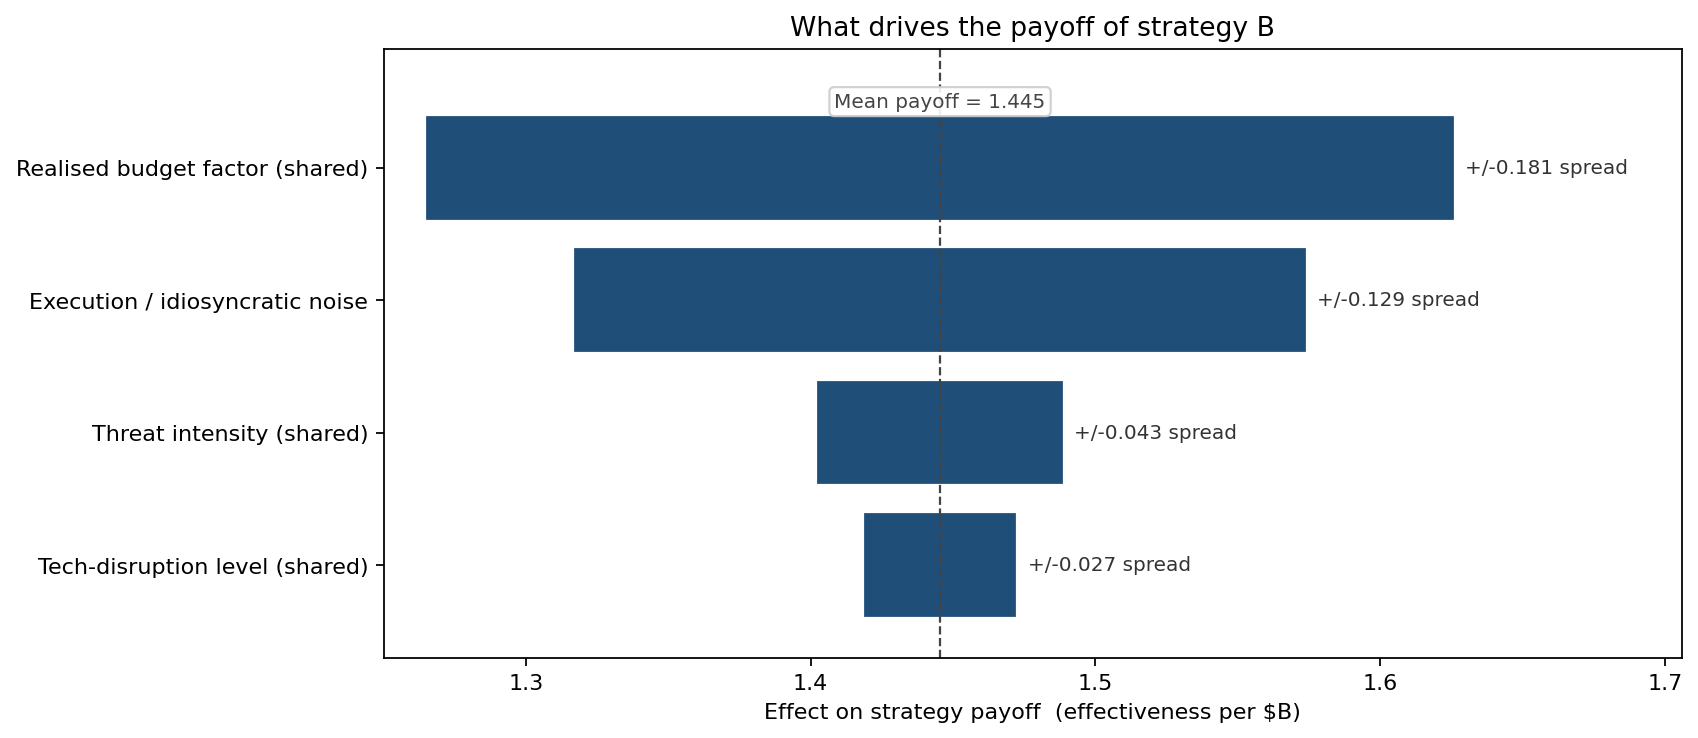
The dominant driver is the realised budget factor (±0.181), because payoff is effectiveness per dollar and the denominator swings the ratio hardest. Execution / idiosyncratic noise is next (±0.129), then threat intensity (±0.087 spread) and tech-disruption (±0.054 spread) — modest for this strategy precisely because the modular force was designed to be insensitive to disruption. That low tech-disruption sensitivity is the modular strategy's whole thesis, and the tornado confirms it holds. A strategy whose tornado was dominated by tech-disruption would be the wrong robust choice no matter its mean.
The ranking reverses with the future
The single most important output is that the best strategy is not a fixed answer — it depends on how disruptive the realised future is. Binning the futures by adversary tech-disruption level and computing each strategy's share-of-best within each bin gives the reversal directly:
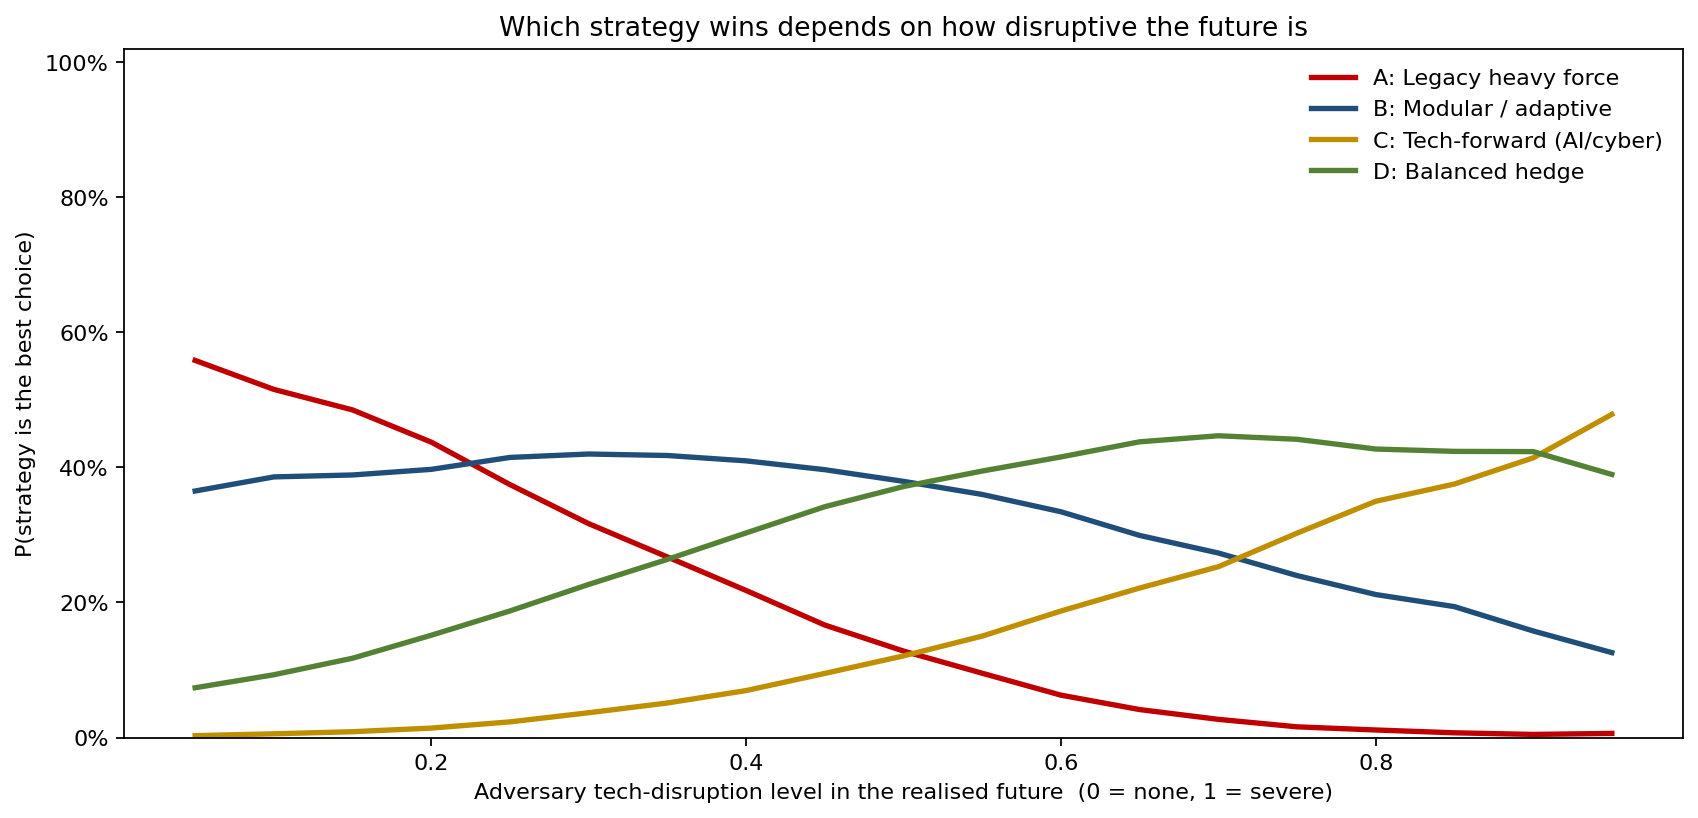
In a low-disruption future (level 0.05) the legacy heavy force is best 56% of the time and the tech-forward portfolio essentially never wins. In a high-disruption future (level 0.95) the picture inverts: the tech-forward portfolio overtakes every rival above a disruption level of ~0.95, peaking near a 48% share, while the legacy force collapses to 1%. Around the middle (level 0.5) the modular and balanced strategies share the lead at ~37–38% each. The overall "winner" the point estimate reported is just the strategy that happens to do least badly averaged over a disruption distribution the agency had only assumed. Change the assumed likelihood of a disruptive adversary and the recommendation changes — which is the single fact the deterministic ranking could never surface.
What the model changed
- The recommendation became conditional, not absolute. Instead of "adopt the modular strategy," the output was "the modular and balanced strategies are co-favourites under a moderate-disruption assumption; a firm belief in high adversary disruption argues for tech-forward hedging." The agency carried a disruption-contingent decision rule forward.
- A hedge was added against the downside tail. The tech-forward portfolio's P10 of 0.927 — 25% below its mean — justified capping its share of the budget rather than treating it as interchangeable with the others on mean payoff.
- The "decisive favourite" framing was retired. A 54% head-to-head win rate is a coin-flip; the committee stopped treating the 1.445-versus-1.428 ranking as a clear winner and demanded the share-of-best and downside numbers on every future comparison.
- Robustness replaced point optimisation. The balanced hedge's firmer P10 floor, despite a lower mean, made it the choice for planners weighting worst-case survivability over expected performance.
ModelRisk Functionality Used
- Monte Carlo scenario simulation generating 100,000 futures from three shared scenario drivers (Gamma threat intensity, Beta tech-disruption, LogNormal budget factor) and scoring all four strategies under each drawn future.
- A shared scenario common factor ensuring every strategy is evaluated against the same future each trial — the dependence structure that makes the head-to-head comparison and the share-of-best statistics meaningful.
- Bounded effectiveness modelling clipping each strategy's mission-effectiveness score to [0, 100] before forming the effectiveness-per-dollar payoff.
- Distribution outputs and percentile readouts (mean, P10 downside, P90/P99 tails) per strategy, plus the probability each strategy is the single best choice.
- Tornado sensitivity decomposing the chosen strategy's payoff into its shared and idiosyncratic drivers, confirming its low tech-disruption exposure.
- A scenario sweep of share-of-best against the tech-disruption level, exposing the ranking reversal that drove the conditional recommendation.
A strategy chosen on its average score is optimised for a future that will not occur. Chosen on the distribution of outcomes across an ensemble of futures, it is chosen for the world as it might actually arrive — and for how badly it does when the world surprises you. ModelRisk is what turns a ranking table into that ensemble.