

Industry: Defense
Product: ModelRisk
Application: Optimizing Defense Logistics Under Uncertainty
A Four-Spare Pool Meets the 85% Readiness Target Only One Year in Four
A squadron of 24 aircraft each flies with one mission-critical line-replaceable unit (LRU) — say a radar transmit/receive module. When the unit fails the aircraft is grounded, not mission capable (NMC), until a serviceable spare is pulled from the pool; the failed unit goes to the depot and rejoins the pool after a repair turnaround that runs a median of 26 days with a long right tail. With an LRU failing roughly every 60 flying-days per tail and one campaign driving every aircraft's failure hazard up together, the pool empties faster than the depot can refill it. The deterministic readiness spreadsheet — mean failures in, mean turnaround out — reports a comfortable steady-state availability. The simulation reports something the average hides: a four-spare pool meets the 85% mission-capable target in just 26% of deployment-years, while clearing that bar reliably takes far more spares than the headline math suggests.
A defense sustainment command rebuilt its spares-provisioning case in ModelRisk after a deployment in which a "sufficient" pool drained mid-rotation and grounded a quarter of the fleet. The mandate was to size the repairable pool against the distribution of fleet availability — with the readiness probability and the cost of getting it wrong attached — not against a single steady-state number.
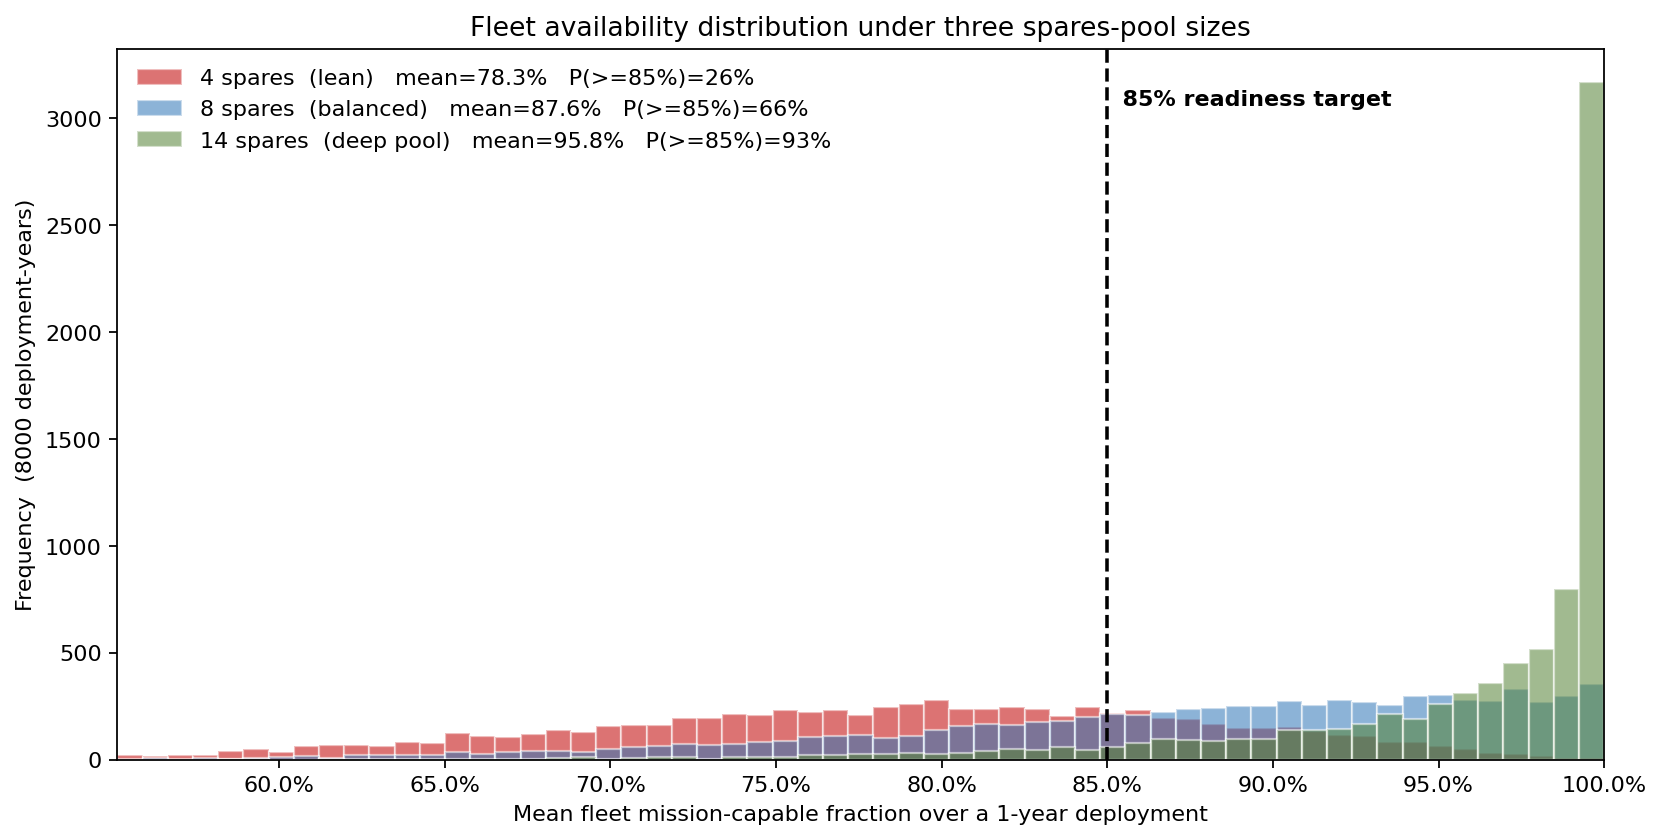
The three pools produce three visibly different availability distributions. The lean four-spare pool centres near 78% and spends most of its mass below the target; the eight-spare pool centres at 88% but still falls short a third of the time; only the deep 14-spare pool sits comfortably to the right of the line. The spread itself — not just where each distribution sits — is the planning signal a mean cannot carry.
A repairable-pool model, not a reorder model
The critical LRU is repaired and recirculated, not consumed and reordered, so this is a repairable-item pool (METRIC-style), not a (Q, r) inventory problem. The simulation tracks each of 24 installed units day by day across an 8,000-deployment-year run:
- Failures — Poisson per aircraft per day at a baseline hazard of about one failure per 60 flying-days. The rate is scaled by a shared deployment-tempo factor — one hot campaign drives every tail's hazard up at once — so failures are not independent across the fleet. That common factor is what gives fleet availability a genuine spread instead of a central-limit-collapsed point.
- Repair turnaround — LogNormal, median 26 days, right-skewed: most repairs clear quickly, but a unit awaiting a sub-component sits in the depot for the long tail that drains the pool.
- Pool logic — a failed unit grounds its aircraft; a serviceable spare (if one exists) is installed immediately; the failed unit enters the depot pipeline and returns after its turnaround. An aircraft with no spare available stays NMC.
Readiness is the fraction of the fleet mission-capable, averaged over a one-year deployment. The deterministic model uses mean failures and mean turnaround and never sees the days when a tempo spike and a clutch of long repairs coincide — exactly the conjunction that empties the shelf.
Why a point estimate fails here
Run at the means, the four-spare pool looks adequate: failures arrive at a steady rate, repairs return at a steady rate, and the shelf appears to hold. But availability is driven by the coincidence of a high-tempo stretch and several long repairs landing together — a tail event the mean cannot represent. The simulation prices it directly:
- 4 spares: mean availability 78.3%, P10 just 65.4%, and only a 26% chance of holding the 85% line across the year.
- 8 spares: mean 87.6%, but still a 34% chance of falling short.
- 14 spares: mean 95.8%, P10 87.2%, and a 93% chance of meeting the target.
The point estimate that "78% average is close enough to 85%" is wrong in the only sense that matters: three years in four, that pool misses.
Sizing the pool: where readiness and cost actually trade
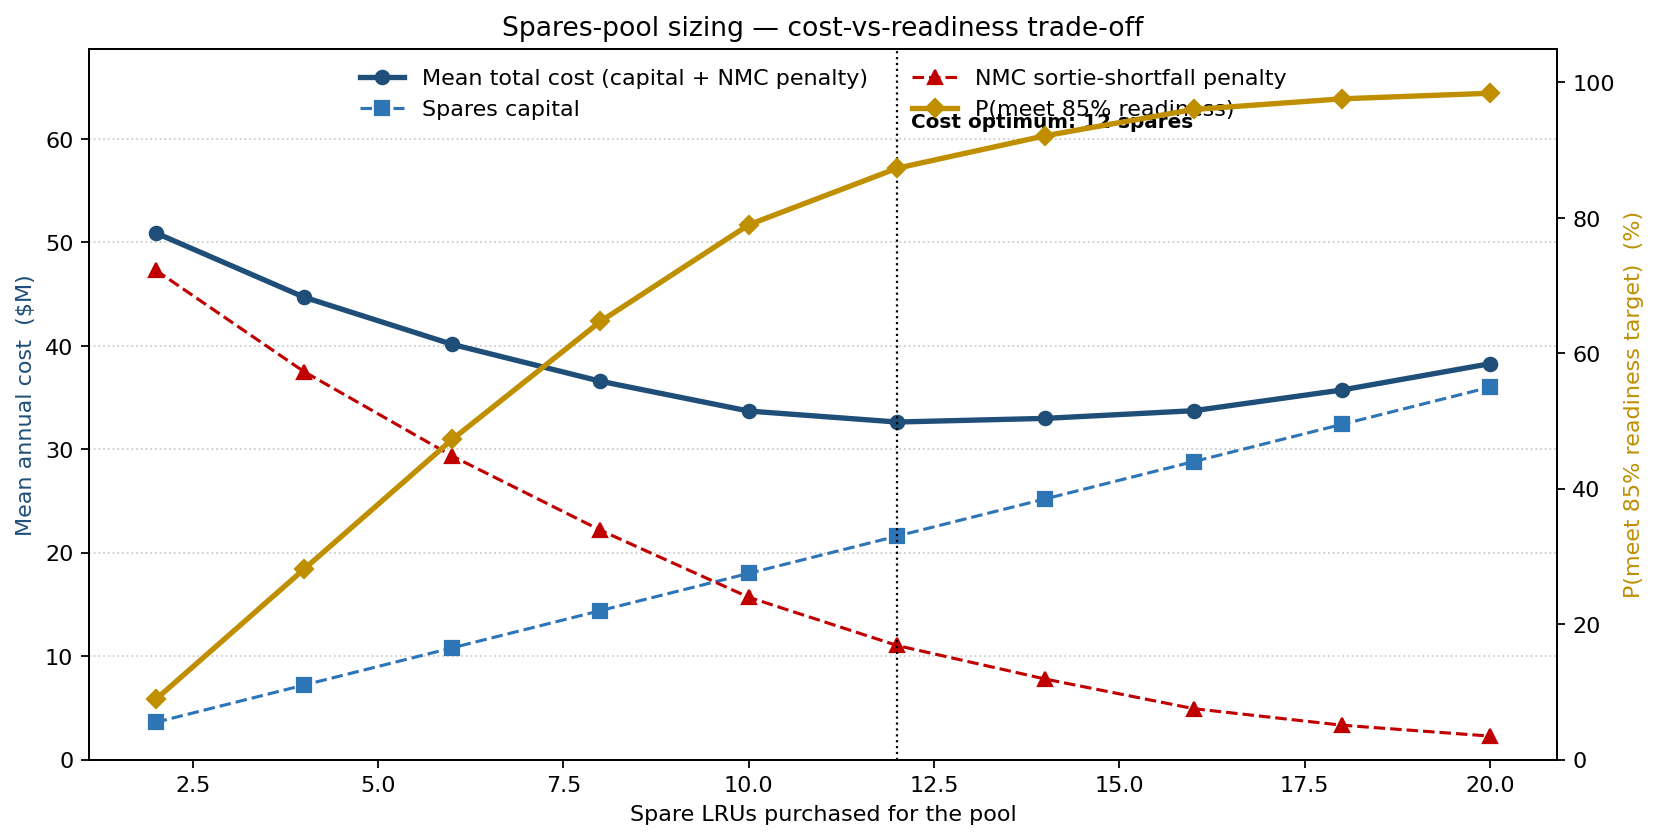
Sweeping the pool from 2 to 20 spares traces the classic U-curve. Spares capital rises in a straight line at $1.8M per unit; the NMC penalty — the cost of grounded sortie capacity, here $20k per aircraft-NMC-day — falls steeply as the pool deepens. Total cost bottoms out at a 12-spare pool ($32.6M), the cost optimum. But that optimum still meets the readiness target only 87% of the time. Pushing to 14 spares is the first point that clears 90% assurance (92%), for roughly $0.4M more than the cost minimum — a rounding error against the capital cost of a single grounded airframe's lost availability. The cost-optimal pool and the readiness-optimal pool are nearly the same price, and only the simulation reveals that, because the deterministic comparison sees the mean cost but never the readiness frequency.
What drives not-mission-capable days
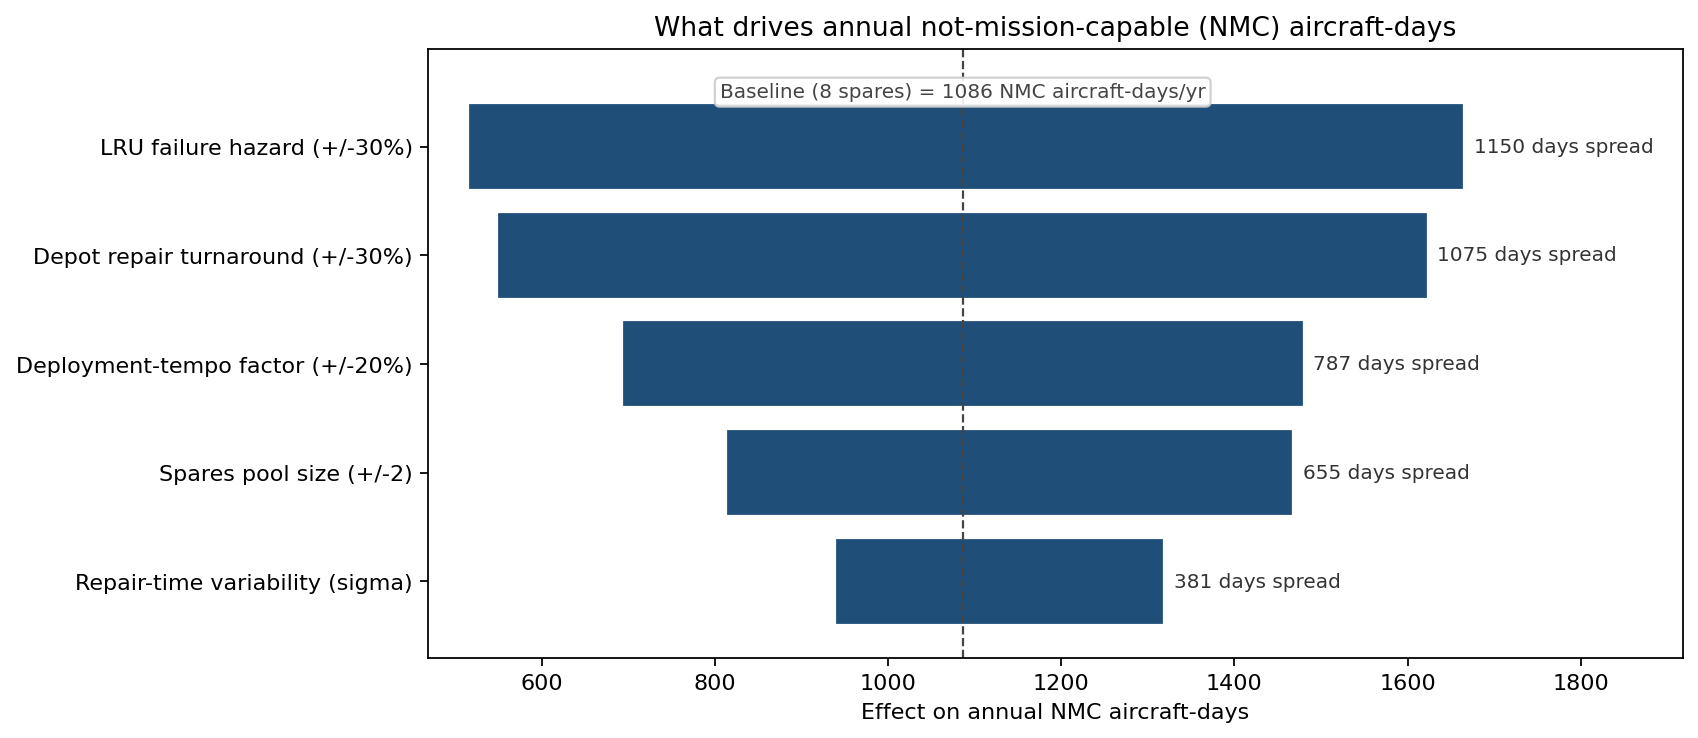
Around the eight-spare pool — baseline of 1,086 NMC aircraft-days a year — the tornado ranks the controllable levers. LRU failure hazard dominates (a ±30% swing moves NMC days by about 1,150), followed closely by depot repair turnaround (±30% → ~1,075 days). The deployment-tempo common factor is third; pool size and repair-time variability follow. The reading is direct: the cheapest path to higher readiness is not always more spares — cutting median repair turnaround moves the NMC number nearly as hard as buying inventory, and a faster depot raises availability and lowers the spares bill.
Holding the readiness bar reliably
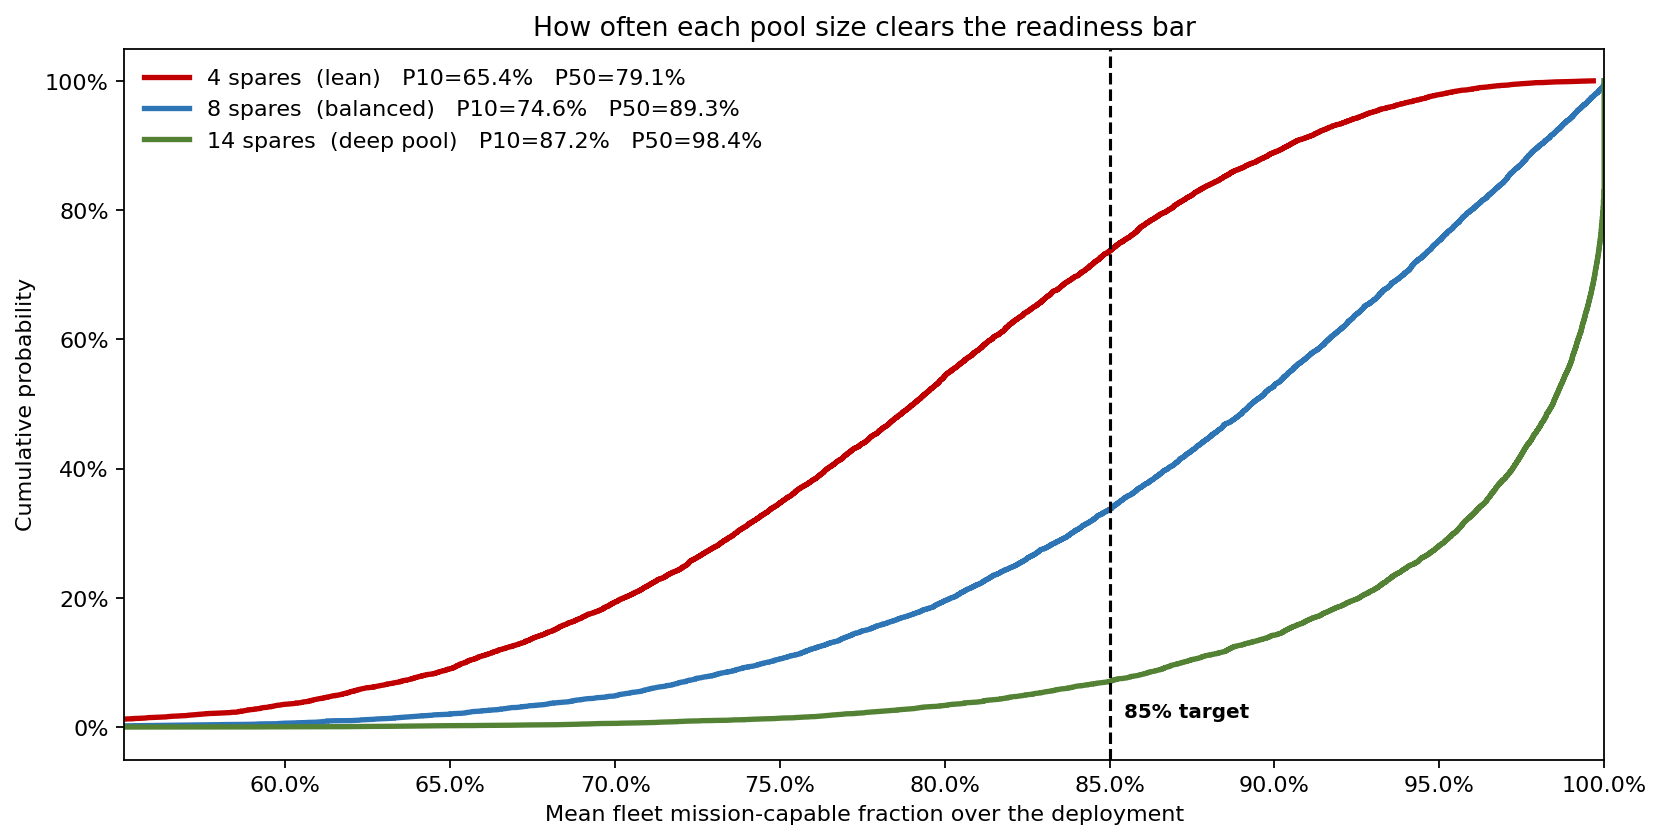
The cumulative view makes the assurance gap explicit. With four spares, availability falls below the 85% target in 74% of deployment-years; with eight spares, 34%; with fourteen spares, just 7%. Reading the curve the other way: the deep pool delivers a P10 availability of 87%, meaning even a bad year clears the bar — the property a standing readiness commitment actually requires, and the property a single mean availability figure can never demonstrate.
What the model changed
- Pool standardized at 14 spares per critical LRU, not the cost-minimizing 12 — the readiness-optimal point, about $0.4M above the cost floor — because the marginal spend buys the jump from 87% to 92% assurance.
- A depot-turnaround reduction program was funded ahead of additional inventory once the tornado showed repair turnaround moving NMC days almost as hard as the failure rate itself.
- The deployment-tempo factor was written into the provisioning case, so surge rotations now carry a pre-positioned spares uplift rather than discovering the shortfall mid-campaign.
- Expected NMC exposure fell from 1,897 aircraft-days (lean pool) to about 372 (deep pool) — the grounded-sortie cost saved several times over the added spares capital.
ModelRisk Functionality Used
- Repairable-pool simulation across 8,000 deployment-years — Poisson failures with a shared tempo factor, a LogNormal depot pipeline, and day-by-day fill logic — producing the full fleet-availability distribution the steady-state formula cannot.
- Spares-level sweep tracing the cost U-curve and the readiness curve from one engine, exposing the gap between the cost-optimal (12) and readiness-optimal (14) pool.
- Tornado on NMC aircraft-days ranking failure hazard and repair turnaround as the top two drivers — redirecting the next dollar toward faster repair, not just more inventory.
- Readiness CDF quantifying P(availability ≥ 85%) at 26%, 66% and 93% for the three pools, with the deep pool's P10 of 87% proving even a bad year clears the bar.
A readiness plan written against mean failures and mean turnaround is a plan for an average year that never quite happens; the spare pool sized to that average is the one that runs dry in the campaign that counts. ModelRisk turns "how many spares is enough?" into "what is the distribution of fleet availability, and what is the cheapest pool that holds the line in a bad year?"