

Industry: Defense
Product: ModelRisk
Application: Cyber defense
Four Controls Should Leak 0.65% of Attacks. Correlated Adversaries Push It to 2.46%
A defense contractor's network sees thousands of intrusion campaigns a year, but only a vanishing fraction become an actual breach. The reason is structural: an attacker has to clear four sequential controls — reconnaissance/initial access, exploitation, persistence/privilege escalation, and exfiltration — and failing any one stops the campaign cold. The board doesn't want a colour-coded heat map; it wants a number: what is the probability a campaign clears all four gates, and which gate is the cheapest to make harder? Rebuilt in ModelRisk over 200,000 simulated campaigns, the answer was P(full breach) = 2.46% per campaign — and the right gate to harden was not the one the qualitative scorecard had flagged.
The legacy assessment multiplied four stage scores together as if they were independent: a "defence-in-depth product." That arithmetic gave 0.65%. The simulation that respects how real adversaries behave gave 2.46% — 3.8× higher — because stage outcomes are not independent. A campaign run by a capable adversary tends to clear every gate; a script-kiddie campaign dies at the first hard one. Modelling that shared adversary capability is the whole game.
Why a point estimate fails here
The independent-stage product is seductive because it is one line of spreadsheet. But it systematically under-states breach probability, because the events that let a campaign pass exploitation are correlated with the events that let it pass persistence — both are driven by the adversary's underlying skill and resourcing. Treat the stages as independent coin flips and the joint probability of clearing all four collapses far below reality. The model has to draw the adversary's capability once per campaign and let it tilt every gate together; only then does the aggregate breach probability come out right.
Modelling the kill chain with a shared adversary factor
Each gate has a baseline per-stage pass probability drawn from a Beta distribution (Beta is the natural choice for a bounded probability — never a Normal). On top of that, every campaign draws a single adversary-capability factor from a Beta(2, 3) (mean 0.40, ranging from weak to elite). That factor is applied as a logistic tilt to all four gates at once: a high-capability campaign sees its effective pass probability pushed up at every stage; a low-capability one is pushed down everywhere.
The coupling is real, not decorative, and the simulation confirms it empirically:
- The correlation between "cleared exploitation" and "achieved full breach" is φ = 0.359 — strongly positive, exactly what a shared driver produces.
- Splitting campaigns by capability, the top 20% by capability breach at 9.2%, while the bottom 20% breach at 0.032% — a 285× ratio. The threat is concentrated in a small number of capable adversaries, which is precisely what the independent-stage math cannot represent.
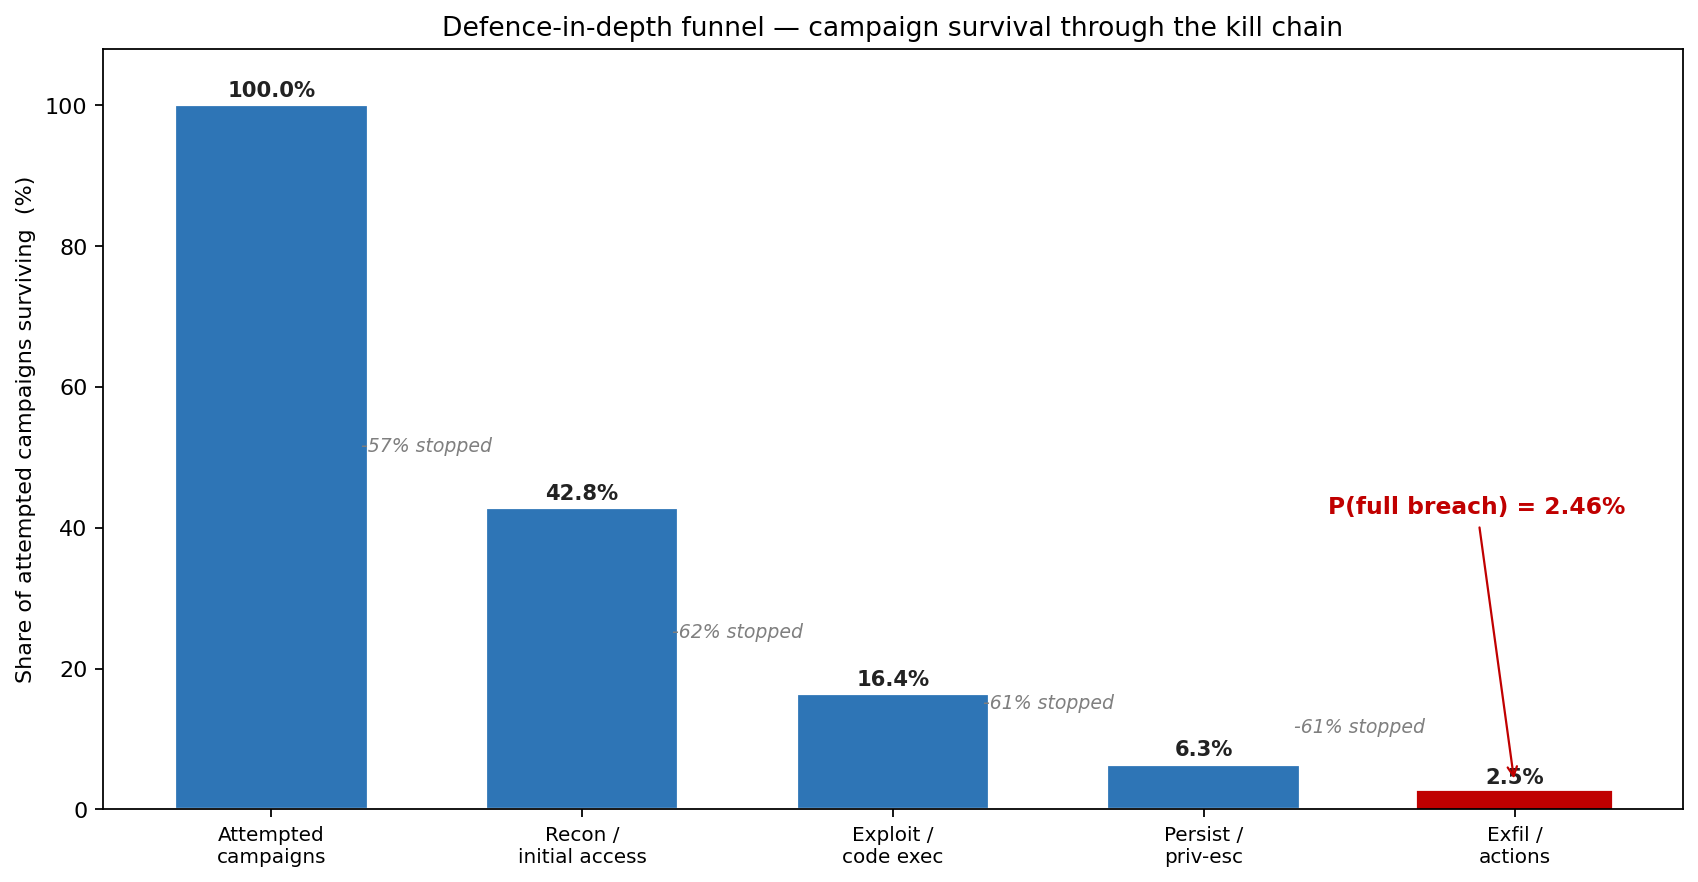
The survival funnel reads:
- Reconnaissance / initial access: 42.8% of attempted campaigns survive (57% stopped at the perimeter).
- Exploitation / code execution: 16.4% still alive.
- Persistence / privilege escalation: 6.3% still alive.
- Exfiltration / actions on objective: 2.46% — the full-breach rate.
Most campaigns are hopeless; a capable few are dangerous
Because capability is drawn per campaign, the end-to-end clear probability is wildly skewed across campaigns rather than constant.
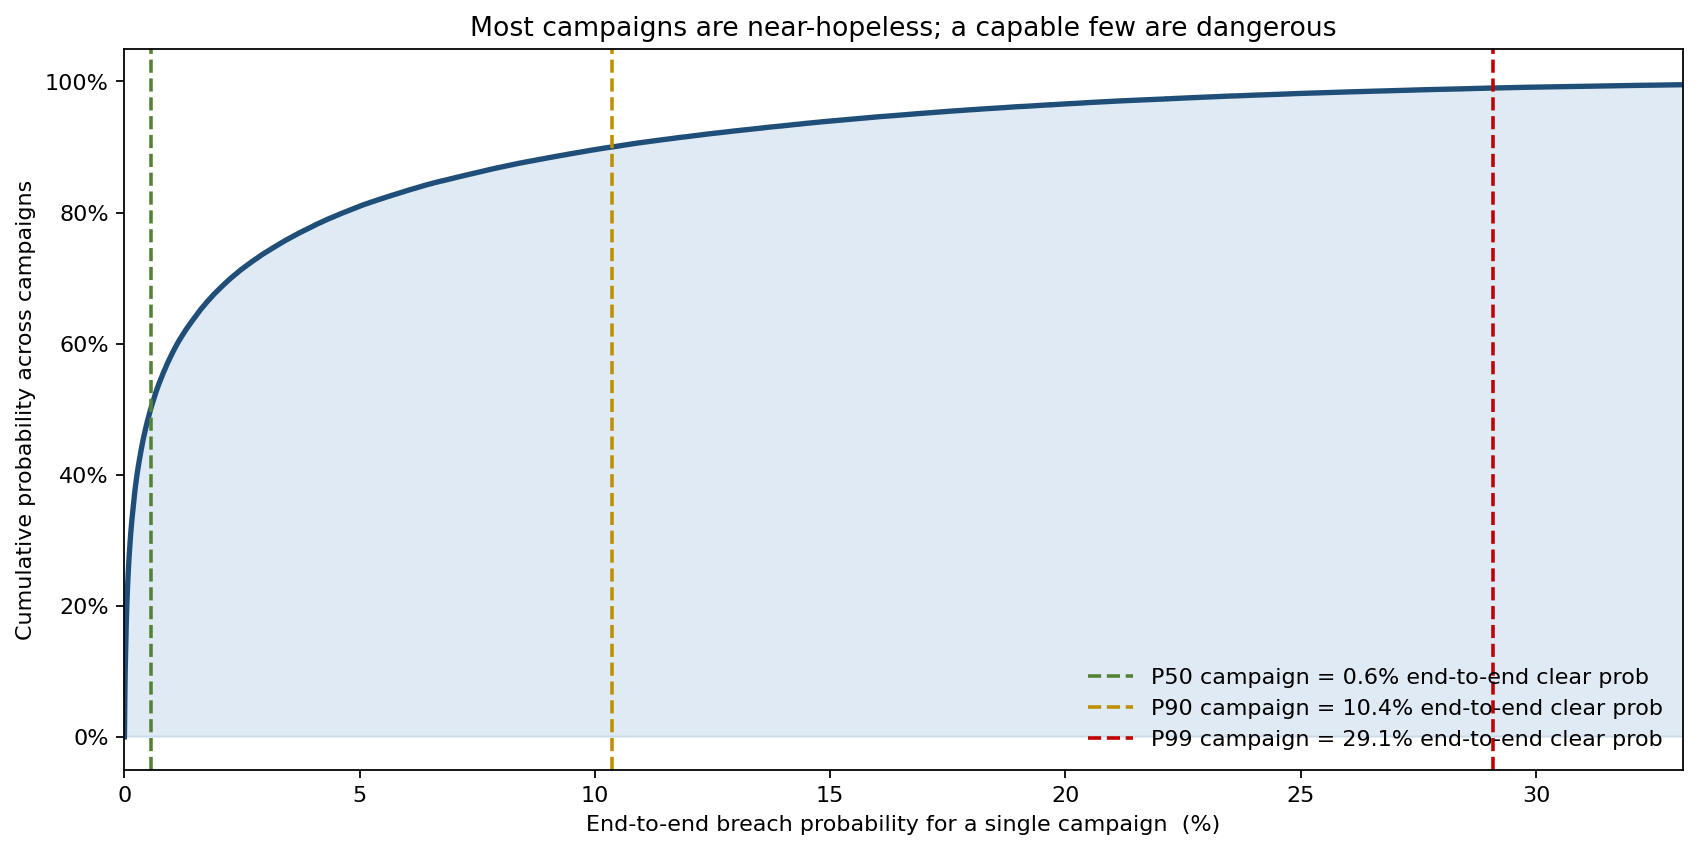
The median campaign has only a 0.6% chance of clearing all four gates. The P90 campaign sits at 10.4%, and the P99 campaign at 29.1%. The average breach probability is dominated by the thin upper tail of capable adversaries — a single mean figure hides the entire risk concentration. This is why "average attacker" assumptions in deterministic models give such misleading defensive priorities.
Which layer to harden
The decision the contractor actually faced was where to spend the next hardening dollar. Each control layer was stiffened in turn (raising its Beta failure weight by a fixed amount, equivalent to a meaningful but realistic control upgrade) and the resulting drop in P(full breach) measured.
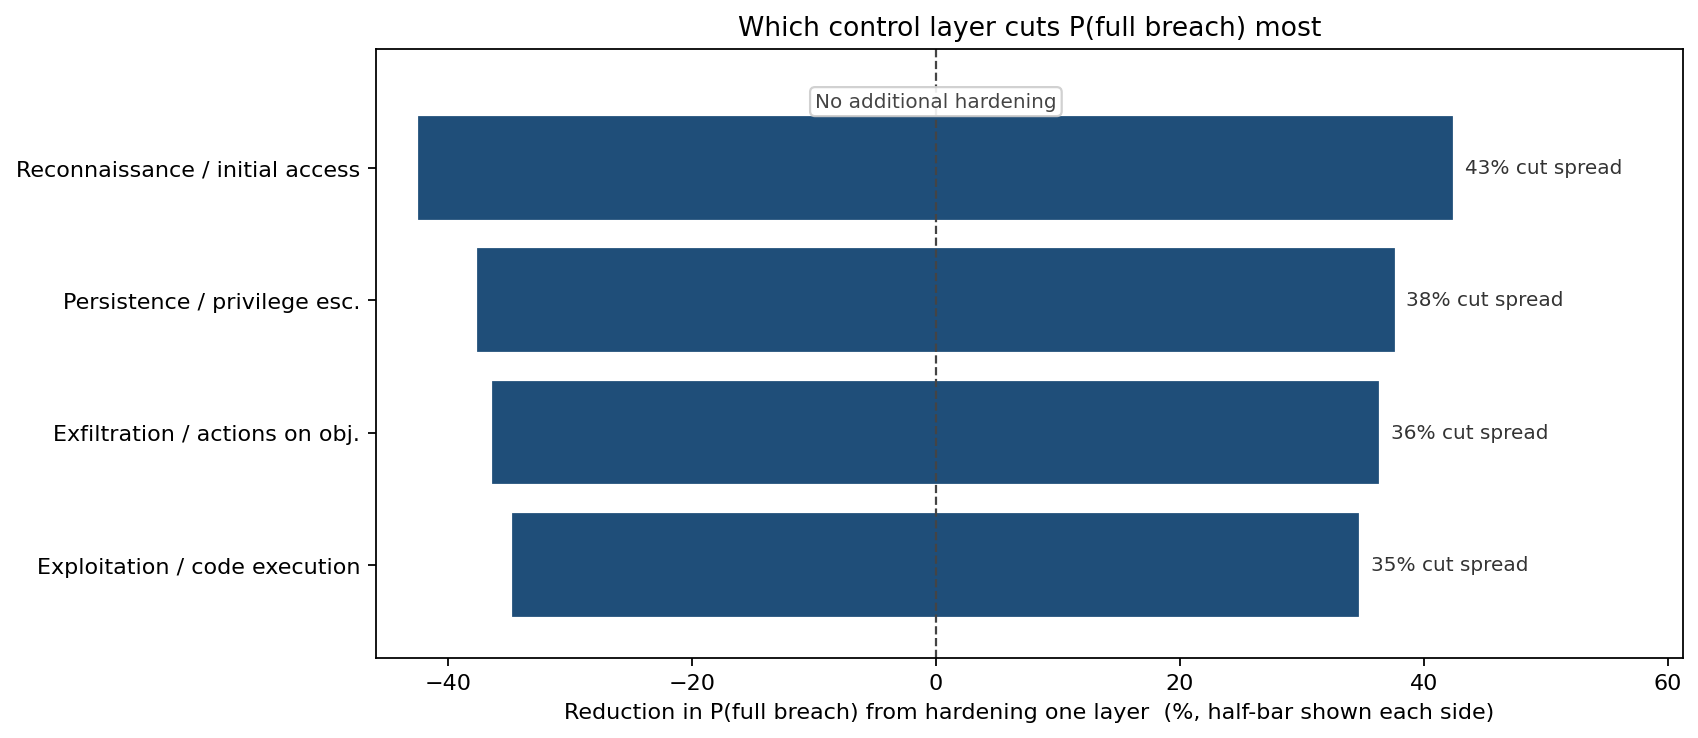
- Hardening reconnaissance / initial access cuts P(breach) by 43% — the largest single-layer gain. Stopping campaigns at the perimeter removes the most volume before capability has a chance to compound.
- Persistence hardening cuts 38%, exfiltration 36%, exploitation 35% — closely matched, because a shared-capability adversary that beats one inner gate tends to beat the others too, so blocking any one inner gate has similar marginal value.
Layered hardening beats single-layer hardening
The more important finding is that single-layer fixes hit diminishing returns, while combining two inner-gate controls is multiplicative against the same capable adversaries.
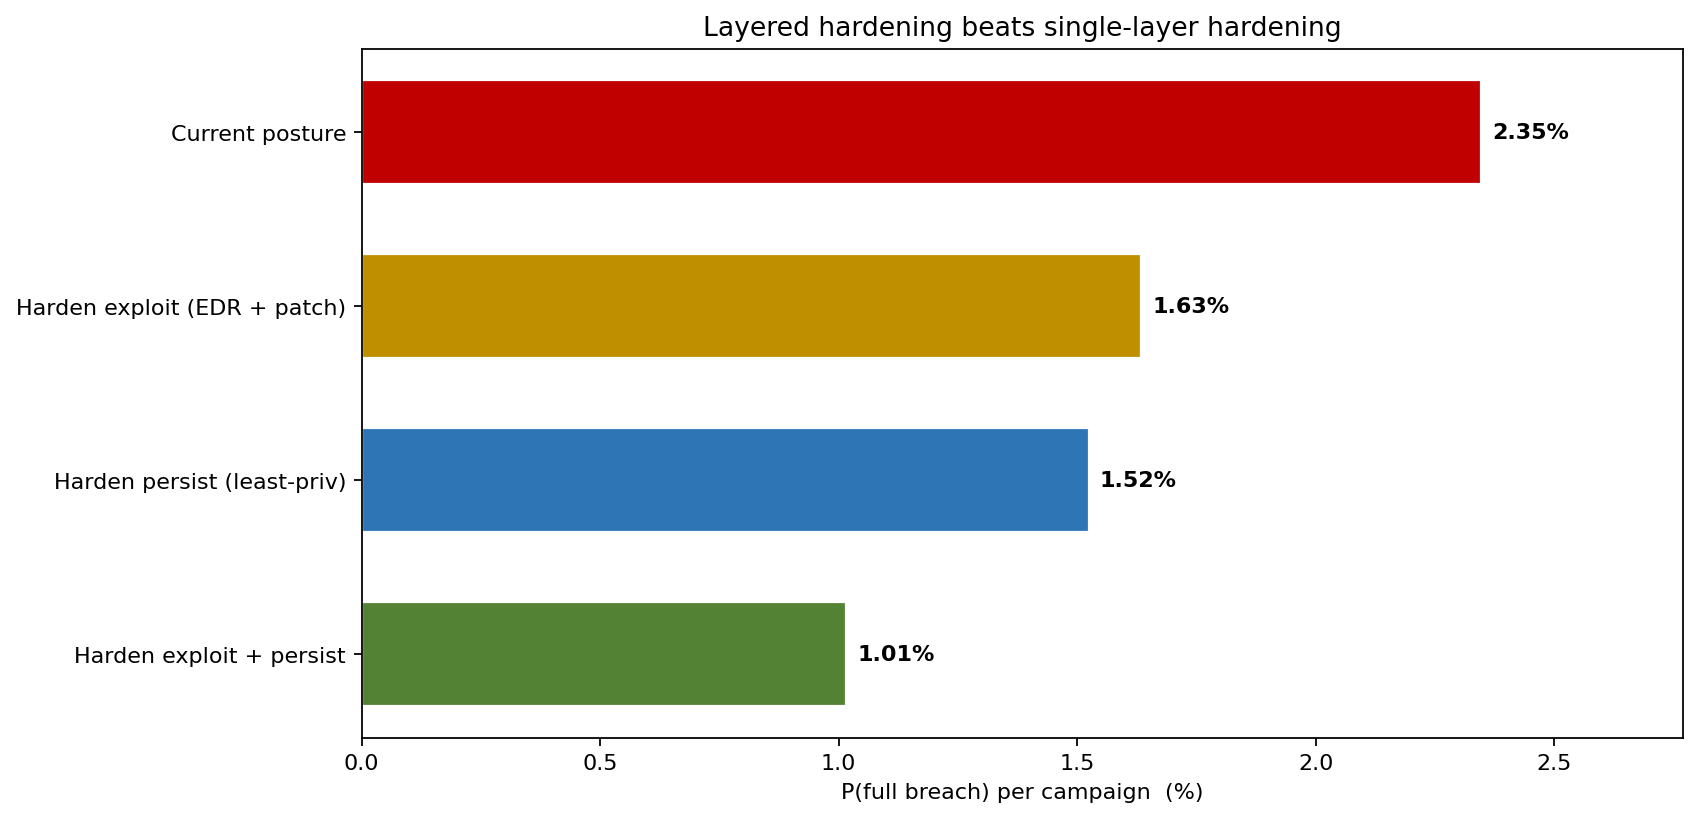
- Current posture: 2.45% breach per campaign.
- Harden exploitation (EDR + patch cadence) alone: 1.55%.
- Harden persistence (least-privilege) alone: 1.52%.
- Harden exploitation + persistence together: 1.01% — a 59% reduction, materially better than the sum of the two single-layer gains, because forcing a capable adversary through two stiffened inner gates compounds.
What the model changed
- The security investment case stopped citing a single "defence effectiveness %" and started citing P(full breach) per campaign (2.46%) and its 285× capability skew — a number that survives board scrutiny because it shows where the risk actually concentrates.
- Budget shifted toward perimeter/initial-access hardening (the 43% single-layer winner) plus a paired EDR + least-privilege programme (the 59% combined winner), instead of the scorecard's even spread across all four layers.
- The team retired the independent-stage product entirely, having seen it understate the breach rate by 3.8×.
ModelRisk Functionality Used
- Beta-distributed per-stage pass probabilities for all four kill-chain gates — the correct bounded-probability family, replacing the static stage scores.
- A single shared adversary-capability draw per campaign applied as a logistic tilt across every gate — the common factor that lifted modelled breach probability from 0.65% to 2.46% and produced the empirical φ = 0.359 stage coupling.
- Monte Carlo over 200,000 campaigns to resolve a 2.46% event with a stable, two-decimal funnel.
- One-at-a-time control hardening to rank layers (initial access −43%) and a four-posture comparison proving exploitation + persistence together (−59%) beats either alone.
- Capability-tercile decomposition showing the top 20% of adversaries breach 285× more often than the bottom 20%.
Defence-in-depth is not a checklist of independent controls multiplied together — it is a probability funnel against an adversary whose skill couples every gate at once, and Monte Carlo is what turns that funnel into the one number a security committee can defend.