

Industry: Defense
Product: ModelRisk
Application: Counter-terrorism decision-making under uncertainty
The Product Rule Said 3% Would Get Through. Correlated Adversaries Made It 11%.
A counter-terrorism screening operation runs five imperfect layers of defence-in-depth: watchlist and document checks, behavioural detection, technical scanners, canine and trace, and a secondary interview. Each layer has a respectable interdiction rate on its own — between 35% and 67% against a typical threat actor. The standard briefing-slide arithmetic multiplies the per-layer miss rates and concludes that only about 3 in 100 threats could possibly survive all five. That product-rule number is the basis on which the screening architecture was certified as "layered and resilient."
The arithmetic assumes the layers fail independently. They do not. A capable adversary — disciplined cover story, clean documents, counter-surveillance training — is harder to stop at every layer at once, not one layer at a time. When that single shared "evasion skill" is modelled explicitly across 120,000 simulated threat actors, the probability that a threat passes all five layers rises to 10.98% — more than three times the independence estimate. The leak the system was certified against was real; it was just three times larger than the slide claimed, and concentrated entirely in the most capable actors the operation most needs to stop.
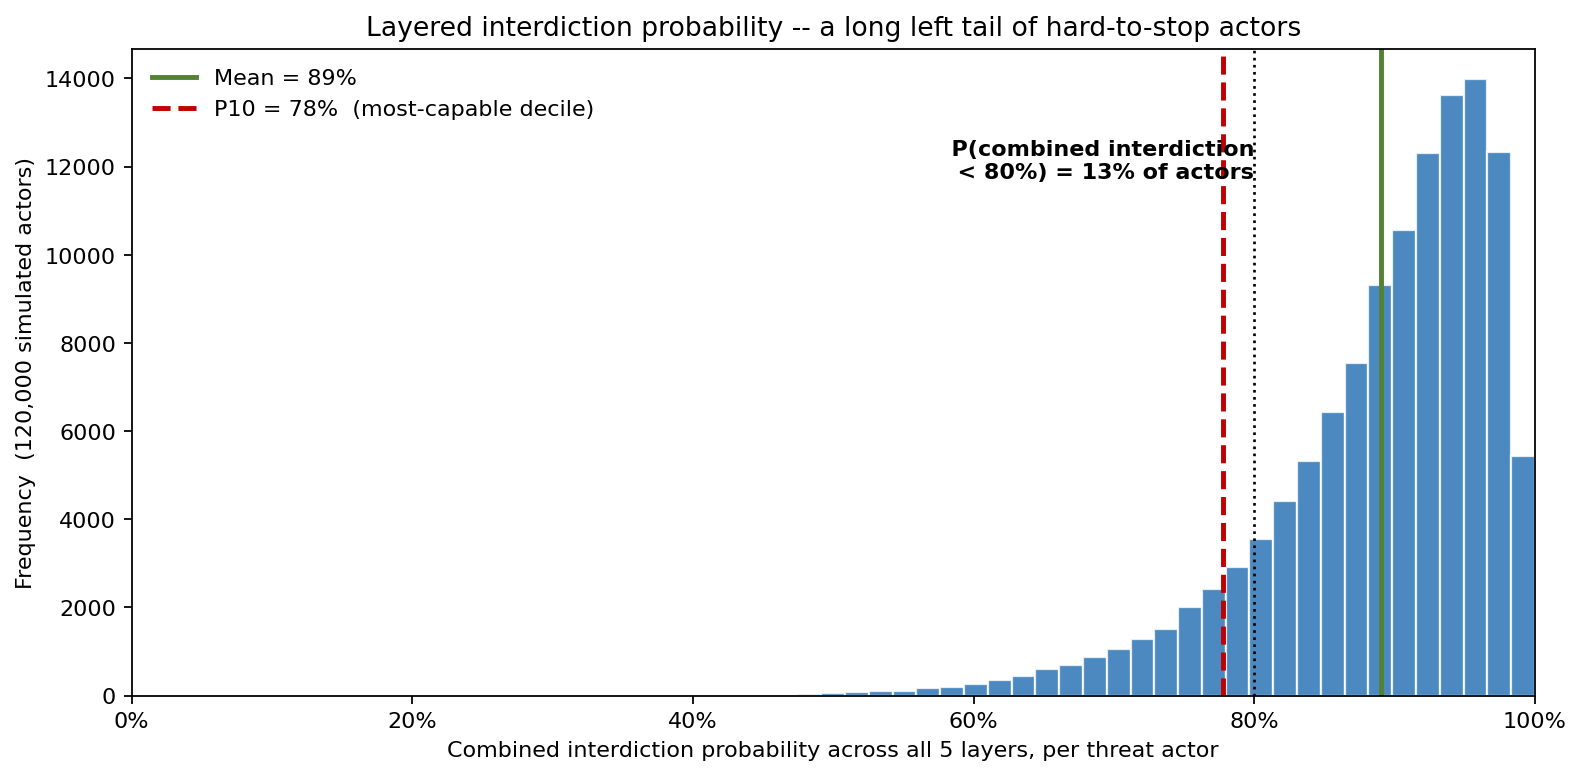
Why a point estimate fails here
The product rule fails for one structural reason: a common factor couples the layers. We model each actor's per-layer interdiction probability as a Beta draw, then suppress it by a shared evasion-skill factor drawn once per actor from a right-skewed Beta. A high-skill actor sees every layer's probability of stopping them depressed together. The empirical check confirms the coupling worked: the Spearman correlation between any two layers' effective interdiction probabilities is +0.24 to +0.26 (it would be ~0 under independence), and the correlation between an actor's skill and their overall interdiction probability is −0.75 — skilled actors are systematically harder to stop everywhere.
That correlation is exactly what fattens the leak. The misses do not cancel across layers; they pile up on the same small population of capable actors. A single number — "97% interdiction" — hides the fact that the system is excellent against the average traveller and weak against precisely the adversary that matters. You cannot see that left tail without simulating the joint behaviour.
The headline distribution
The combined interdiction probability across all five layers, computed per actor, has a mean of 89%, a median of 91%, and a P10 of 78% — meaning the most-capable decile of actors faces a combined interdiction probability of only 78% or less. 13% of actors are interdicted with combined probability below 80%. The distribution is sharply left-skewed: a dense mass of easy-to-stop actors near 95–99%, trailing into a long thin tail of hard-to-stop actors reaching down toward 50%. The mean is reassuring; the tail is the operational reality.
Where threats are stopped — and the leak the product rule misses
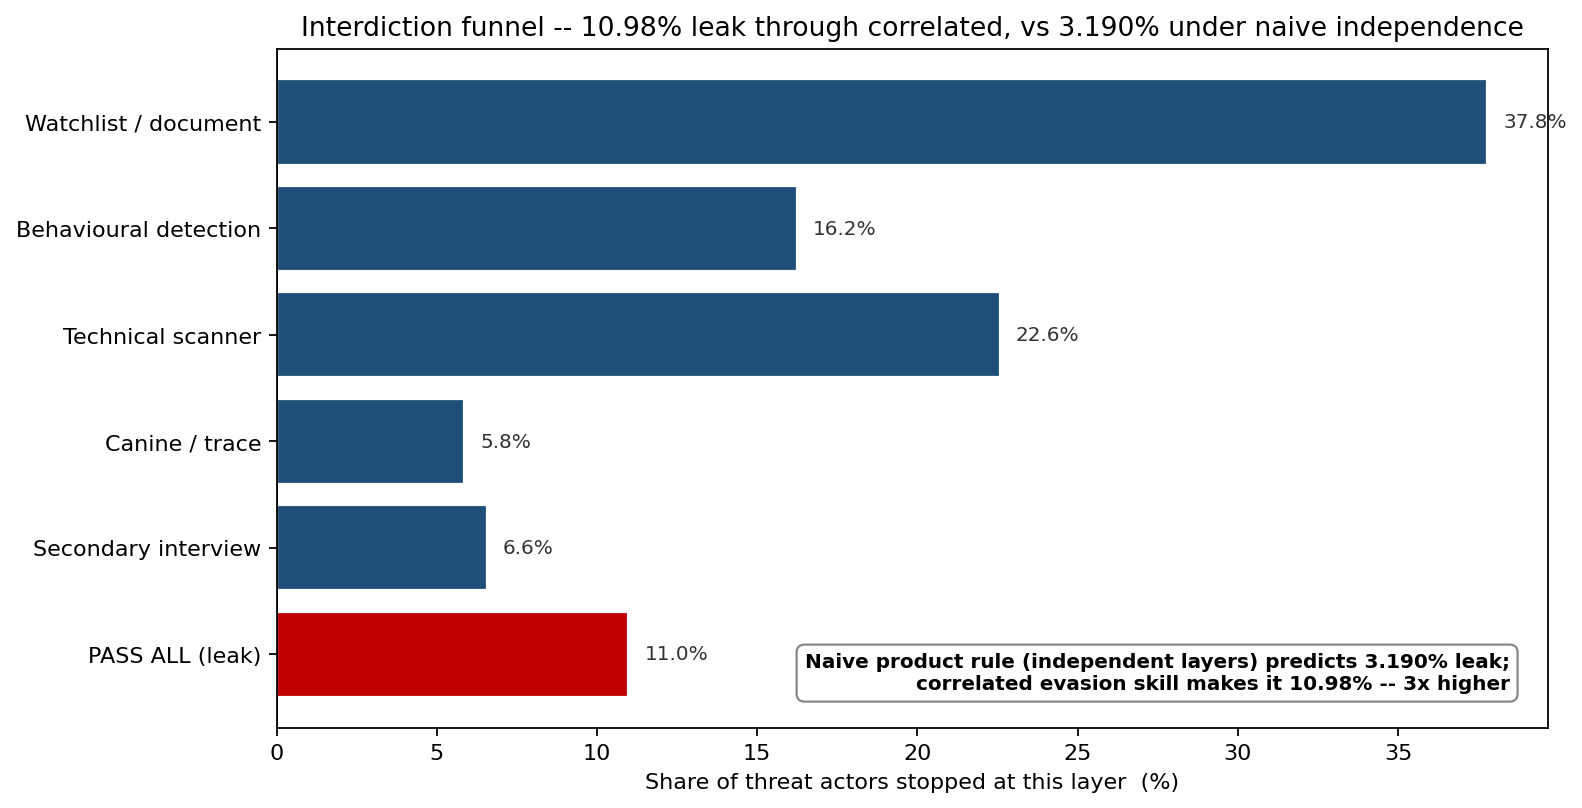
Tracing actors through the funnel, the watchlist/document layer stops 37.8%, the technical scanner 22.6%, behavioural detection 16.2%, the secondary interview 6.6%, and canine/trace 5.8%. That leaves 10.98% passing all five layers. Against this, the naive product rule using the same mean layer probabilities and an independence assumption predicts only 3.19%. The correlated model produces 3.4x more leakage — and it is the right number, because it accounts for the fact that the actors who slip the first layer are disproportionately the ones who will slip the rest.
False positives overload the analysts who run the secondary screening
Layered screening is not free. Every layer throws false positives, and each one consumes a finite officer's time in secondary screening. We model referrals per shift as Poisson, scaled by a shared "busy-day" factor so referrals surge across all layers together.
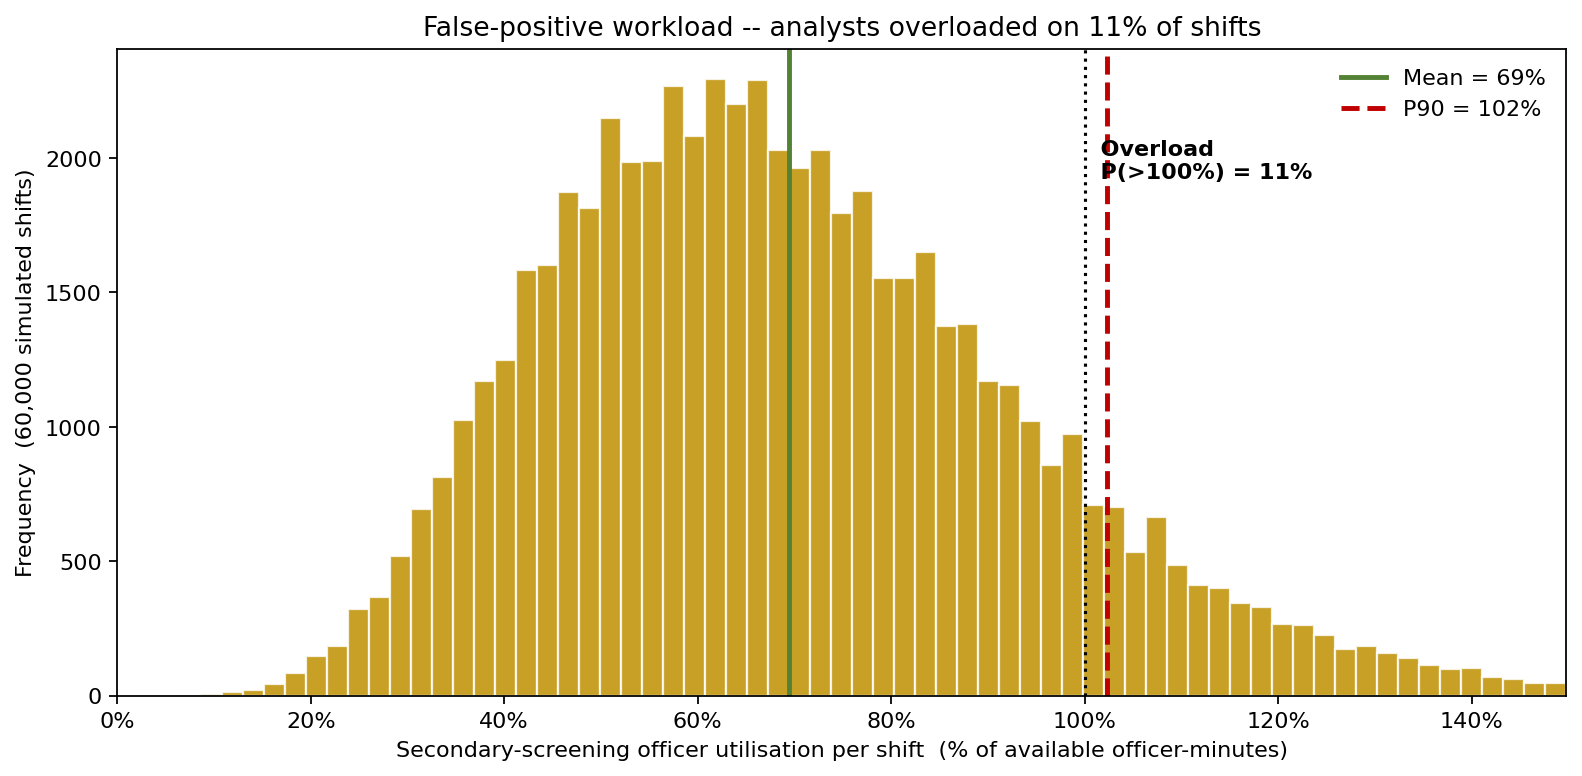
Across 60,000 simulated shifts, secondary-screening officers run at a mean utilisation of 69%, but the distribution has a heavy right shoulder: the P90 shift hits 102% of available officer-minutes, and officers are overloaded (>100%) on 11% of shifts. On those overloaded shifts, real referrals queue behind the false-positive backlog — the same crowding-out that lets capable actors slip through when the system is busiest. Sizing the officer roster to the mean, as the original plan did, guarantees that better than one shift in ten is operating beyond capacity.
Where the next officer-hour buys the most
Given a fixed budget, which layer should be strengthened first? We boost each layer's interdiction capability by 25% in turn and measure the drop in leakage.
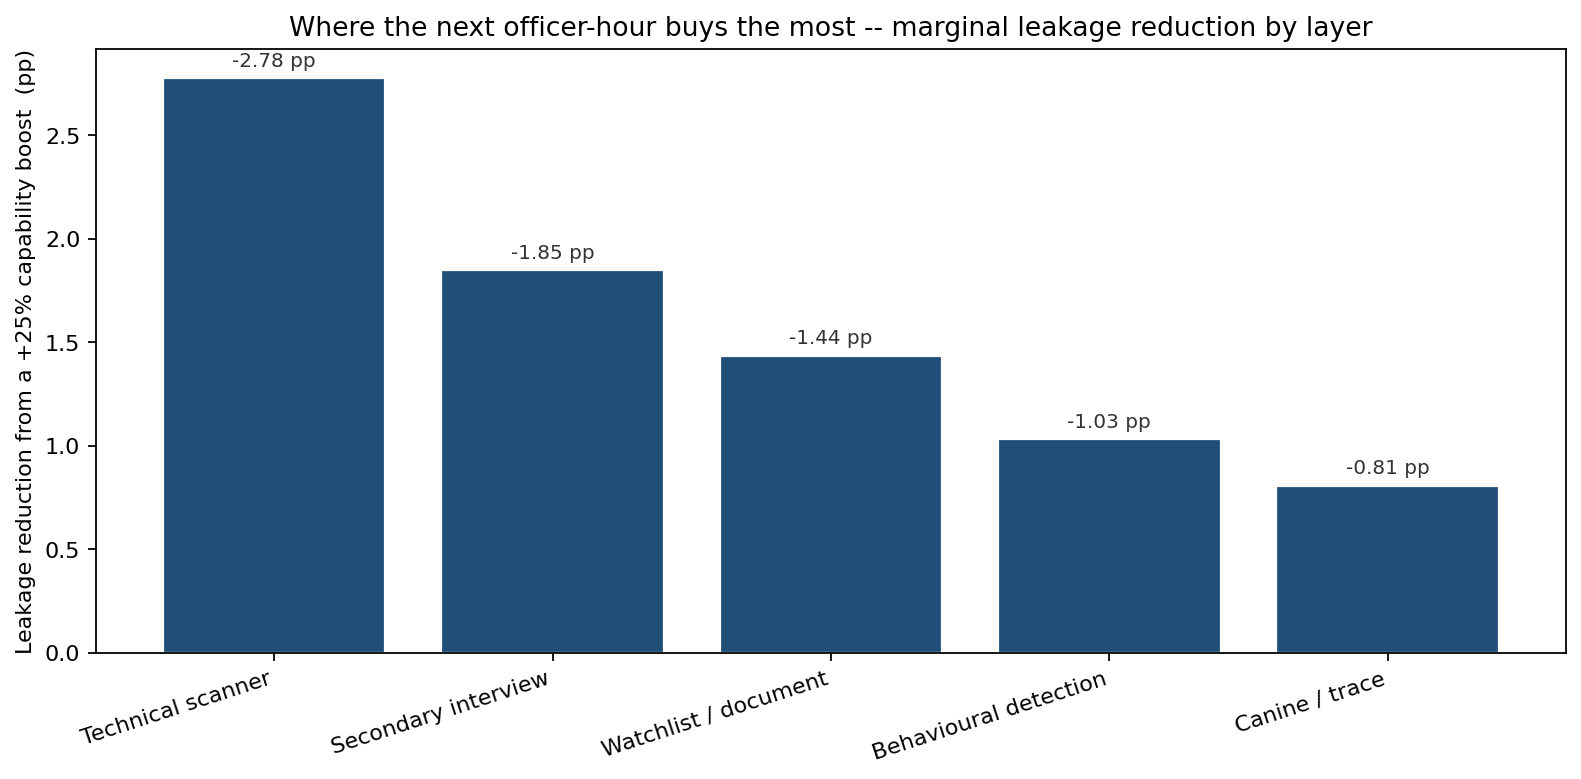
A +25% boost to the technical scanner removes 2.78 percentage points of leakage — far more than any other layer — followed by the secondary interview (−1.85 pp) and the watchlist/document layer (−1.44 pp). Behavioural detection (−1.03 pp) and canine/trace (−0.81 pp) return the least. Crucially, the ranking is not the same as the raw stop-rate ranking: the watchlist layer stops the most threats overall, but the scanner buys down more residual leak because it catches a different slice of the capable-actor tail. Only a joint simulation can produce a marginal-value ordering rather than an average-contribution one.
What the model changed
- The certified leak figure was corrected from 3.2% to 11% — the same screening stack, honestly priced once layer correlation was admitted. The architecture review reopened on that basis.
- Investment was redirected to the technical scanner, the layer with the largest marginal leakage reduction, rather than the watchlist layer that merely had the highest gross stop count.
- The officer roster was resized to the P90 shift, not the mean, removing the 11%-of-shifts overload condition that was silently degrading interdiction on the busiest days.
- The success metric shifted from a single "97% interdiction" headline to the full distribution and the P(pass-all) leak, giving oversight a number that reflects the capable-adversary tail instead of the average traveller.
ModelRisk Functionality Used
- Beta-distributed per-layer interdiction with a shared evasion-skill factor — each actor's layer probabilities are drawn, then jointly suppressed by one common skill factor, imposing the +0.24 to +0.26 cross-layer correlation that the product rule ignores.
- Sequential funnel simulation of 120,000 actors through five layers, producing both the stop-rate-by-layer breakdown and the correlated P(pass-all) leak — directly comparable to the naive independent product rule.
- Poisson false-positive workload model with a shared busy-day factor, turning per-layer false-alarm rates into a distribution of officer utilisation and an explicit overload probability.
- Marginal resource-allocation sweep that re-runs the full stack with a +25% boost at each layer in turn, ranking layers by leakage reduction rather than gross stop count.
- Distributional reporting (mean, P10, P(combined interdiction < 80%)) that surfaces the hard-to-stop tail a single interdiction percentage conceals.
The strength of layered screening is not the product of the layer strengths. A capable adversary correlates the layers' failures, and a busy day correlates the analysts' overload — so the real leak, and the real workload, are several times worse than the independence math implies. Monte Carlo simulation in ModelRisk is what replaces a comforting 3% slide with the 11% an oversight committee actually has to defend.