

Industry: Defense
Product: ModelRisk
Application: Optimizing Border Security Resource Allocation Under Uncertainty
87% of Nights Leave at Least One Crosser Unactioned: Why Adding Sensors Made It Worse
A sector command watching a 40-mile stretch of border with 24 unattended ground sensors and radar nodes had a number it trusted: each sensor was rated at roughly 62% probability of detection (Pd), so with four sensors typically covering any given crossing point, "the math" said almost nothing got through. The deterministic planning spreadsheet agreed — multiply the per-sensor miss rates together, and a coordinated incursion should be detected better than 99 times in 100. The procurement case for the next tranche of sensors leaned entirely on that arithmetic.
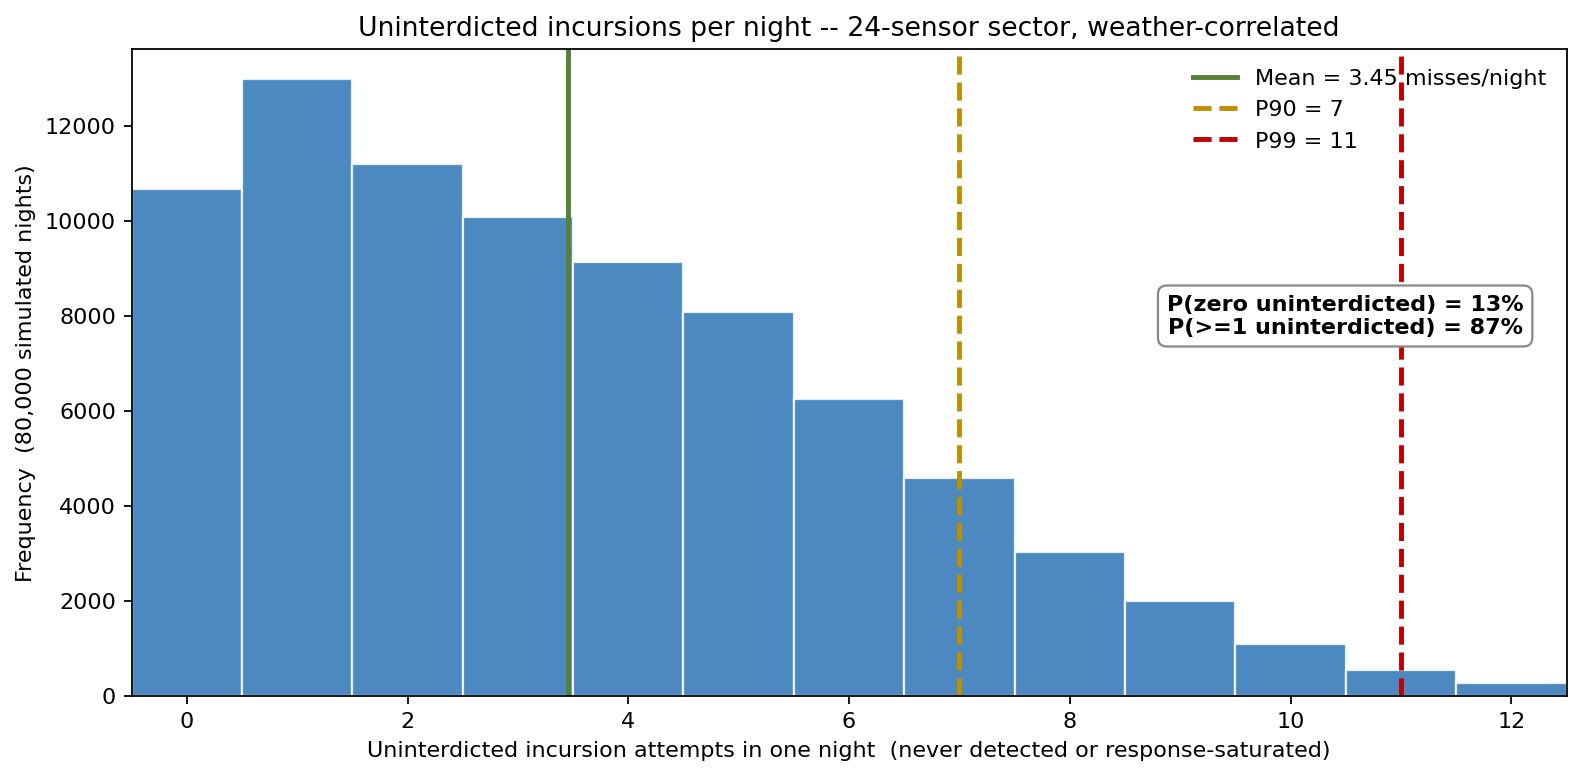
The reality on the ground did not match. Across 80,000 simulated nights with weather-correlated sensor performance, a finite response force, and false-alarm clutter all modelled explicitly, the sector left at least one incursion attempt uninterdicted on 87% of nights — either never detected at all, or detected but crowded out of a saturated response. The mean was 3.45 unactioned crossers per night and the P99 night saw 11. The point estimate was not conservative; it was off by an order of magnitude, because it priced sensor coverage and ignored the two things that actually bind: the response force and the weather.
Why a point estimate fails here
Three structural facts break the multiply-the-miss-rates calculation, and none of them survive a single-number model.
First, per-sensor Pd is not a fixed 62% — it is a draw from a Beta distribution that gets degraded by a shared nightly environment factor. Fog, blowing dust, heat shimmer and moonlight do not hit one sensor at a time; they hit every sensor in the sector together. On a bad-weather night the whole network goes partially blind at once, so the misses do not average out — they pile up on the same nights. The deterministic model treats each sensor as an independent coin flip, which is exactly the assumption that fails.
Second, detection is not interdiction. A sensor firing only matters if a responder is free to run the alarm down. The response force can work through a limited number of alarms per night before saturating. A real detection that arrives when the queue is full is, operationally, a miss.
Third, false alarms compete for that same finite capacity — and false-alarm load is also weather-driven. The dust that blinds the cameras also throws clutter alarms, so on the worst nights the response force is simultaneously busiest with false positives and facing the most real crossers.
The headline distribution
Over 80,000 simulated nights the count of uninterdicted incursions has a mean of 3.45 per night, a P90 of 7, and a P99 of 11. Only 13% of nights are fully clean (zero crossers unactioned); 87% leave at least one crosser unactioned. Of the 3.45 mean misses, only 0.98 are never detected — the other 2.48 are detected but lost to a saturated response. That decomposition is the whole story: most of the failure is not blind sensors, it is a response force that cannot keep up.
Coverage sweep — more sensors made it worse
The obvious lever is to buy more sensors. The simulation says that beyond a point, more sensors increase the miss rate.
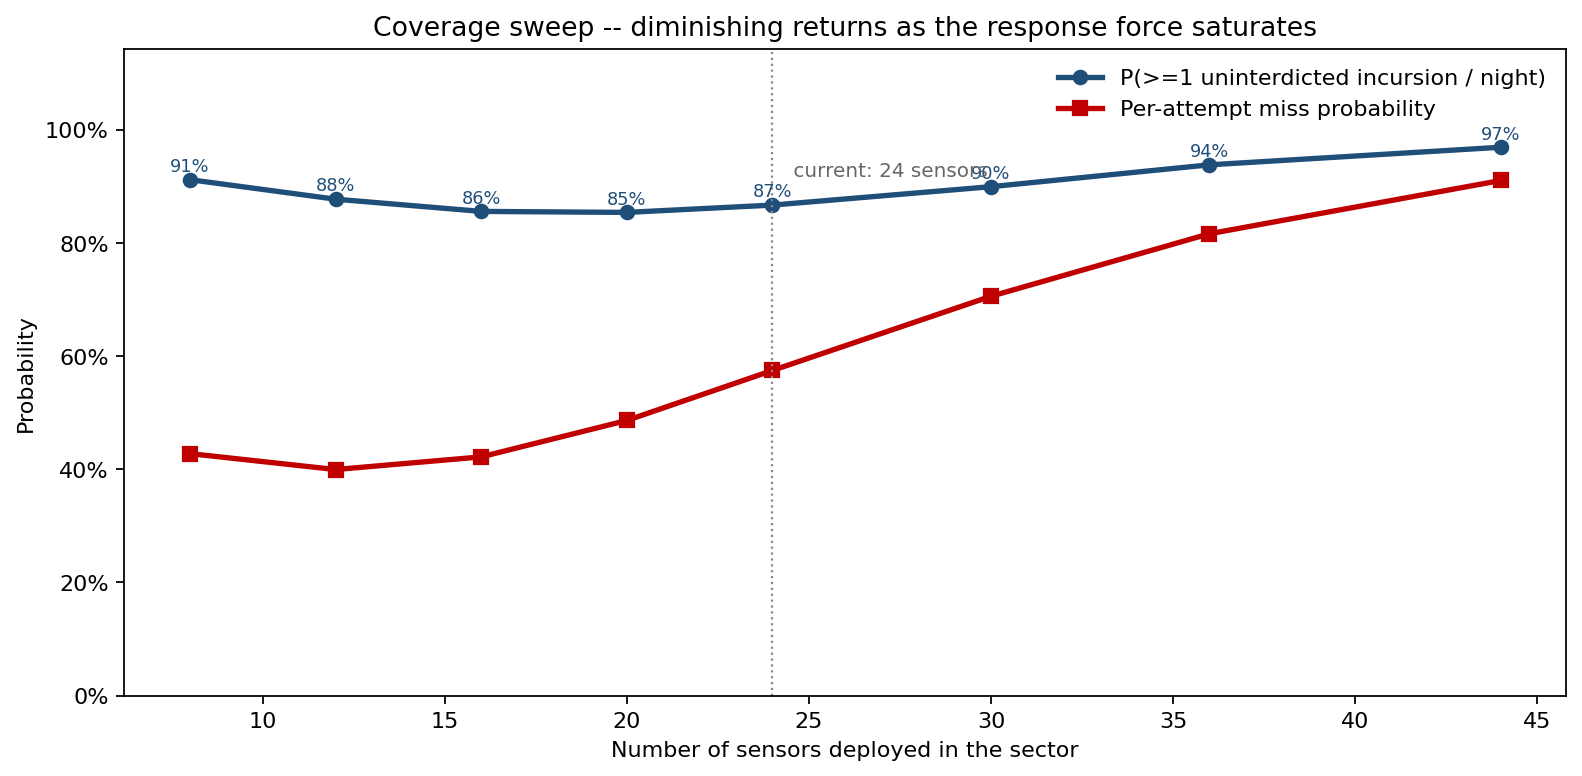
Sweeping sensor count from 8 to 44 (holding the response force fixed, as the procurement case did), the per-attempt miss probability falls from 43% at 8 sensors to a minimum of about 40% near 12 sensors, then climbs steadily to 57% at the current 24 sensors and 91% at 44. The reason is the false-alarm load: every added sensor adds clutter into the same response cell, and past roughly 16–20 sensors the marginal false alarms saturate the responders faster than the marginal detections help. The probability of at least one uninterdicted incursion per night follows the same U-shape — 91% at 8 sensors, a low of ~85% around 20, and 97% at 44. The binding constraint is not sensor coverage; it is response capacity.
Bad weather degrades every sensor at once
Because the environment factor is shared, conditioning on it shows the correlated failure directly.
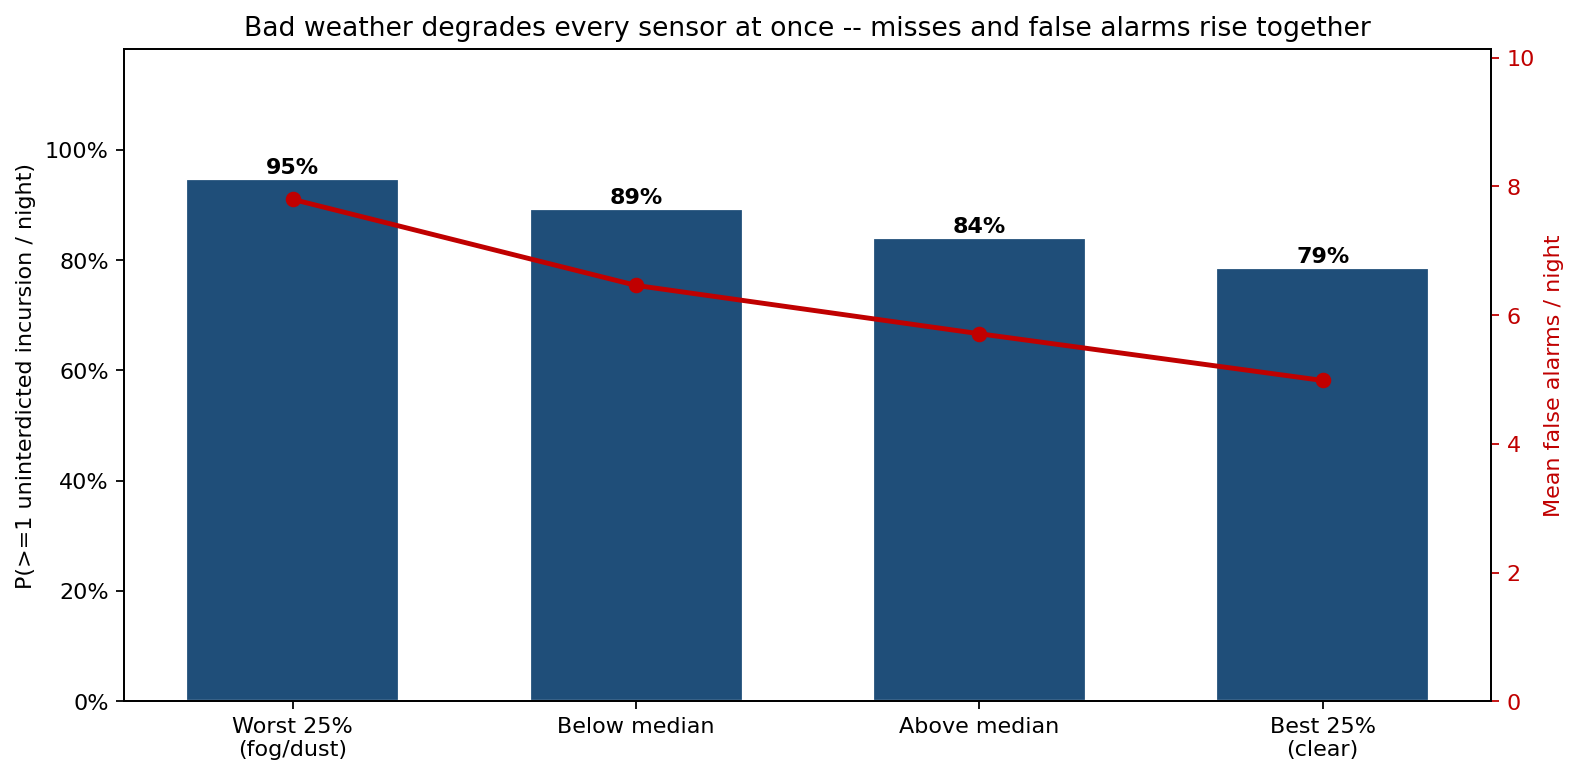
Splitting nights into visibility quartiles: on the worst 25% of nights (fog/dust) the sector leaves a crosser unactioned 95% of the time, with a mean of 4.42 misses and 7.8 false alarms. On the clearest 25% that falls to 79%, 2.63 misses, and 5.0 false alarms. Misses and false alarms move together across the weather bands — the empirical Spearman correlation between nightly missed-count and false-alarm-count is +0.63, induced entirely by the shared environment factor. Under an independence assumption that figure would be near zero; the +0.63 confirms the common-mode degradation the deterministic model could not see, and it is precisely why misses cluster on the hardest nights instead of averaging out.
What actually drives the miss rate
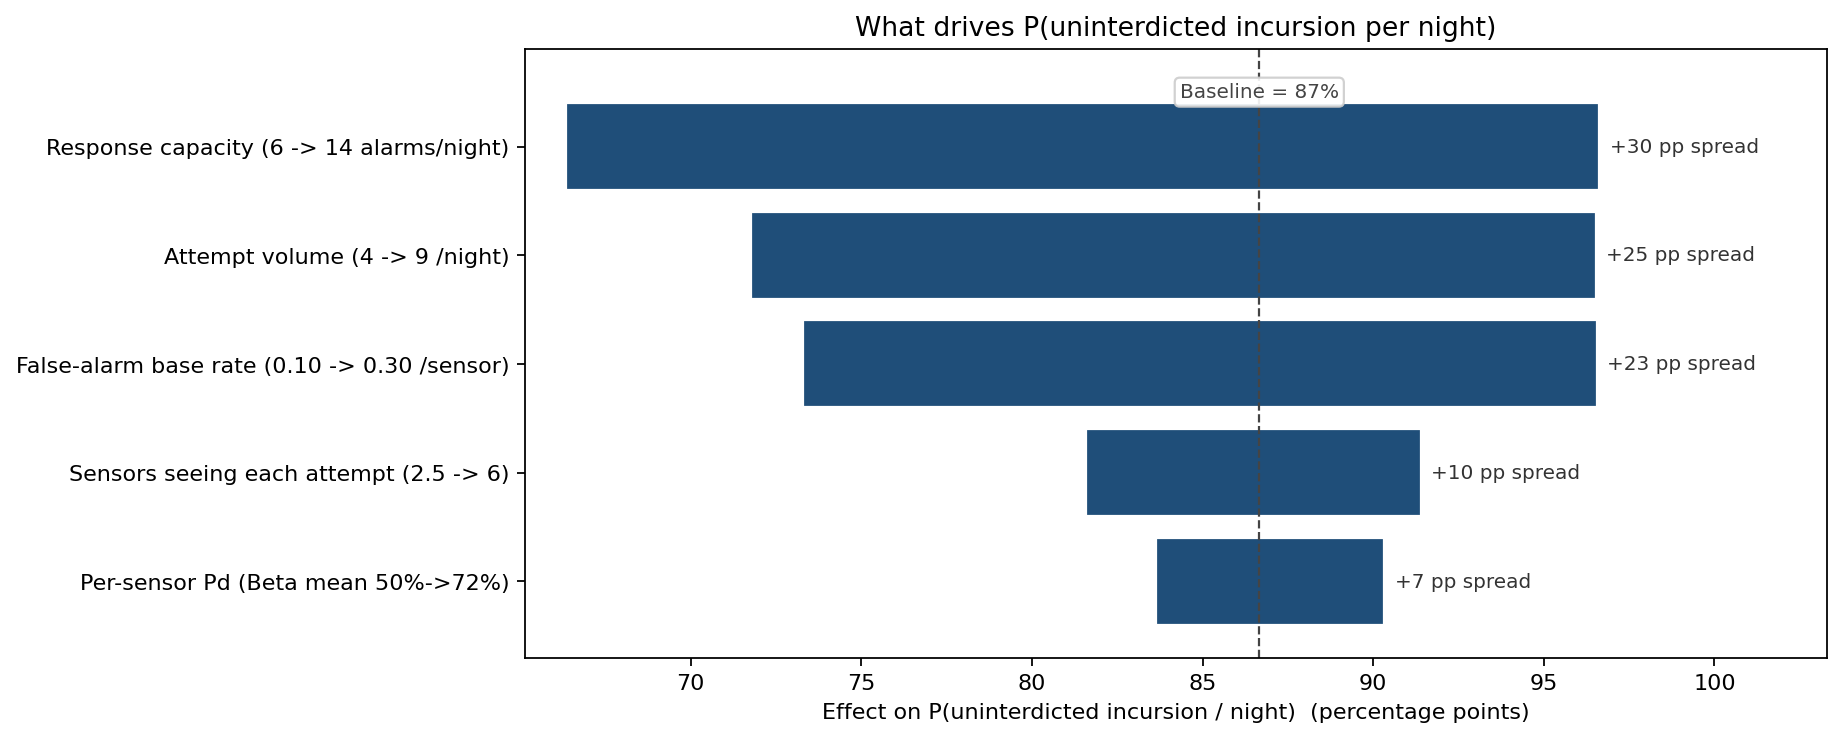
Ranking the levers by their swing on P(uninterdicted incursion per night), baseline 87%:
- Response capacity (6 to 14 alarms/night): 30 pp swing — far and away the largest mover. Doubling the response force does more than doubling the sensors.
- Attempt volume (4 to 9 per night): 25 pp — adversary tempo, largely outside the operator's control.
- False-alarm base rate (0.10 to 0.30 per sensor): 23 pp — sensor discrimination matters more than sensor sensitivity, because every false alarm steals a responder slot.
- Sensors seeing each attempt (2.5 to 6): 10 pp.
- Per-sensor Pd (Beta mean 50% to 72%): 7 pp — the smallest lever, and the one the original procurement case was built on.
What the model changed
- The procurement decision flipped. The plan to add a fourth tranche of sensors was shelved; the same budget went to expanding the response cell and cutting false-alarm rates, the two levers the tornado identified as 4–5x more powerful than per-sensor Pd.
- The success metric changed from "sensor Pd" to "P(uninterdicted incursion per night)" — an end-to-end measure that includes the response force and weather, not just the sensor sheet.
- The operating picture became weather-aware: the model justified surging the response force on forecast fog/dust nights, when P(miss) jumps to 95%, rather than holding a flat roster.
- The headline 99%+ detection claim was retired in favour of a defensible distribution — mean 3.45, P99 11 — that an oversight committee can actually plan against.
ModelRisk Functionality Used
- Beta-distributed per-sensor Pd with a shared environment multiplier — each sensor's detection probability is a draw, then degraded by one common nightly visibility factor, so sensor failures correlate instead of averaging out.
- Poisson false-alarm and incursion-arrival models scaled by the same weather factor, imposing the +0.63 miss-to-false-alarm correlation that an independence assumption misses.
- Response-saturation logic that reclassifies detected-but-unactioned crossers as operational misses, separating the "blind sensor" failure mode from the "no responder free" failure mode.
- Parameter sweep across sensor count that surfaced the counterintuitive U-shaped coverage curve and the response-capacity bottleneck.
- Sensitivity (tornado) ranking on P(uninterdicted incursion) that put response capacity, attempt volume and false-alarm discrimination ahead of per-sensor Pd — redirecting the procurement budget.
A border sector's security is not the detection probability stamped on a sensor. It is the probability that a real crosser gets detected and actioned, on the night the weather is worst and the response force is busiest. Monte Carlo simulation in ModelRisk is what turns a misleading 99% spec sheet into the 87%-of-nights operational truth a commander can resource against.