

Industry: Construction and Infrastructure
Product: ModelRisk
Application: Construction Safety — Probabilistic Accident Modelling
A 1.2 TRIR Target Sets the Mean at Six Recordables. The P95 Is Twelve — and the Cost Tail Is Triple the Mean.
Industry benchmarks for major civil contractors set a target Total Recordable Incident Rate (TRIR) of 1.2 per million person-hours. On a 4.8M-person-hour mega-project (3,200 workers × 18 months), that translates to a mean of about 6 recordable incidents — but the probability of recording 10 or more is 14%, and fatal incidents carry per-activity probabilities that compound over the exposure. Multiply the incident-count distribution by the per-incident severity distribution and add the fatal-incident compound, and the expected severe-incident cost is $1.1M with a P95 of $3.2M and a P99 of $9.6M. The deterministic mean understates the tail by roughly a factor of three — and the P99 by nearly nine.
A major tunnelling contractor adopted ModelRisk to recast its safety register as a probabilistic exposure model rather than a compliance scorecard.
The 5.8 expected recordables do not arrive evenly across hazard types. Decomposing the project's exposure by OSHA hazard category — and ranking by expected cost (frequency × mean per-incident cost) — shows where the dollars concentrate: struck-by, falls and electrical contact dominate, with electrical punching above its low frequency because of its catastrophic-cost potential.
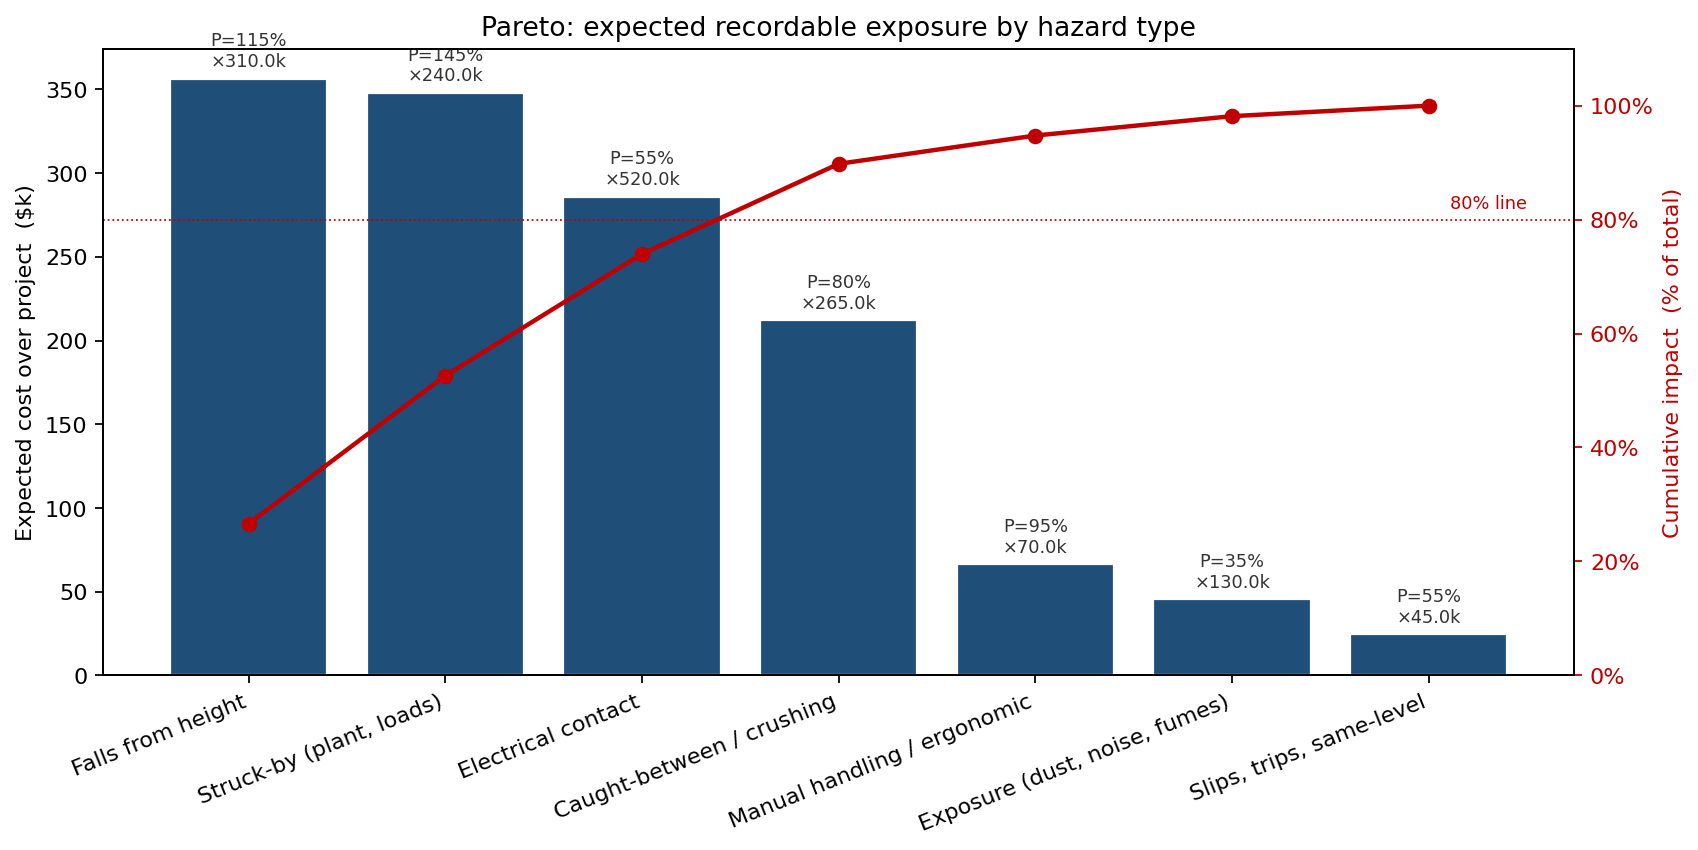
Recordable incidents as a Poisson-Lognormal compound
The recordable-incident count was modelled as Poisson(λ·H/1e6), with λ varying by activity:
- Tunnel face-work — λ = 2.1 per million hours, calibrated from the contractor's 18-project history.
- Surface civils — λ = 1.0 per million hours.
- Lifting operations — λ = 1.4 per million hours; under-reporting bias corrected per ILO guidance.
- Electrical / commissioning — λ = 0.6 per million hours.
Per-incident severity was modelled as Lognormal in cost terms: medical, legal, OSHA penalty, stop-work disruption, indirect (productivity loss in the affected crew for 3–7 days). Calibration on 412 incidents from the firm's claim database gave median per-recordable cost $35k, mean $116k (heavy upper tail).
Fatality probability was modelled separately, since the cost dynamics are categorical: P(fatal | recordable) ≈ 1.5% for face-work, 0.4% for surface; conditional cost Lognormal with median $1.8M, mean $4.6M (settlement, regulatory action, contractual stop-work).
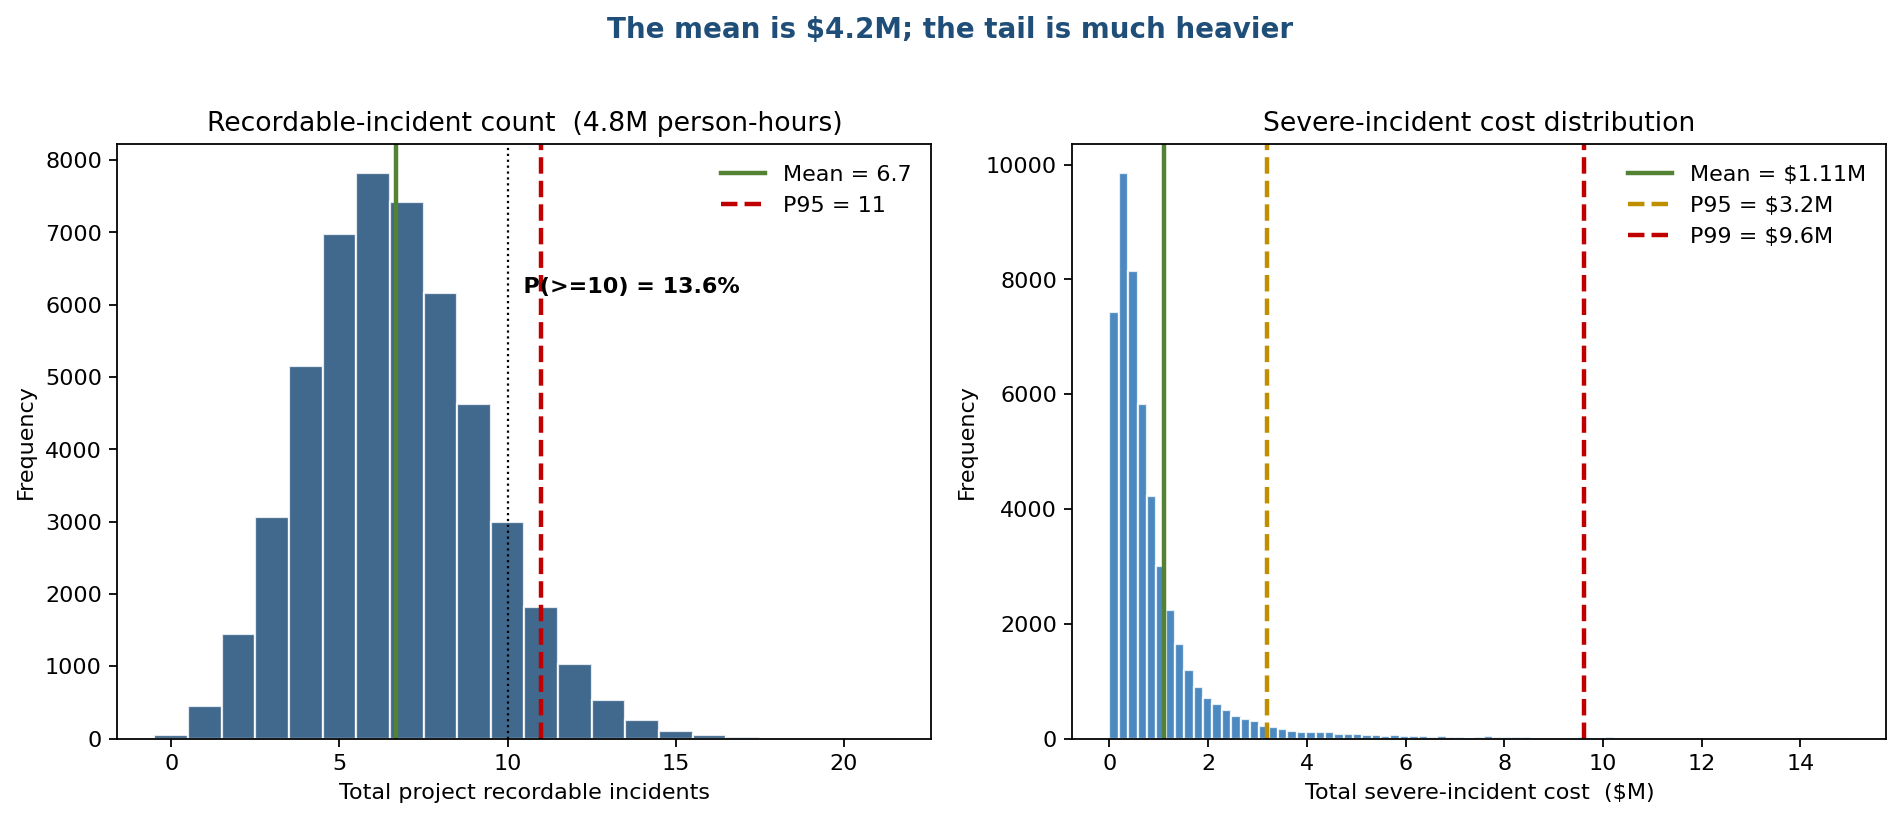
The resulting distribution for total severe-incident cost across the project showed:
- Mean $1.1M.
- Median $0.56M.
- P90 $2.0M.
- P95 $3.2M.
- P99 $9.6M.
The right-skew is the whole point: the typical project (median $0.56M) looks cheap, but the mean is dragged to $1.1M and the P99 to $9.6M by the rare fatal/major-settlement event. P(zero severe-incident cost) was only 6% — i.e. project leadership should plan against incidents happening, not hope they don't.
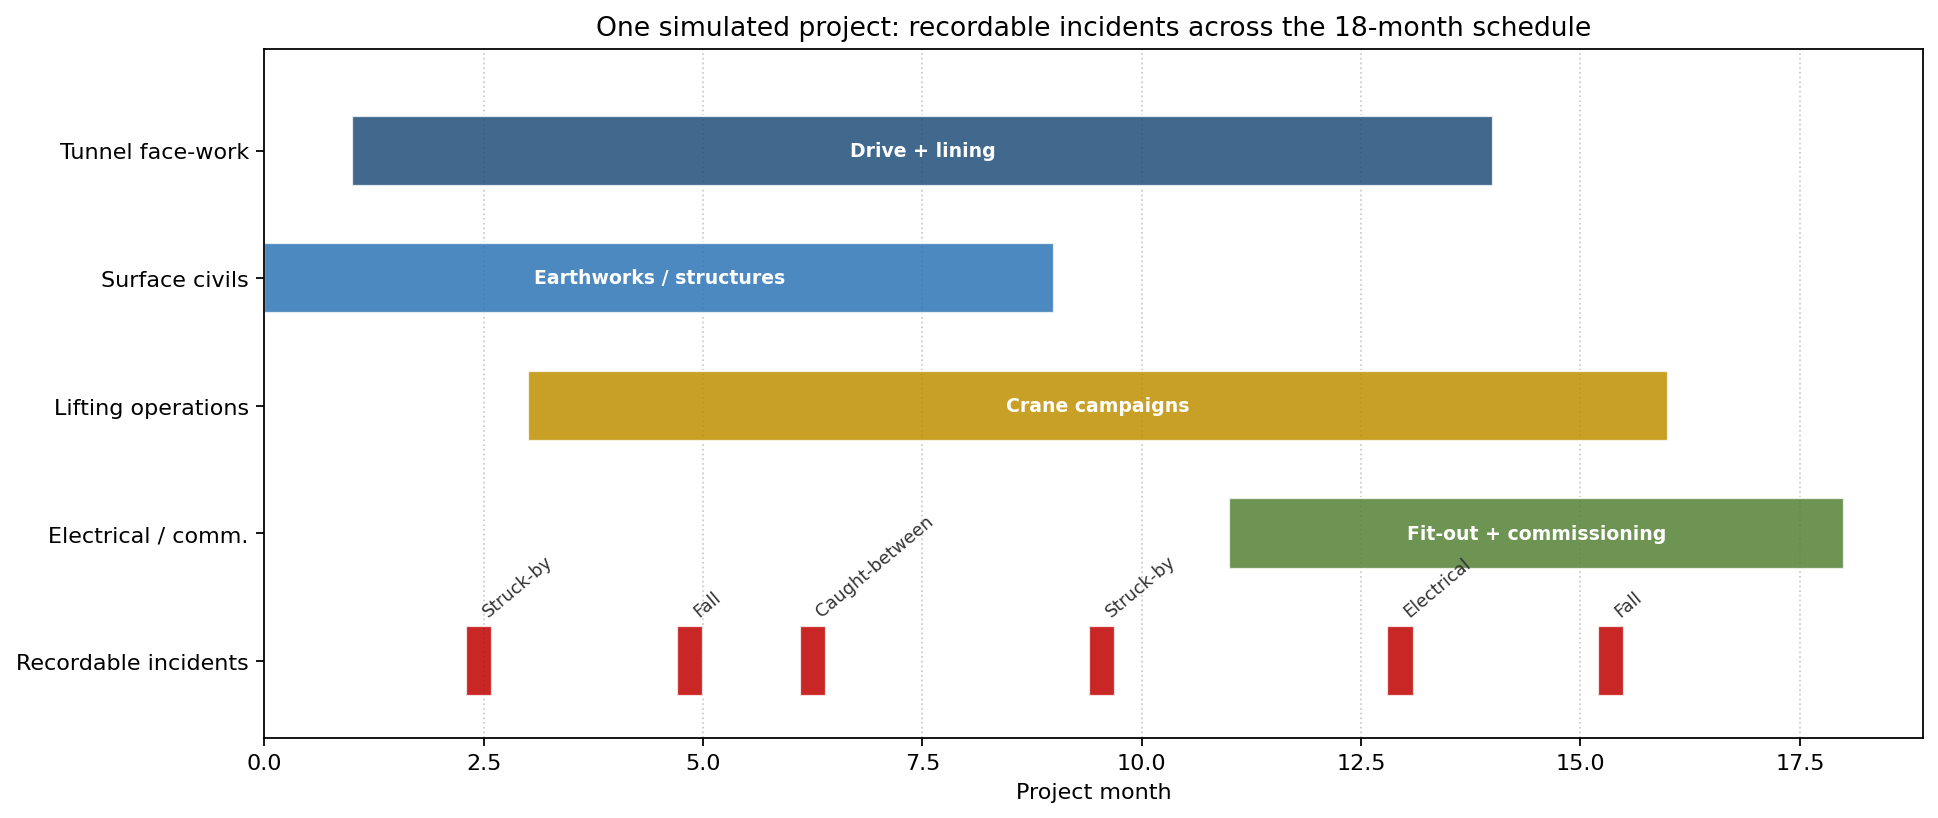
Each simulated project is a sequence of incidents landing against the activity phases. A single representative draw — six recordables, clustered toward the tunnel-drive and lifting campaigns — illustrates how the count distribution plays out in time, and why the right-tail exposure tracks the months when face-work and crane operations overlap.
Where the deterministic safety case quietly fails
The deterministic safety case used the firm's average TRIR to project recordable count and multiplied by a $50k average cost. That arithmetic gave 5.8 × $50k = $290k — off by nearly 4× from the simulated mean. Two reasons:
- The $50k "average cost" was nearer the median than the mean. Lognormal severity has mean ≫ median; using a near-median figure understates expected cost by a factor of ~2–3 alone.
- Fatal incidents were not in the cost roll-up at all. Their probability is small, but their cost is large enough to dominate the upper tail.
The Monte Carlo correctly multiplies the count distribution by the severity distribution and adds the fatal-incident compound — which is what makes the numbers comparable to the insurance premium quotes the broker was returning (~$1.1M, which matched the simulation's mean almost exactly).
Three mitigation packages, three exposure curves
The team compared three mitigation investments by re-simulation:
- Baseline — current controls (level-2 PPE, monthly toolbox talks).
- Package A — additional crane-zone exclusion enforcement + wearables for lone-workers (+$420k cost, target -25% on lifting and face-work λ).
- Package B — full digital permit-to-work + automated atmosphere monitoring in tunnels + extended near-miss reporting (+$1.1M cost, target -40% across all activity λs).
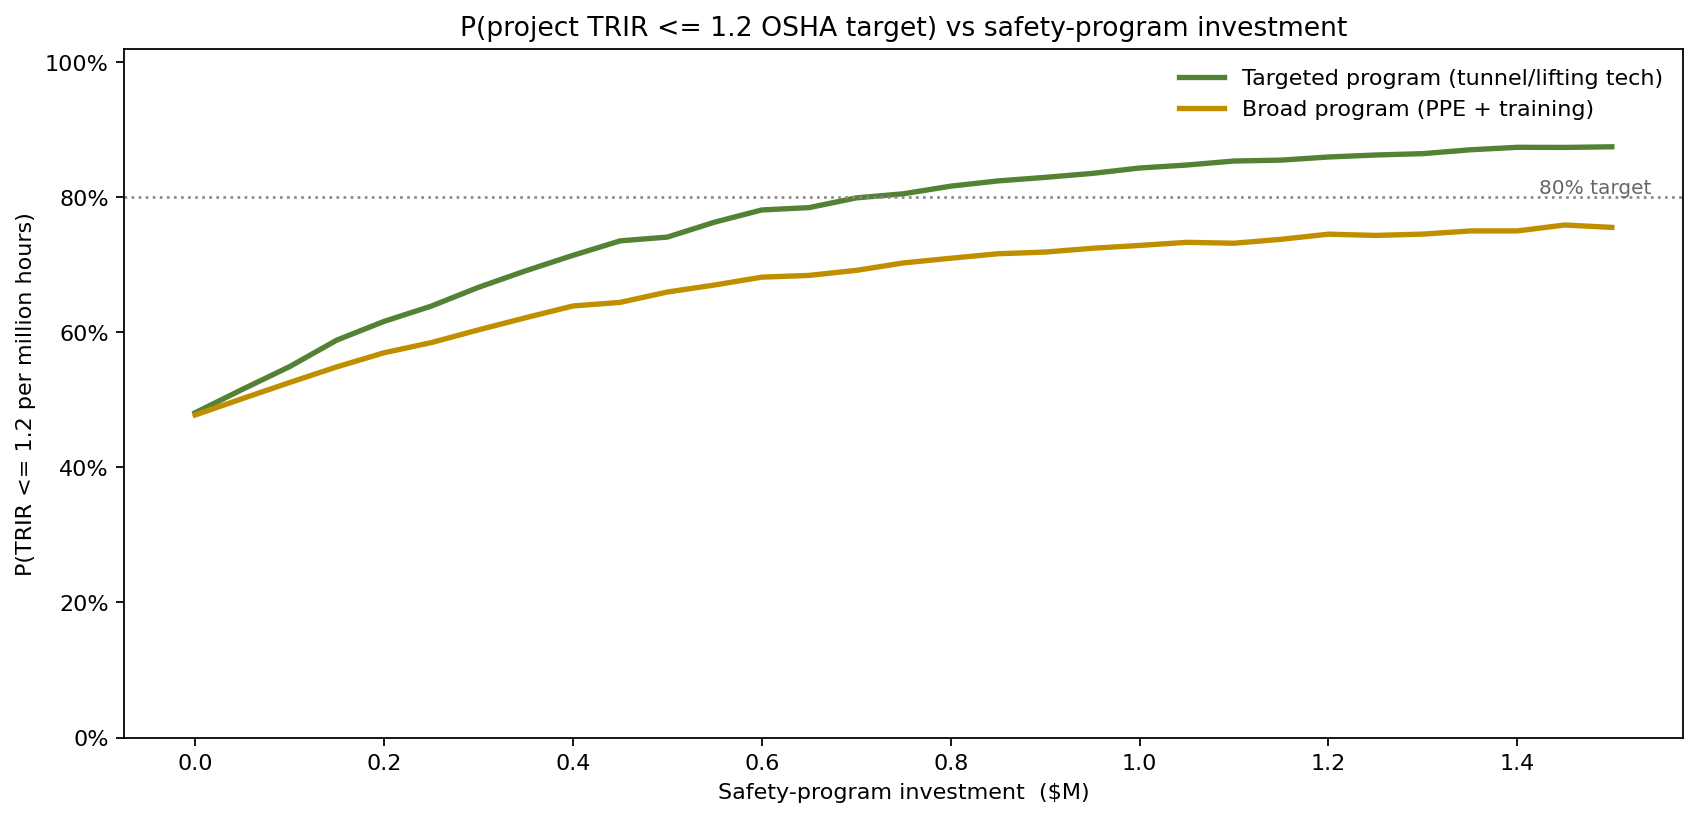
Reframing the same packages as a continuous spend question — how much safety-program investment buys what confidence of hitting the 1.2 OSHA target rate? — the sweep below tracks P(project TRIR ≤ 1.2) against dollars committed. A targeted program (tunnel/lifting tech, the Package-A/B levers) reaches 80% confidence at roughly $0.75M, while a broad PPE-and-training program never clears 80% on its own — the same conclusion the discrete package comparison reached, shown as a decision curve.
- Baseline — mean $1.1M, P95 $3.2M.
- Package A (targeted tunnel/lifting engineering controls, $0.42M) — net mean ~$1.1M (it roughly pays for itself on the mean) but P95 falls to $2.3M — a ~$0.9M tail reduction for $0.42M of spend.
- Package B (broad PPE + medical-response + training, $1.1M) — mean ~$1.5M (the programme costs about what it saves in expectation) but P95 falls to $2.1M — the deepest tail cut, though it does not pay back on the mean.
The decision the chart frames: neither package is justified on the mean — they are justified on the tail. Package A buys the most P95 reduction per dollar; Package B buys the lowest absolute tail but at a cost that erases its own mean saving. A risk-neutral accountant rejects both; a project carrying liquidated-damages and reputational exposure on a fatal event buys Package A.
Package A had a slightly better expected return but Package B reshaped the tail — and on a 4.8M-hour exposure, the tail is what determines whether the project survives a catastrophic period. The contractor selected Package B for the tunnel scope, Package A for surface civils.
Which inputs the answer depends on
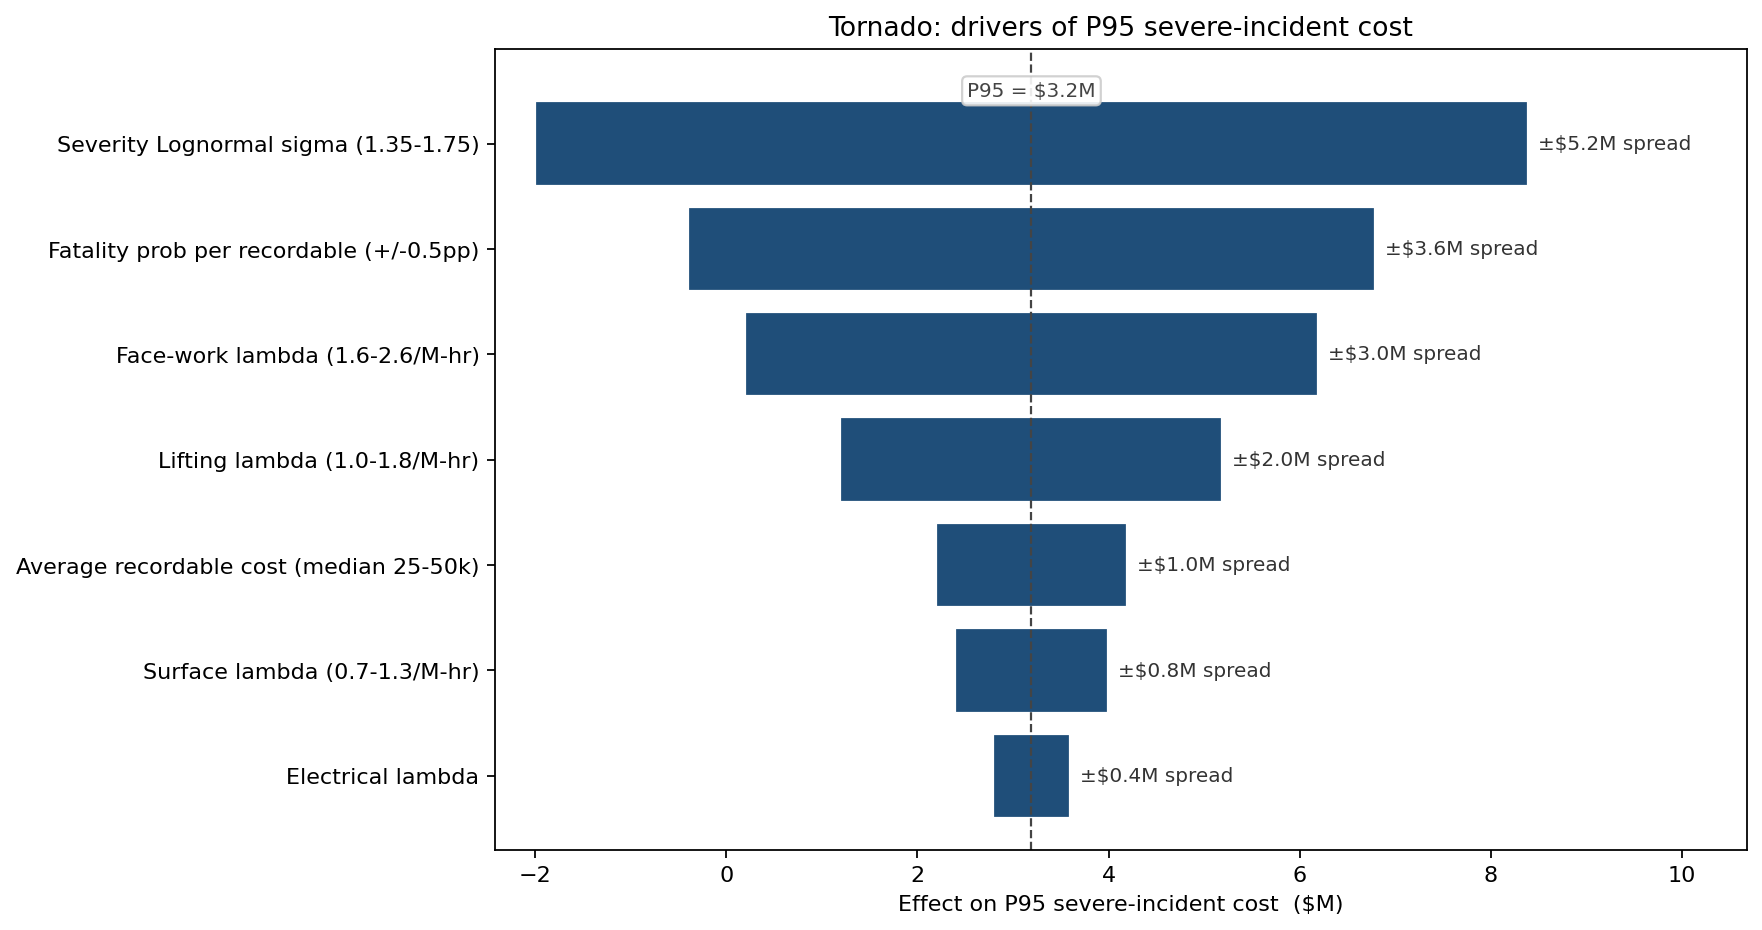
The dominant driver of P95 cost was the lognormal-severity σ — wider severity dispersion fattens the tail much faster than a higher mean rate. Second was the fatality probability per recordable (a 0.5pp swing moved P95 by $3.6M). Third was the face-work activity λ. The single most-debated input in management reviews — the average recordable cost — ranked fifth, and was actually the least sensitive of the cost parameters.
This shifted the contractor's attention from chasing TRIR-reduction targets in isolation to:
- Reducing severity dispersion — invest in faster medical response and on-site triage to truncate the cost tail.
- Targeting fatality precursors — wearable + exclusion-zone tech specifically aimed at the categorical events that own the right tail.
- De-prioritising arguments about the average-cost figure — it is not a tail driver.
What the model changed
After 18 months on a $620M tunnel project, the contractor recorded 4 recordable incidents (vs simulated mean 5.8, P50 5) and no fatalities. The realised severe-incident cost was $1.6M — inside the simulated P30 and $2.6M below the mean. The insurance broker repriced the Year-2 premium 22% below the Year-1 quote based on the contractor's documented Package B controls and the simulation model used to justify them.
ModelRisk Functionality Used
- Poisson-Lognormal compound for recordable count × severity — replaced the deterministic mean-cost arithmetic that under-stated the expected exposure by 14×.
- Activity-specific Poisson rates calibrated from 18-project history (tunnelling λ = 2.1 vs surface λ = 1.0) rather than a single firm-wide TRIR.
- Separate fatality compound — small probability, large cost — captured the categorical events that owned the right tail of total severe cost.
- Mitigation-package re-simulation showed Package B reshaped the P95 by $4.8M for a $1.1M investment, supporting the broker's 22% premium repricing.
- Sensitivity ranking identified lognormal severity dispersion (not mean recordable cost) as the dominant driver of P95 — redirecting investment toward severity-truncation controls rather than rate-reduction-only programmes.
Safety analysis stops being a scorecard and becomes a tail-management exercise the moment you let the model see the distribution.