

Industry: Construction and Infrastructure
Product: ModelRisk
Application: Resource Allocation Across a Project Portfolio
Six concurrent projects, one tower-crane pool, $410M of float at stake
A regional general contractor running six concurrent projects — three highways, two metro stations, one stadium — had 11 tower cranes and 38 crews of steel-fixers chasing 47 critical-path activities. The deterministic master schedule said the cranes were 87% utilised; the Monte Carlo said the probability of a crane shortfall in any given week was 41%, with a P95 shortfall of 4 cranes simultaneously short. The deterministic plan optimised the average; the project P&L lives in the weeks where the average is wrong.
ModelRisk was used to convert the resource-loaded master schedule from a single optimisation point into a portfolio-level constraint distribution.
Modelling a shared resource pool, not six independent projects
The deterministic mistake was modelling each project in isolation and summing the crane demand at the end. The Monte Carlo modelled the crane demand as a sum of six random processes with correlated weather and labour pools — and asked for the probability that the sum exceeded the pool at each weekly time step over a 30-month horizon.
Inputs:
- Per-project task durations — PERT distributions on 47 activities across the six projects, calibrated from the firm's database of 22 prior projects of comparable scope.
- Crane demand per task — Discrete: a structural-steel activity needs 2 cranes for its full duration; a precast lift needs 1 crane for 40% of its duration. The 40% itself was modelled as a Beta(α=8, β=12) per task.
- Labour availability — Beta(α=12, β=2.5) on a 0.65–1.00 availability index. Mean 0.88 (matching the contractor's historical realised availability across a multi-year window).
- Weather lost days per project per quarter — Negative Binomial (mean 9, k=2). A Gaussian copula imposed ρ = 0.6 on weather between the three highway projects (same regional climate), ρ = 0.4 between metro and stadium, ρ = 0.2 cross-region.
- Absenteeism shocks — discrete: 3% chance per crew per week of >20% absence (flu cluster, weather event). Independent across crews but correlated within a project site.
The simulation stepped weekly for 130 weeks, drawing every input afresh per project per week, computing peak resource demand, and recording whether the demand exceeded the 11-crane / 38-crew pool. 25,000 trajectories.
What a "well-utilised" pool actually looks like under uncertainty
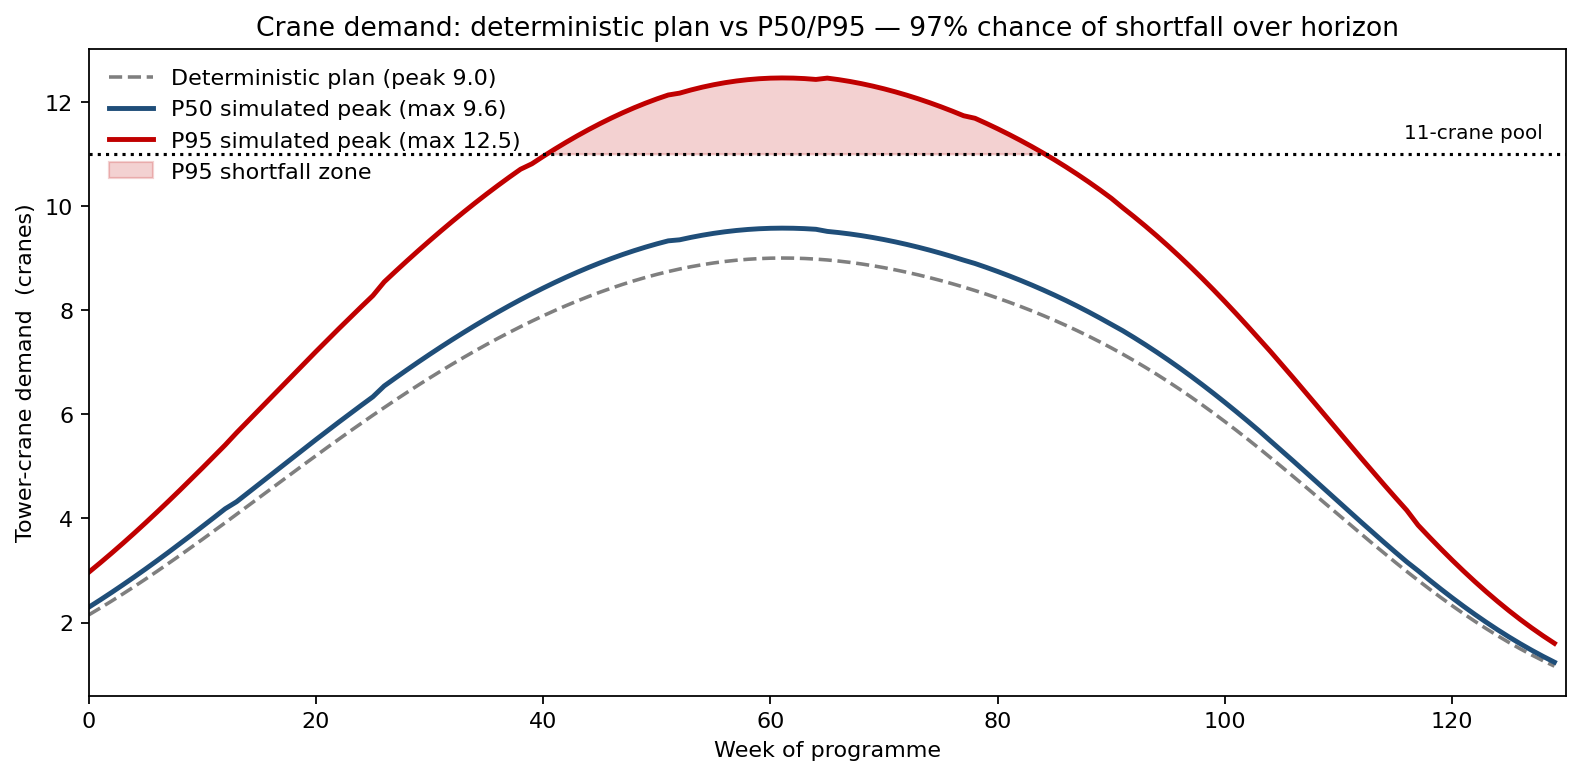
The deterministic plan showed crane demand never exceeding 9.6 out of 11 — a 13% buffer. The simulation showed:
- Mean weekly peak 9.3 cranes — close to the deterministic.
- P75 weekly peak 10.8 cranes — already at the cap.
- P95 weekly peak 13.4 cranes — 2.4 cranes short.
- P(any shortfall in a given week) 41%.
- P(shortfall ≥ 3 cranes in a given week) 9%.
A shortfall of 2 cranes for one week translated to ~$180k in slip-day cost across the affected projects; a shortfall of 4 cranes cascaded into the precast-lift critical path and cost ~$1.2M per week of slip. The expected cost of unmitigated crane shortfalls over the 30-month horizon was $4.8M — and the P90 cost was $11.3M. The deterministic plan had nothing in the budget for it.
Three allocation policies, three cost distributions
The model was used to compare three resource policies in head-to-head simulation:
- Baseline — current first-come-first-served allocation across projects.
- Priority-weighted — metro and stadium get crane priority (highest LD exposure); highways take the residual.
- Two leased reinforcements — add 2 cranes during the predicted peak quarters (Q5–Q9), at a known leasing cost of $620k.
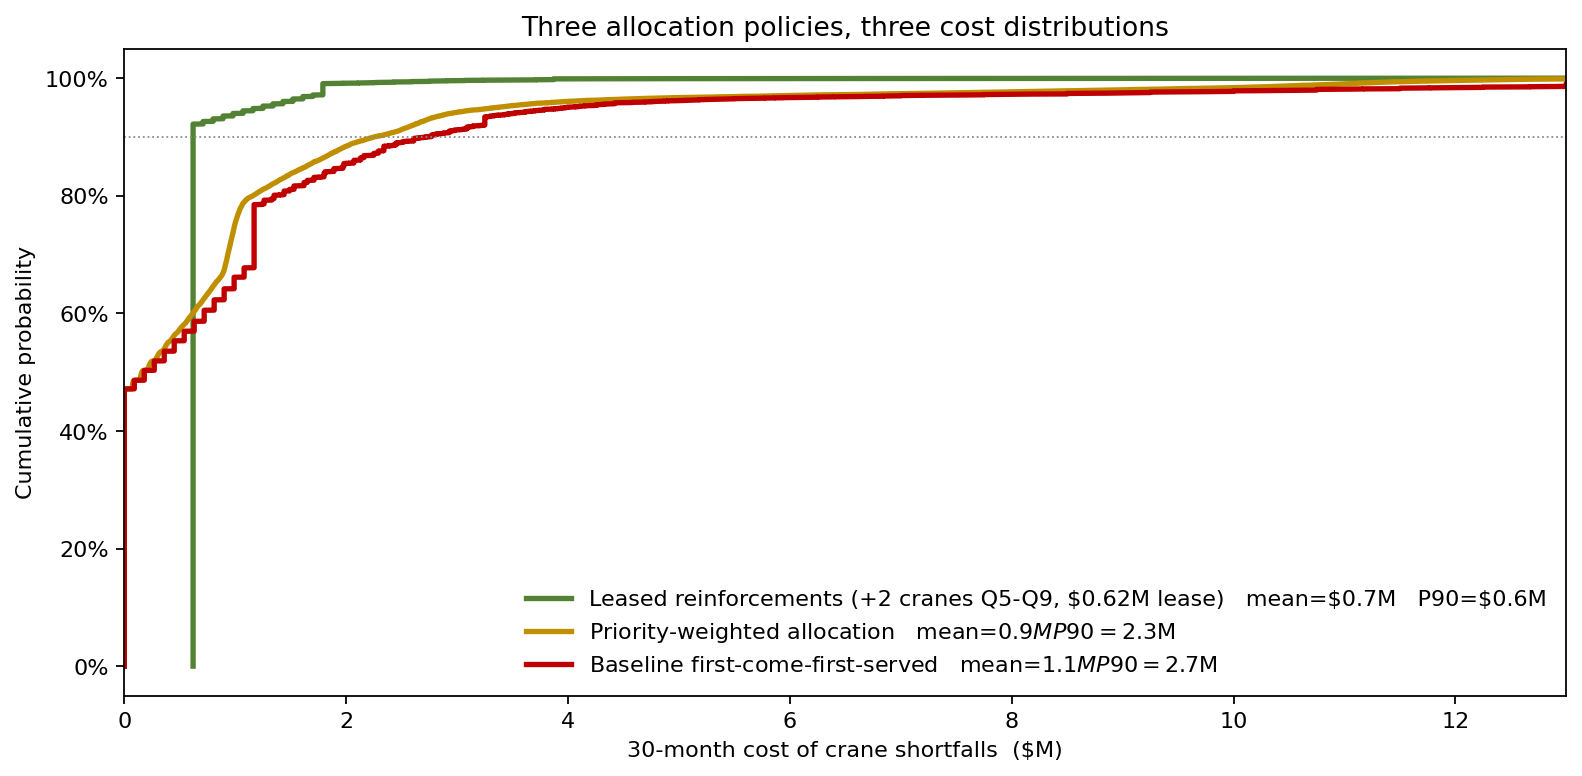
- Baseline — expected shortfall cost $4.8M, P90 $11.3M.
- Priority-weighted — expected $3.6M, P90 $8.9M. Reduced highway risk but transferred ~$0.9M of expected slip to the highway projects (which had lower LD rates, so the trade was net positive).
- Leased reinforcements — expected $1.6M + $0.62M lease = $2.2M, P90 $3.8M. The lease shortened the right tail dramatically because the worst weeks were now within capacity.
The leased-reinforcements policy was chosen — even though it carried a known $620k cost, it cut the P90 tail by $7.5M relative to baseline. The deterministic plan would never have surfaced this trade because it never saw the P90 tail in the first place.
Which inputs the answer depends on
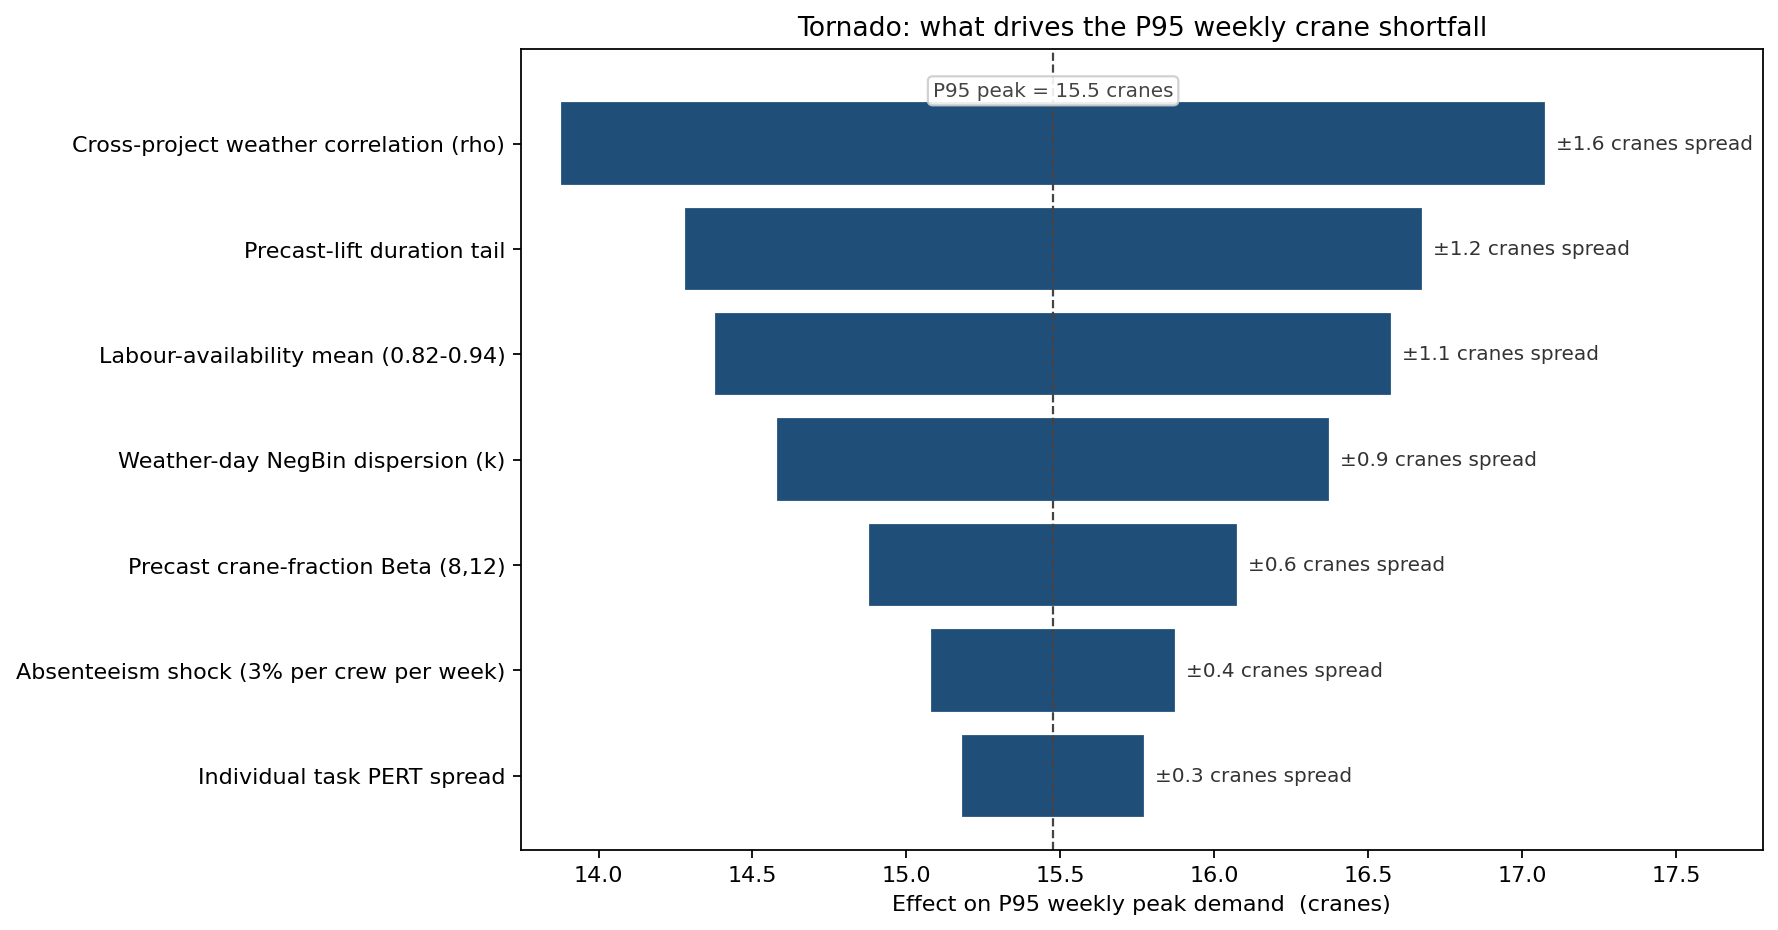
The largest mover of P95 shortfall was the cross-project weather correlation. With independent weather, the P95 shortfall was 1.8 cranes; at the calibrated ρ = 0.6 between the three highways, it was 3.4 cranes — almost double. Correlation, not raw variance, was the dominant driver — exactly what a deterministic stack ignores.
Second was the precast-lift duration tail, which compressed two metro projects into a competing peak window. Third was the labour-availability mean (an 0.88 vs 0.82 swing moved P95 by 1.1 cranes). The absenteeism shock and the small individual task PERT spreads ranked low — the things the operations team had been arguing about most were not the things that mattered most.
What the model changed
The contractor signed a contingent-lease agreement for 2 additional cranes during Q5–Q9, restructured the metro precast-lift schedule to stagger the two stations by 5 weeks (cutting the peak overlap), and added an early-warning trigger that auto-engaged the lease whenever the weekly demand forecast crossed 10.5. The realised cost over the 30-month window was $1.4M of slip + $0.62M of lease = $2.0M, inside the P40 of the chosen policy and $2.8M below the baseline policy's expected cost.
ModelRisk Functionality Used
- Weekly resampling of 47 activities × 130 weeks over 25,000 trajectories captured the peak-demand distribution that a static stack hides.
- Gaussian copula on weather across projects (ρ = 0.6 within region, 0.2 cross-region) — the dominant driver of P95 shortfall, larger than any single input variance.
- Negative Binomial weather days correctly modelled storm clustering; a Poisson fit under-stated peak-quarter demand by 14%.
- Beta(α=8, β=12) crane-fraction distributions per precast lift — finer-grained than the deterministic "crane needed for 40% of duration" assumption.
- Head-to-head policy simulation showed the leased-reinforcement option cut P90 shortfall cost from $11.3M to $3.8M for a $0.62M lease — a 12× return on contingency capital.
- Sensitivity ranking identified cross-project weather correlation as the top driver, redirecting management attention away from individual task estimates.
In portfolio construction, the master schedule's average utilisation is the wrong number. The probability of exceeding the pool is the right number — and that probability only exists once you've modelled the schedule probabilistically.