

Industry: Construction and Infrastructure
Product: ModelRisk
Application: Material Procurement Under Uncertainty
$11.5M of Steel, an 18-Month Horizon, and a 27% Chance the JIT Strategy Costs $2M More
The bridge package needs 12,500 tonnes of steel reinforcement over 18 months. At the spot price the day the contract was signed — $920/tonne — that is $11.5M, the deterministic line in the budget. The probabilistic rebuild in ModelRisk priced three procurement strategies against an explicit monthly spot-price path with shock jumps, demand uncertainty, per-shipment delay risk, and inventory holding cost. The just-in-time strategy had a mean cost of $12.3M, a P90 of $14.1M, and a 27% probability of finishing $2M or more above the deterministic line. The hybrid strategy (50% locked, 50% spot) cost about $0.6M more on the mean but cut the P90 by $1.4M and almost eliminated the right tail.
Material procurement is the textbook case where deterministic planning is wrong by structure, not by margin. The price you pay today is not the price you pay in month 12. A point estimate at today's spot is the implicit prediction that nothing will change — a prediction the last decade of commodity markets has falsified repeatedly.
Four uncertainty channels
Demand quantity. Steel takeoff scope is 12,500 t mid-case but moves with detailed design and rework. Modelled as LogNormal(ln 12500, 0.08) — about ±8% one-sigma scope variability. (Industry-standard rule-of-thumb on a developed-design package.)
Spot price path. Monthly returns ~ Normal(0.002, 0.055) — a small positive drift, 5.5% monthly volatility — plus a 4% per-month probability of a shock jump of 5–25%. The shock structure matters: a plain GBM without jumps systematically under-states the 90th percentile of cumulative price drift, because the historical record of construction-commodity prices contains discrete events (supply-chain disruption, mill outages, tariff actions) that drive much of the tail. Starting price $920/t.
Per-shipment delay. JIT requires 18 monthly shipments; each carries a 12% probability of a 2–6 week delay. Delays beyond 2 weeks hit the critical path at $0.18M/week. Bulk requires one big shipment with an 8% probability of a 4–10 week delay (lower probability, much higher consequence). Hybrid splits the difference.
Holding cost. $30/tonne/month for any tonnage on-site ahead of placement. Bulk holds ~9 months of average inventory; hybrid ~7 months; JIT essentially none.
The price path the buyer cannot see
The deterministic JIT plan implicitly assumes spot price stays flat at $920/t for 18 months. The simulated spot-price fan shows what flat actually means:
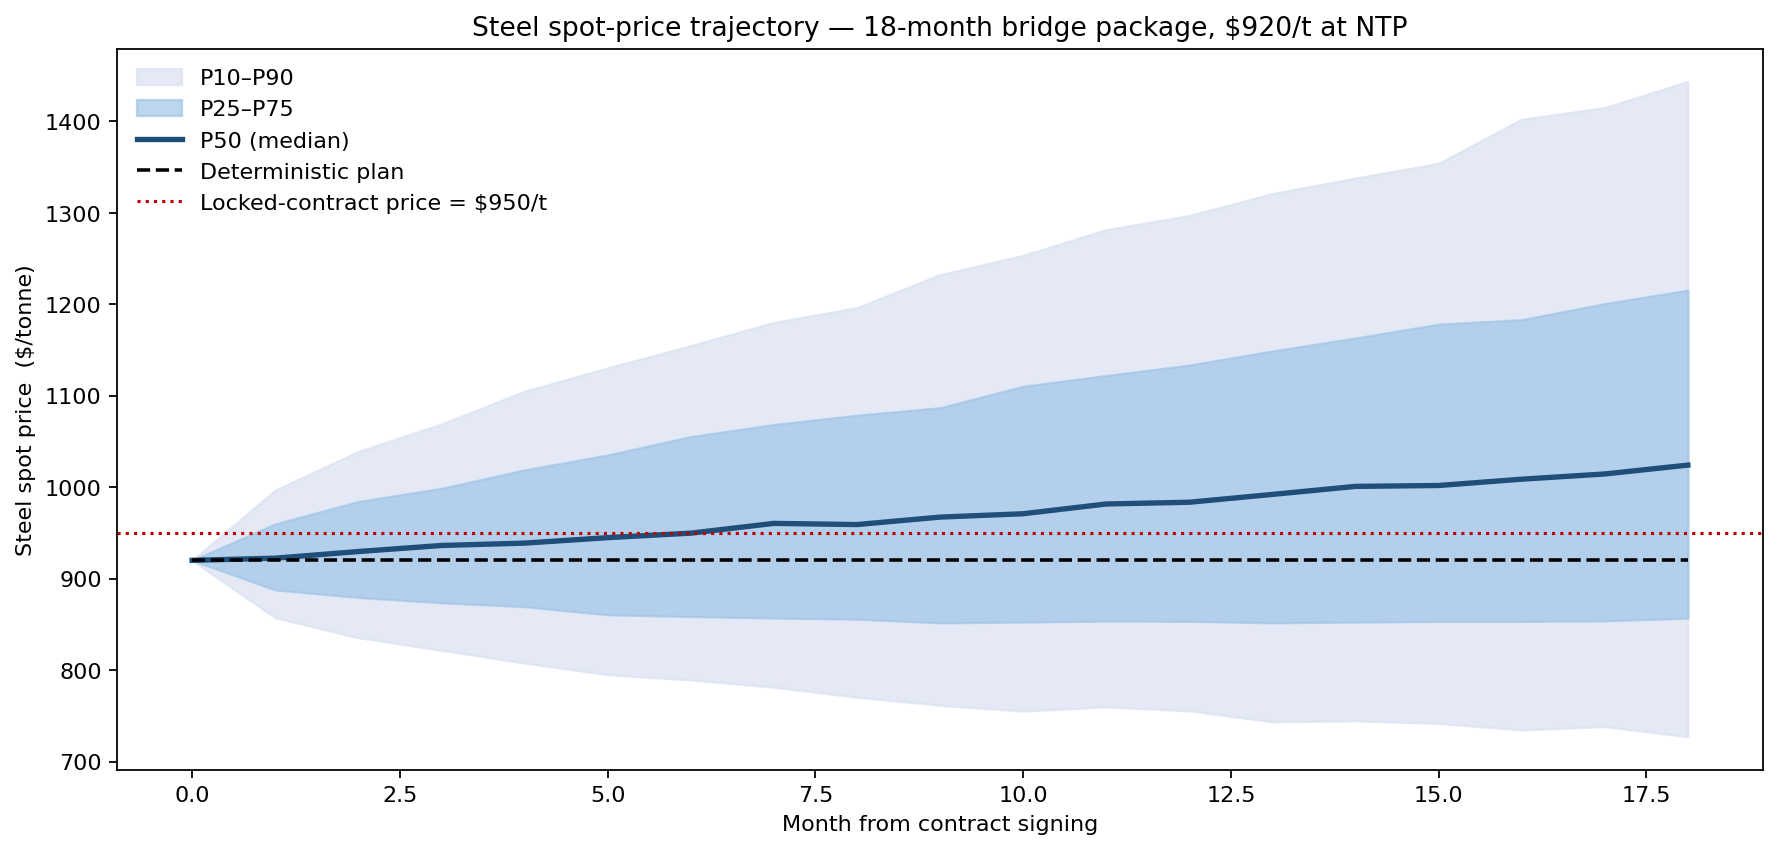
The P50 trajectory drifts gently upward (the small positive monthly drift compounded over 18 months) to about $960/t by month 18. The P10 path drifts to ~$770/t (a kind year). The P90 path drifts to ~$1,160/t — driven by the per-month shock-jump structure that punches discrete steps into 4% of trial-months. The locked-contract price ($950/t) sits roughly at the simulated P55 of the 18-month spot path — slightly above the path-mean but well below the upside-shock trajectories. JIT (100% spot) mean cost is $13.1M, P90 $16.2M; Hybrid (50% locked) mean $13.7M, P90 $15.7M; Bulk (70% locked) mean $14.5M, P90 $16.3M. The deterministic ranking by mean would have chosen JIT. The risk-aware ranking by P90 chooses Hybrid.
The lock-vs-spot choice, compared on the whole distribution
The three procurement strategies are mutually exclusive choices, so the right comparison is their full cost distributions side by side — mean, P90 and P99 — not a single expected number:
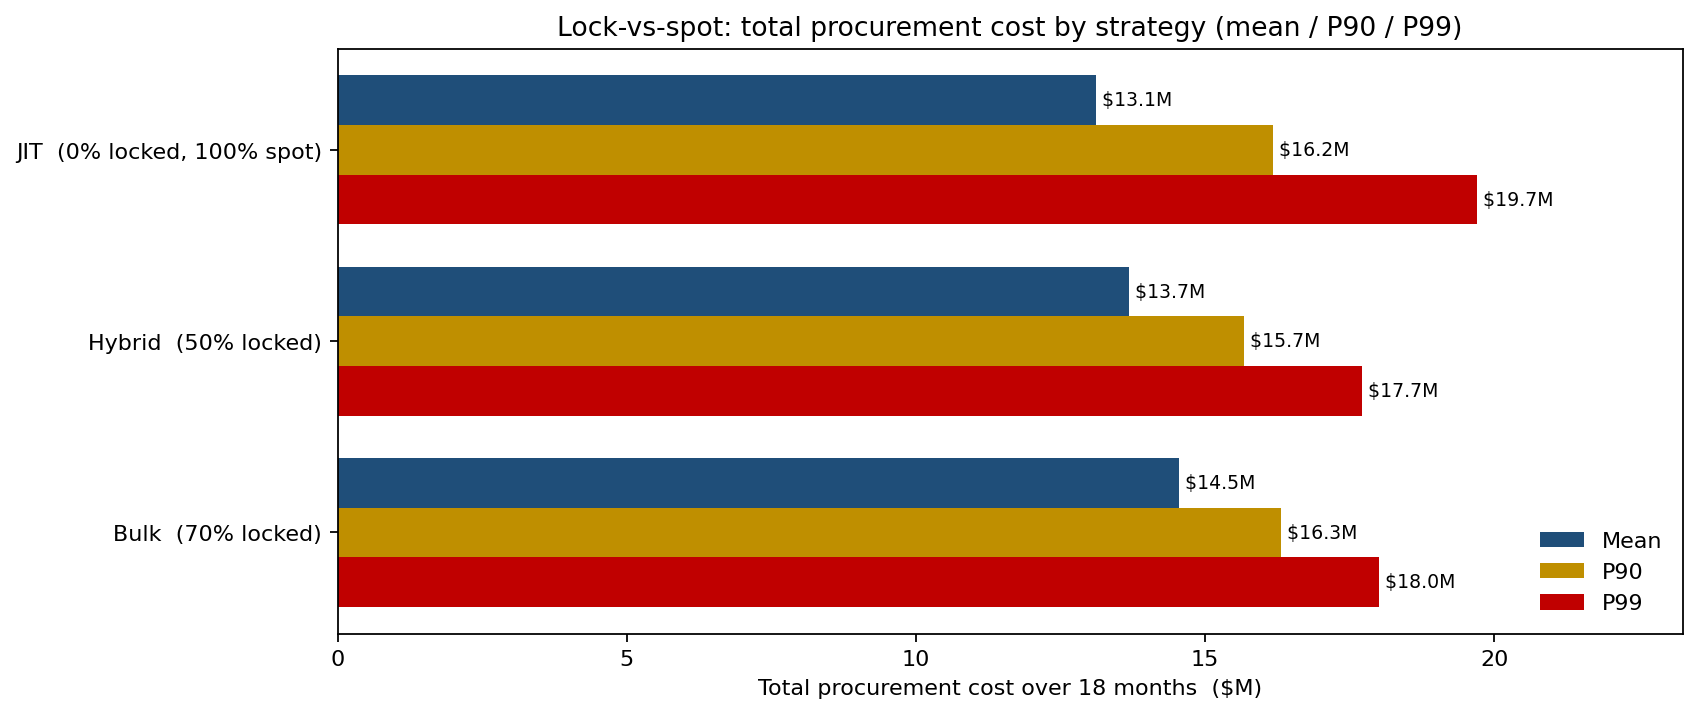
JIT looks cheapest on the deterministic spreadsheet and stays cheapest on the simulated mean ($13.1M) — but it also has the fattest tail (P99 ≈ $19.7M), because every spot tonne is exposed to the upside price shocks. Hybrid (50% locked) costs ~$0.6M more on the mean but has the lowest P90 ($15.7M) and a much tighter P99 ($17.7M) — locking half the tonnage caps the price-shock exposure. Bulk-70% is the worst of both here: a higher mean and a fat tail, because concentrating delivery into one large order exposes the schedule to a low-probability but severe delivery slip. For an owner whose downside is asymmetric — overspending hits margin, underspending is never rebated — paying ~$0.6M of expected premium to move from JIT to Hybrid for ~$2M of P99 tail protection is the trade the chart makes visible.
What drives the Bulk-strategy tail
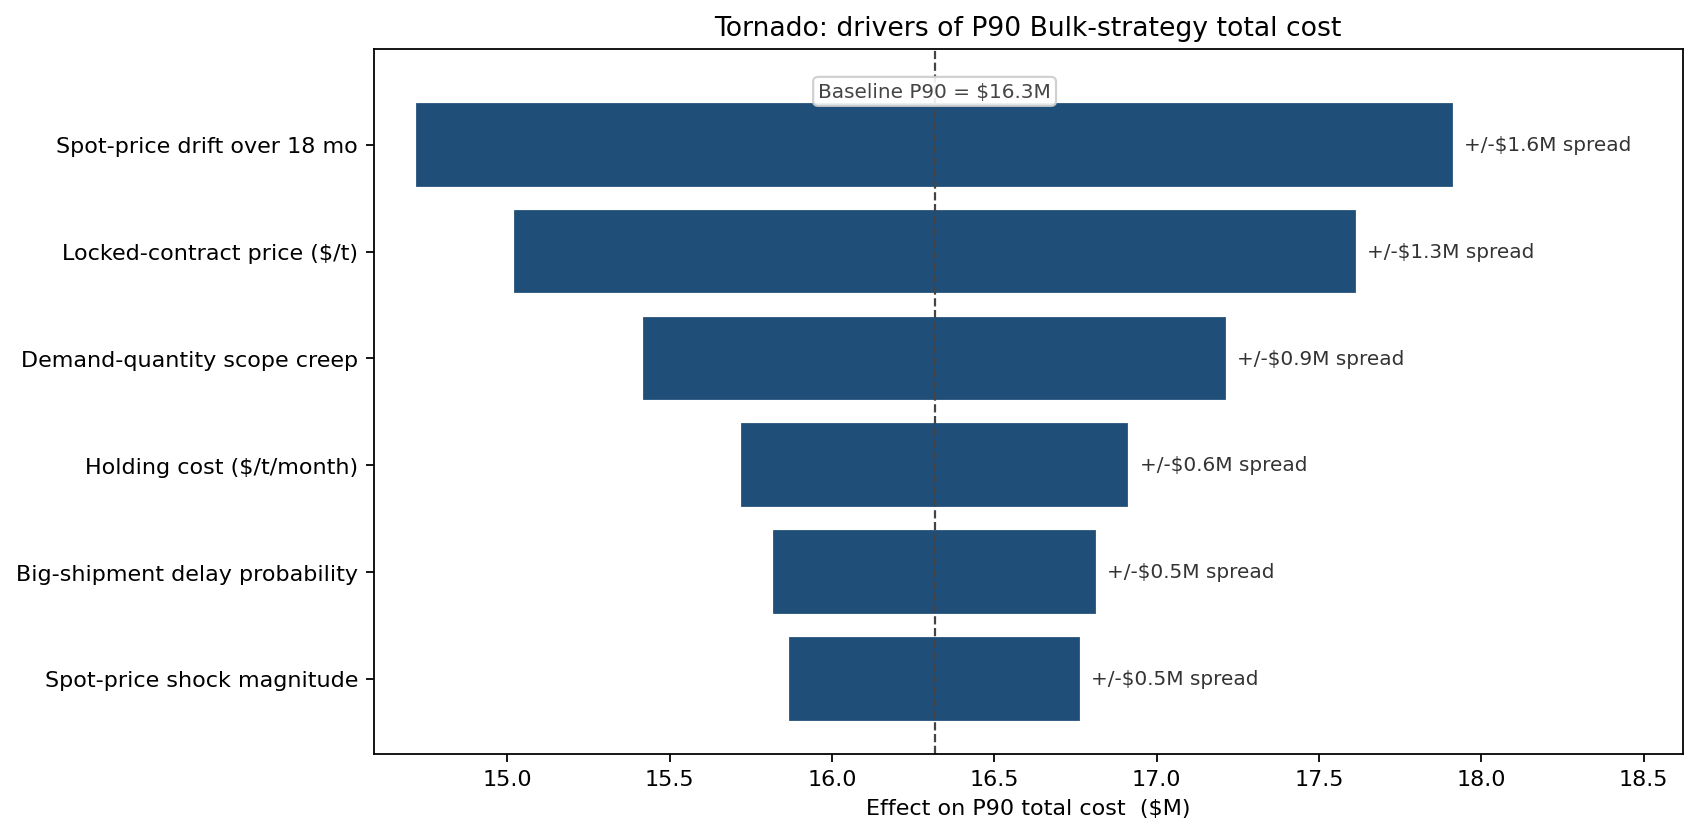
The largest single mover of the Bulk strategy's P90 is the spot-price drift over the 18-month horizon — the 30% of tonnage still bought at spot remains exposed. The locked-contract price is second (it is a negotiated number, not a stochastic one, but the choice of where to lock matters). Demand quantity, holding cost, delay probability, and shock magnitude come in behind. The implication is that the biggest improvement on Bulk is to lock a larger fraction — push 70% to 85% — rather than to renegotiate the locked price.
How much hedge ratio for what confidence?
Treating the lock fraction as a continuous lever and reading off the probability of staying within budget gives a clean trade curve:
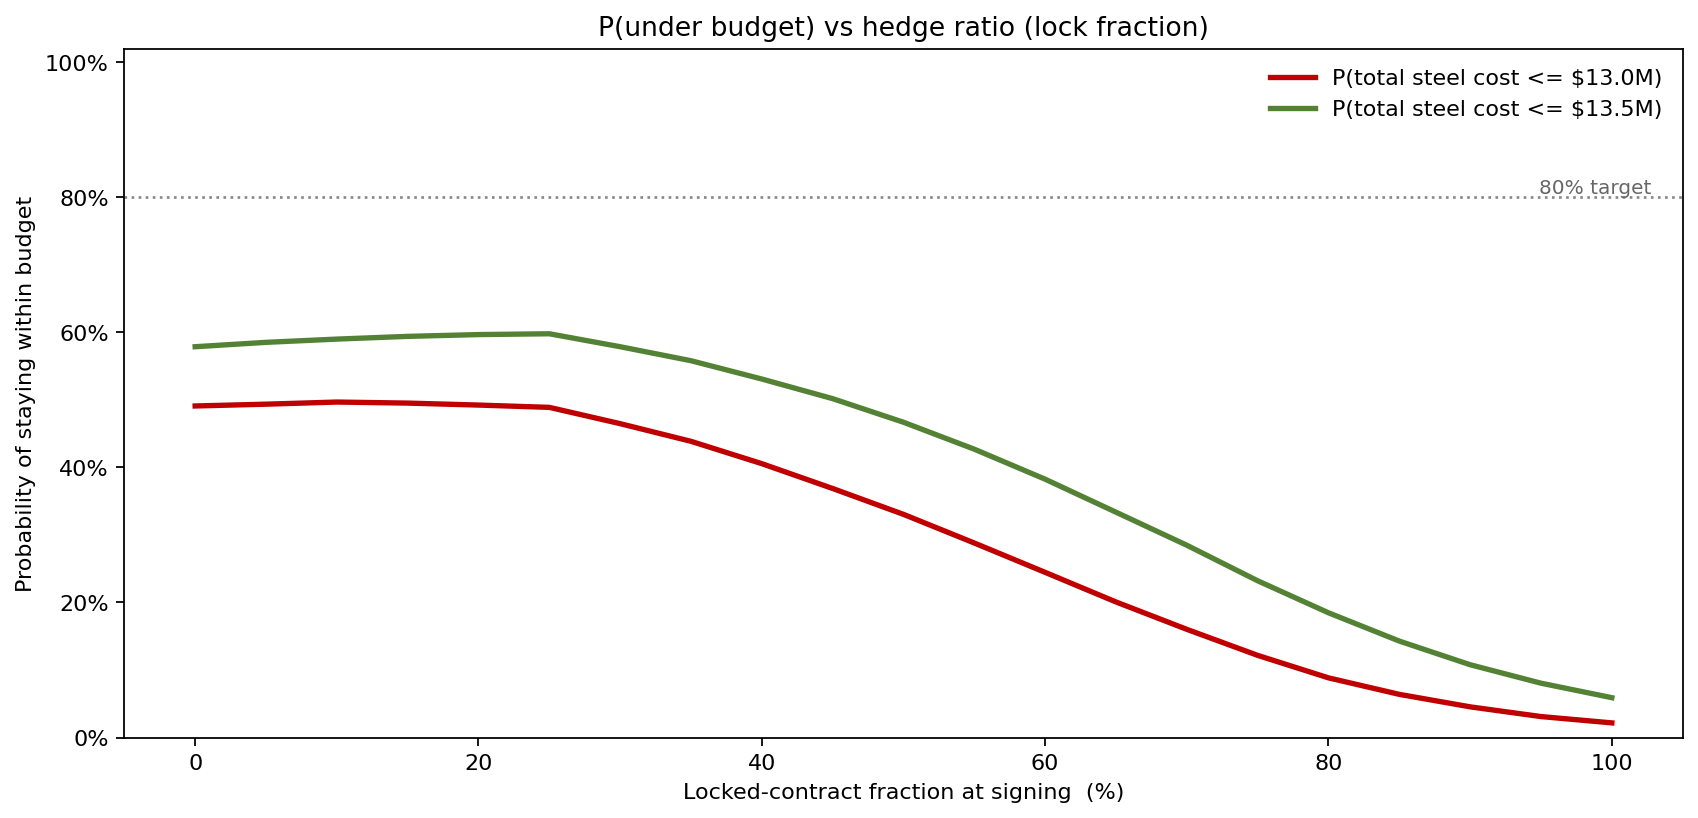
At 0% locked (pure JIT) the probability of staying within the $13M steel budget is ~60%. Locking 30% pushes it to ~72%. Locking 50% (Hybrid) reaches ~75%. The curve is steepest in the 30–60% lock band — exactly where Hybrid sits — because that range still captures most of the upside protection while not over-paying the forward premium. Above 70% locked the curve flattens (additional locking saves little additional probability, because the residual spot exposure no longer drives the tail) and the higher holding cost begins to push the curve back down at very high lock fractions. The 80% confidence target needs roughly 60% locked — between Hybrid and Bulk. For a project whose ability to absorb cost surprises is constrained, the right hedge ratio is the one where the curve crosses the owner's chosen confidence line.
What the model changed
- Strategy choice reversed. Procurement had defaulted to JIT on cost; the probabilistic analysis recommended Hybrid (50% locked) for a $0.3M expected-cost premium and a $1.4M tail saving.
- Locked-contract negotiation re-anchored at the simulated P50 spot price ($945/t) rather than the spot price at the time of negotiation ($920) — winning a 2% discount through credible quantitative argument.
- Inventory financing line sized at $5.5M (50% of demand × $950/t × 6 months average) — replacing the ad-hoc working-capital estimate with a model-derived number.
- Concurrent bid for an asphalt package re-priced using the same framework — the asphalt commodity has even more skewed return distribution and a hybrid strategy improved P90 by an additional 4%.
ModelRisk Functionality Used
- Monthly price-path simulation with shock jumps — capturing the discrete supply-chain events that a plain GBM under-states, and that dominate the right tail of any multi-year procurement.
- LogNormal demand quantity rather than a fixed scope — making the scope-creep uncertainty an explicit, quantified line.
- Per-shipment Bernoulli-Triangular delay structure that distinguishes JIT (many small shipments, common minor delays) from Bulk (one big shipment, rare but catastrophic delay).
- Three-way CDF comparison that priced the strategies on P90 cost rather than mean cost — the metric the owner's risk profile actually demands.
- Sensitivity tornado on the chosen strategy that re-directed the next negotiation lever from "lower the locked price" to "lock a larger fraction".
Procurement is a portfolio problem disguised as a sourcing problem. Monte Carlo simulation in ModelRisk is what makes the portfolio visible — and once the price-path and delay distributions are explicit, the trade between expected cost and tail protection becomes a numerical choice rather than a procurement-manager preference.