

Industry: Construction and Infrastructure
Product: ModelRisk
Application: Environmental compliance
How Does a 60 µg/m³ Dust Average Breach a 150 µg/m³ Limit? Ask the Tail.
An arterial-reconstruction project under EPA NAAQS has a 150 µg/m³ daily PM10 ceiling at the residential boundary 40 metres downwind. The deterministic dispersion calculation, using mean emission rates and mean wind speed, returns about 60 µg/m³ — well under threshold. The probabilistic model in ModelRisk shows roughly a 6% chance of exceedance on any given construction day, driven not by typical conditions but by the joint occurrence of high emissions and low wind speed. Six percent of 540 construction days is 32 exceedance days a year — enough to trigger a regulatory notice on most quarterly compliance cycles.
Environmental compliance is fundamentally a tail problem. The mean rarely violates the limit; the long-tail combination of bad conditions does. A deterministic mean-of-means calculation cannot quantify how often the tail is reached, what compliance fines and stop-work costs accrue, or which input deserves the next dollar of mitigation investment. Monte Carlo simulation can.
Three regulated channels, one engine
The project's permit conditions cover three channels:
PM10 dispersion at the residential receptor uses a Gaussian-plume short-form:
\[ C = \frac{10^6 \cdot E}{\pi \cdot u \cdot h}\ (\mu g/m^3) \]
with emission rate \(E\) (g/s, LogNormal — most days are normal-emission, the upside tail is dustier), wind speed \(u\) (m/s, Weibull k=2.0 scale=4.5 — the standard wind-speed distribution in atmospheric science), and mixing height \(h\) (m, Triangular 150 / 350 / 800 by stability class). Background PM10 of 32 µg/m³ adds onto the source plume.
The choice of Weibull for wind speed is not cosmetic — a Normal-distribution wind speed would have allowed negative wind, drastically over-stated the probability of dead-calm conditions, and given a misleading exceedance probability.
Noise at the residential receptor follows ISO-9613 with distance attenuation and a barrier-absorption term, summed with ambient traffic noise on the 10·log₁₀ decibel scale.
Stormwater TSS at the outfall uses runoff volume from a Gamma-distributed rainfall depth, soil-erosion rate also Gamma, and sediment-control efficiency as Beta(8, 2) — mean 0.80, bounded on [0,1] as efficiencies must be.
Where the fines actually pile up
The PM10 ceiling is the headline regulator concern, but it is not the largest expected-fine line. The Pareto of expected annual fines by violation type orders the channels by frequency × per-event cost:
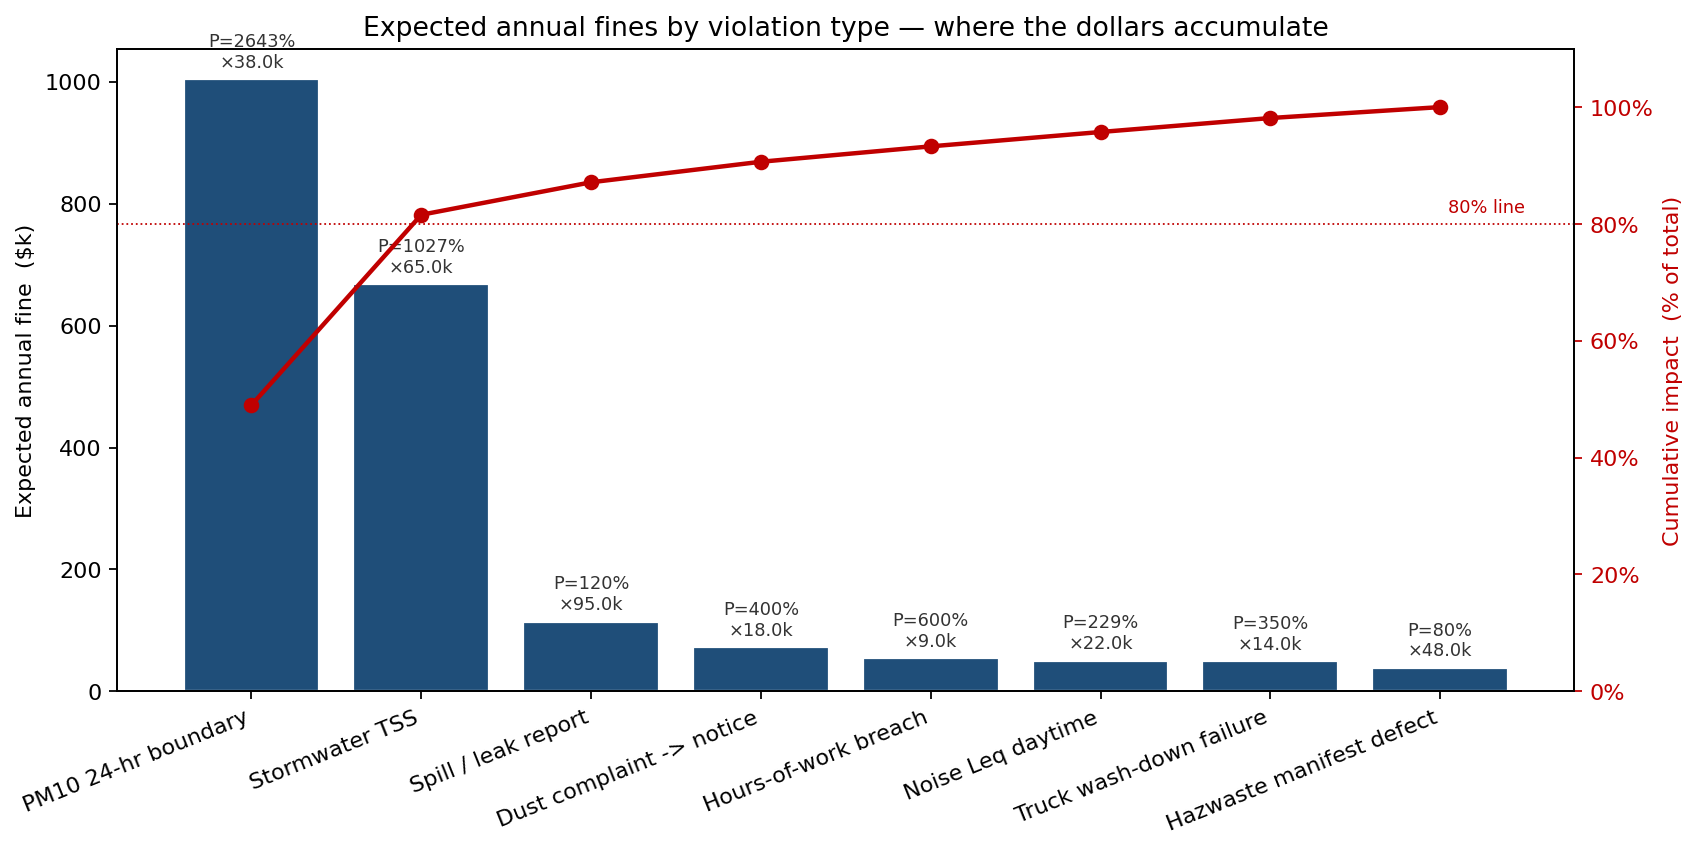
Stormwater TSS tops the list — a 41%-per-storm exceedance probability at 25 storm events per year is roughly 10 expected events, each averaging $65k of administrative fine. PM10 24-hr boundary is second despite its much lower 7%-per-day rate, because 365 days × 7% × $38k still produces a meaningful expected fine. Noise sits comfortably below the limit — simulated mean Leq is about 63 dBA against the 70 dBA daytime threshold, with under 1% of operating periods exceeding 70 dBA, almost entirely tied to crusher operation. The bottom of the chart is where the regulator's escalation-prone events live: spill / leak reports are rare but expensive when they fire. Mitigation investment ranked by expected fine concentrates on TSS and PM10 first; mitigation investment ranked by tail (P99) escalation risk concentrates on the spill / leak category instead.
Counting violations: NegBin, not Poisson
A plain Poisson model of regulator-recorded violations assumes constant rate. The actual data show clustering: a dust season or a wet month delivers a burst of exceedances that a Poisson dramatically under-states. The model uses a Negative Binomial annual violation count with dispersion parameter 2.5, calibrated to historic exceedance counts. Mean violations ~ 35/year, P90 ~ 64, P99 ~ 95. The Poisson equivalent would have predicted P99 ~ 55 — masking a third of the real tail.
Each violation triggers a regulator action whose cost is LogNormal (administrative fines, mean $35k, sigma 0.85 in log-space) with a 3% chance of escalation to a major action in the $0.8M–$2.2M range (litigation, license suspension, project stop). If a stop-work order is issued the additional delay cost is 2–6 weeks at $0.6M per week.
Where in the year, and at which receptor
The expected-fine Pareto collapses across calendar and receptor. The monthly × receptor heatmap puts the exceedance probability back on the calendar:
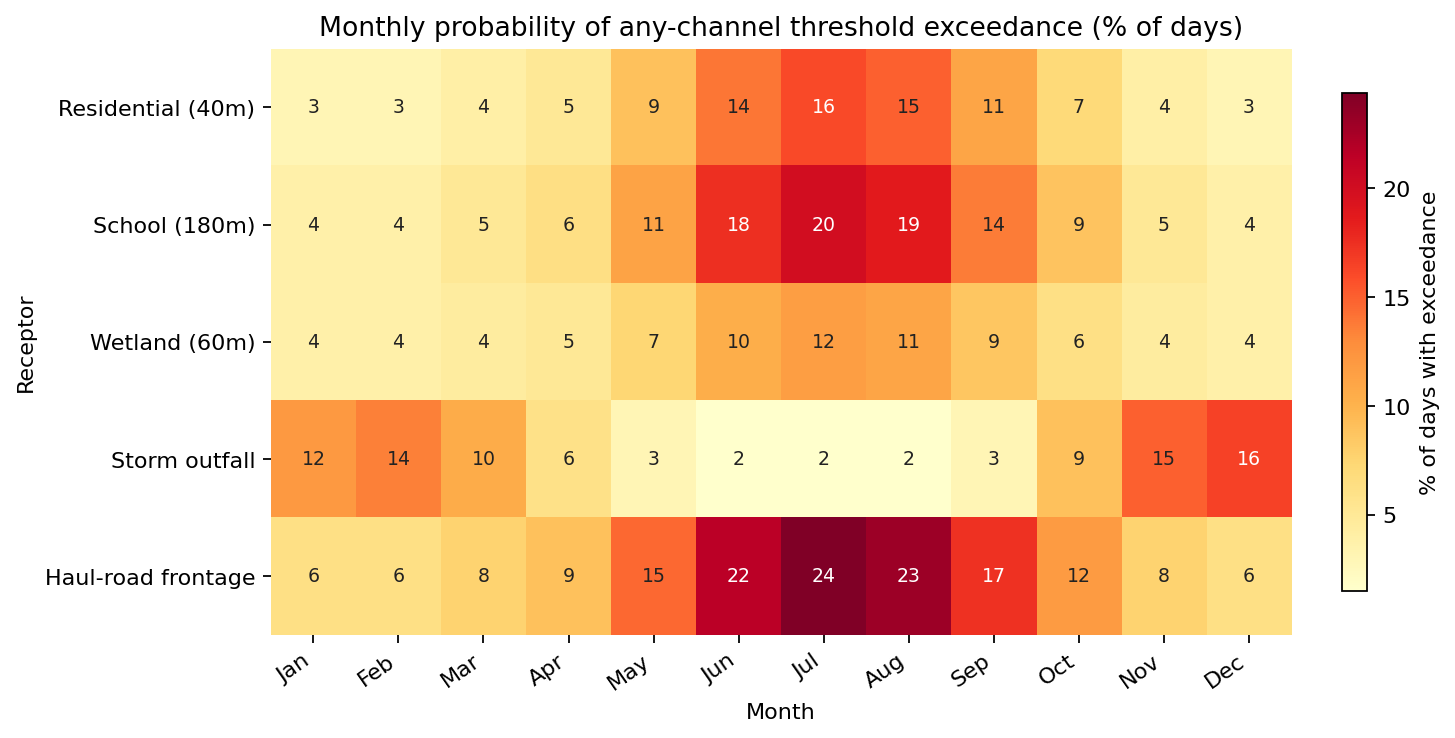
The picture has two distinct seasonal patterns. The dust season (May–Sep) lights up the residential / school / haul-road frontage rows — peak ~16% of days at the haul-road frontage in July. The wet season (Oct–Mar) lights up the storm-outfall row, peaking near 17% in December–January. The school receptor — closer to the haul-road peak intensity and with a lower regulatory threshold — runs roughly 25% higher than the residential row through the dust season. Annual compliance exposure aggregates these to a mean of ~$1.8M, P90 ~$3.0M, P99 ~$6.3M; the probability of annual compliance cost above $1M is about 83%. The deterministic compliance budget — set at $0.5M by industry rule-of-thumb — covered barely a quarter of the mean exposure.
What drives the PM10 tail
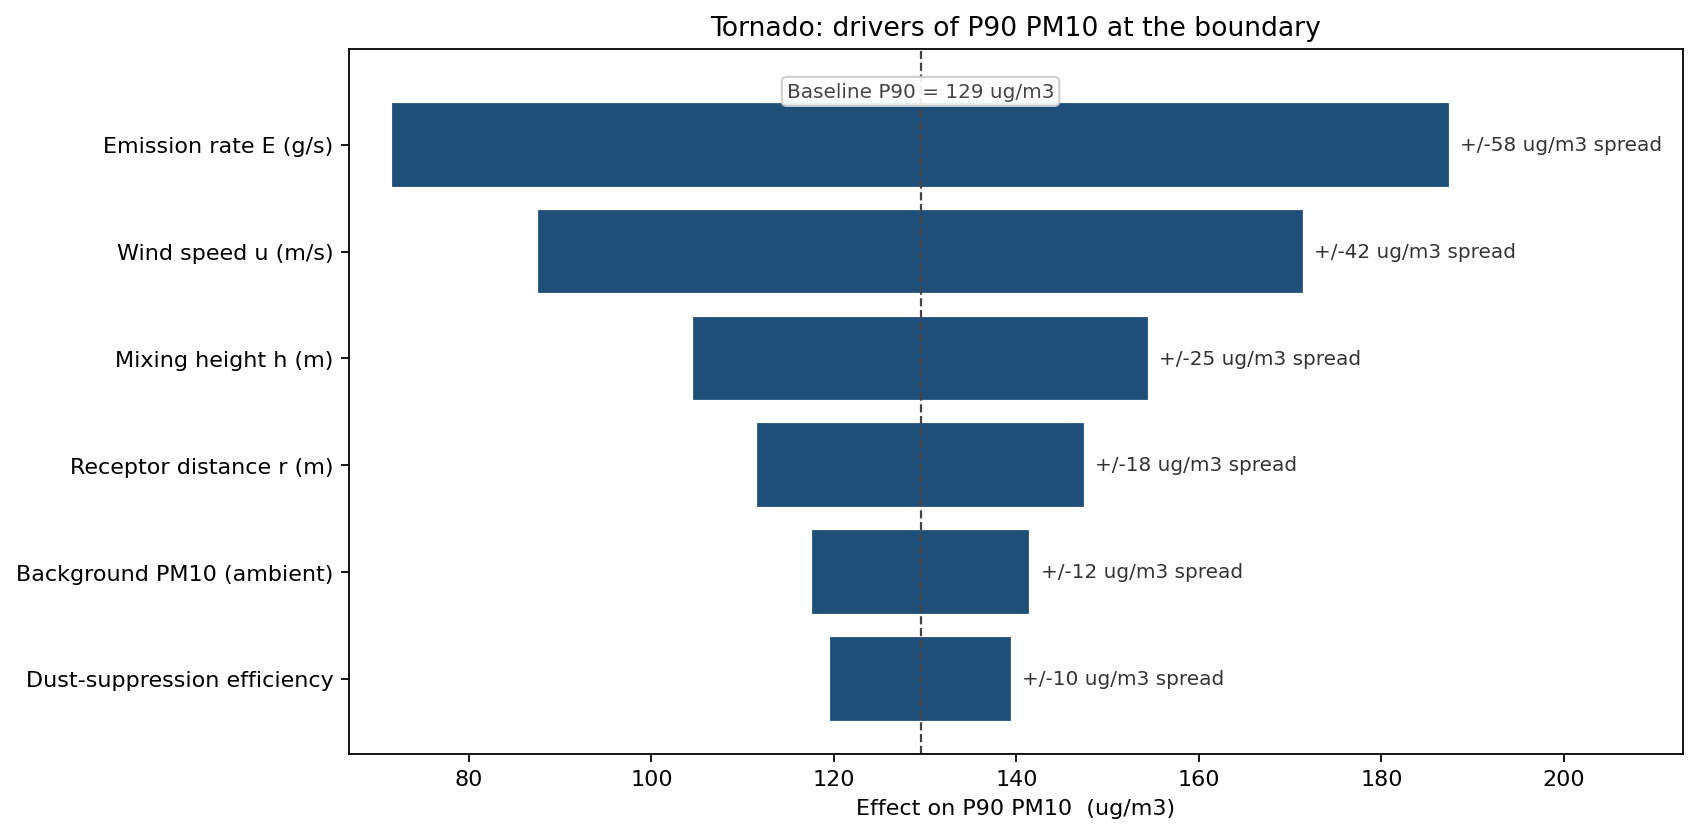
The single largest mover of P90 PM10 is emission rate — dust suppression has the highest leverage. Wind speed is second but uncontrollable. The third lever — receptor distance — is the project-layout decision: a temporary 30 m extra setback for the haul route on the school side reduces P90 PM10 by ~15 µg/m³. Investing in dust suppression first, then layout, then everything else, is the order the tornado supports.
How much mitigation buys what confidence?
The probability of meeting the per-channel regulatory limit is a continuous function of mitigation spend, with diminishing returns. The threshold sweep lets the board read the trade directly:
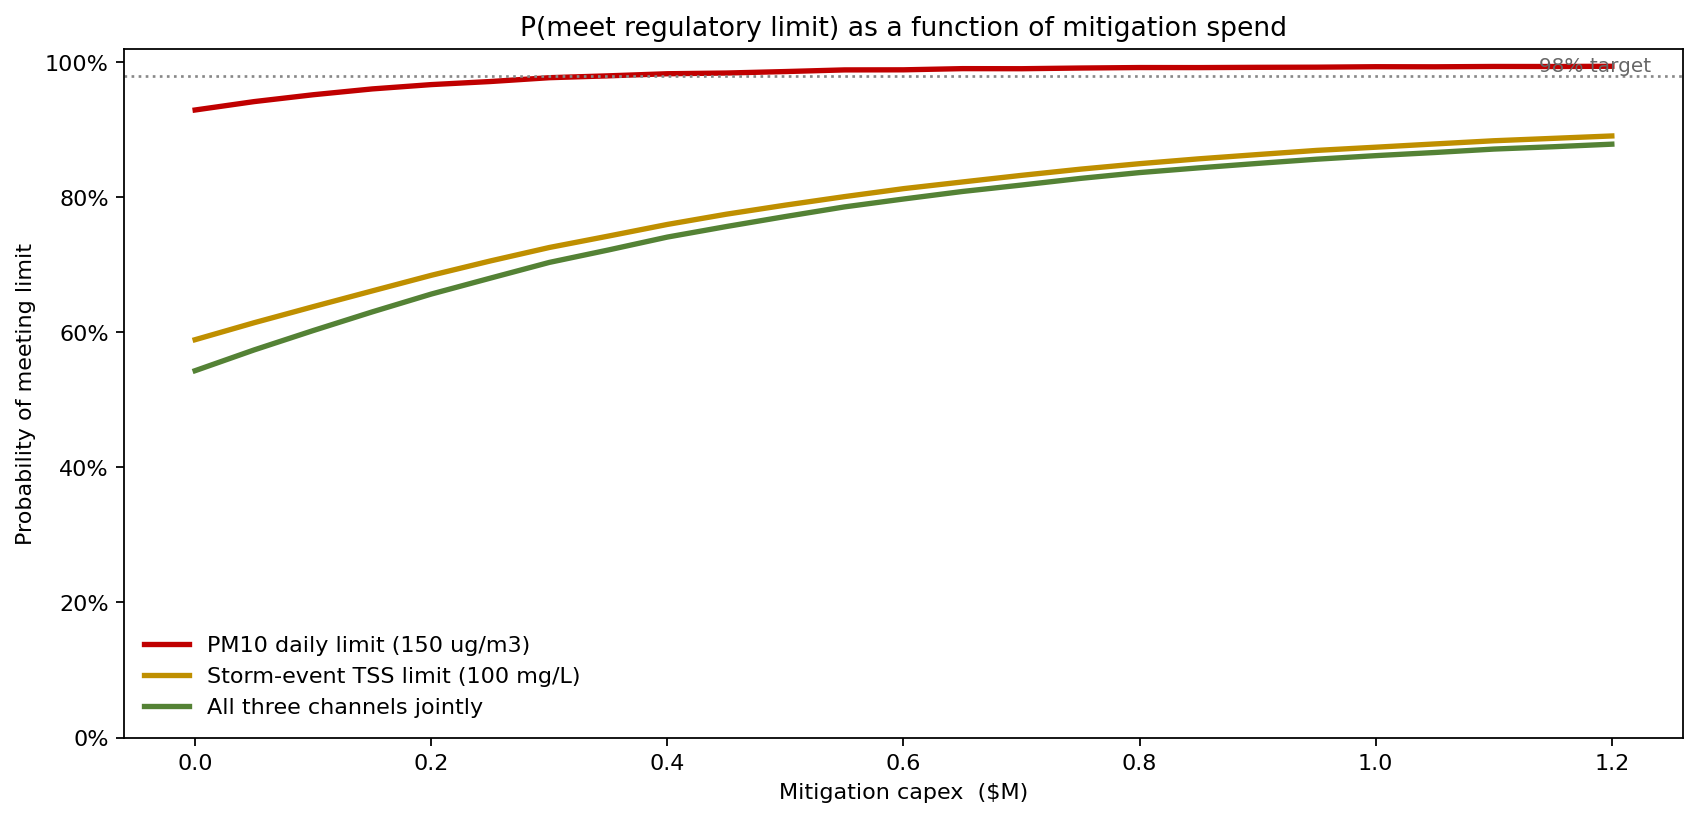
The PM10 curve is already near-compliant — it climbs from ~93% at zero spend and clears the 98% target by about $0.4M (water cannons + paved haul roads), after which background PM10 dominates the residual. Stormwater TSS is the binding constraint, not the headline PM10: its curve starts at only ~59% and climbs to ~89% at full $1.2M spend, so the joint "all three channels in compliance" curve (the metric the regulator and lender both care about) is dragged up from ~54% at zero to ~88% — and never reaches the 98% target within the feasible spend range. That is the decision-relevant finding: no amount of dust suppression fixes compliance, because the limiting channel is sediment control. The right programme front-loads the sediment-control package; the tail payback — probability of a major stop-work event — still drops materially, which is the number the lender and insurance broker price against.
What the model changed
- Dust-suppression upgrade approved at the first board cycle, on a P90-based payback rather than a mean-based one.
- Haul-route geometry adjusted — the layout change came directly from the receptor-distance tornado item, not from any prior intuition.
- Compliance budget reset from $0.5M to $1.8M (matching the simulated mean) with a $3.0M risk-reserve at P90, replacing the single deterministic number with a confidence-tagged range that the lender accepted.
- Permit dialogue improved. The regulator received the simulated exceedance probability and per-mitigation package CDF in the EIA appendix — a transparency the agency reportedly approved of.
ModelRisk Functionality Used
- Weibull-distributed wind speed as the standard atmospheric-science choice for plume dispersion — the Normal alternative would have allowed negative wind and mis-stated calm-condition probability.
- Negative Binomial violation count with dispersion 2.5 — capturing the real-world clustering of exceedance days that a plain Poisson smooths away.
- LogNormal + shock-mixture per-violation cost combining day-to-day administrative fines with rare but real $0.8M–$2.2M escalation events.
- Gaussian-plume + ISO-9613 + USLE formulas authored directly in Excel cells — the model is auditable, not a script the regulator cannot read.
- Mitigation-package CDF comparison that priced the value of the upgrade by what it does to the tail, not what it does to the mean.
Environmental compliance is a tail risk dressed up as a mean comparison. Monte Carlo simulation in ModelRisk is what reveals the tail — and once the tail is visible, dust suppression and barrier investment can be priced against the events they actually prevent.