

Industry: Biotech
Product: ModelRisk
Application: Quantifying uncertainty in vaccine development timelines and outcomes
A 70%-Efficacious Vaccine That Fails Its Trial 42% of the Time
A vaccine candidate with a true efficacy of 70% sounds like a comfortable win against a 50% regulatory bar. Yet simulate the Phase III trial that has to demonstrate that efficacy and a sobering number appears: among trials whose underlying vaccine is genuinely above the bar, 42% fail to prove it — the lower bound of the observed-efficacy confidence interval lands below 50% by chance. The vaccine is good; the trial is a noisy measurement of it. A go/no-go decision made on the point estimate "VE = 70%" is a decision made on a number the trial will reproduce only sometimes.
A vaccine developer rebuilt its immunogenicity-and-efficacy analysis in ModelRisk around the distribution of the trial readout rather than the point estimate of true efficacy. The question was not "how efficacious is the vaccine" but "what is the probability this trial demonstrates efficacy above the regulatory bar, given responder heterogeneity, a variable attack rate, and waning by the primary endpoint". The headline is that even with true efficacy fixed in distribution, the observed efficacy a trial reports scatters widely:
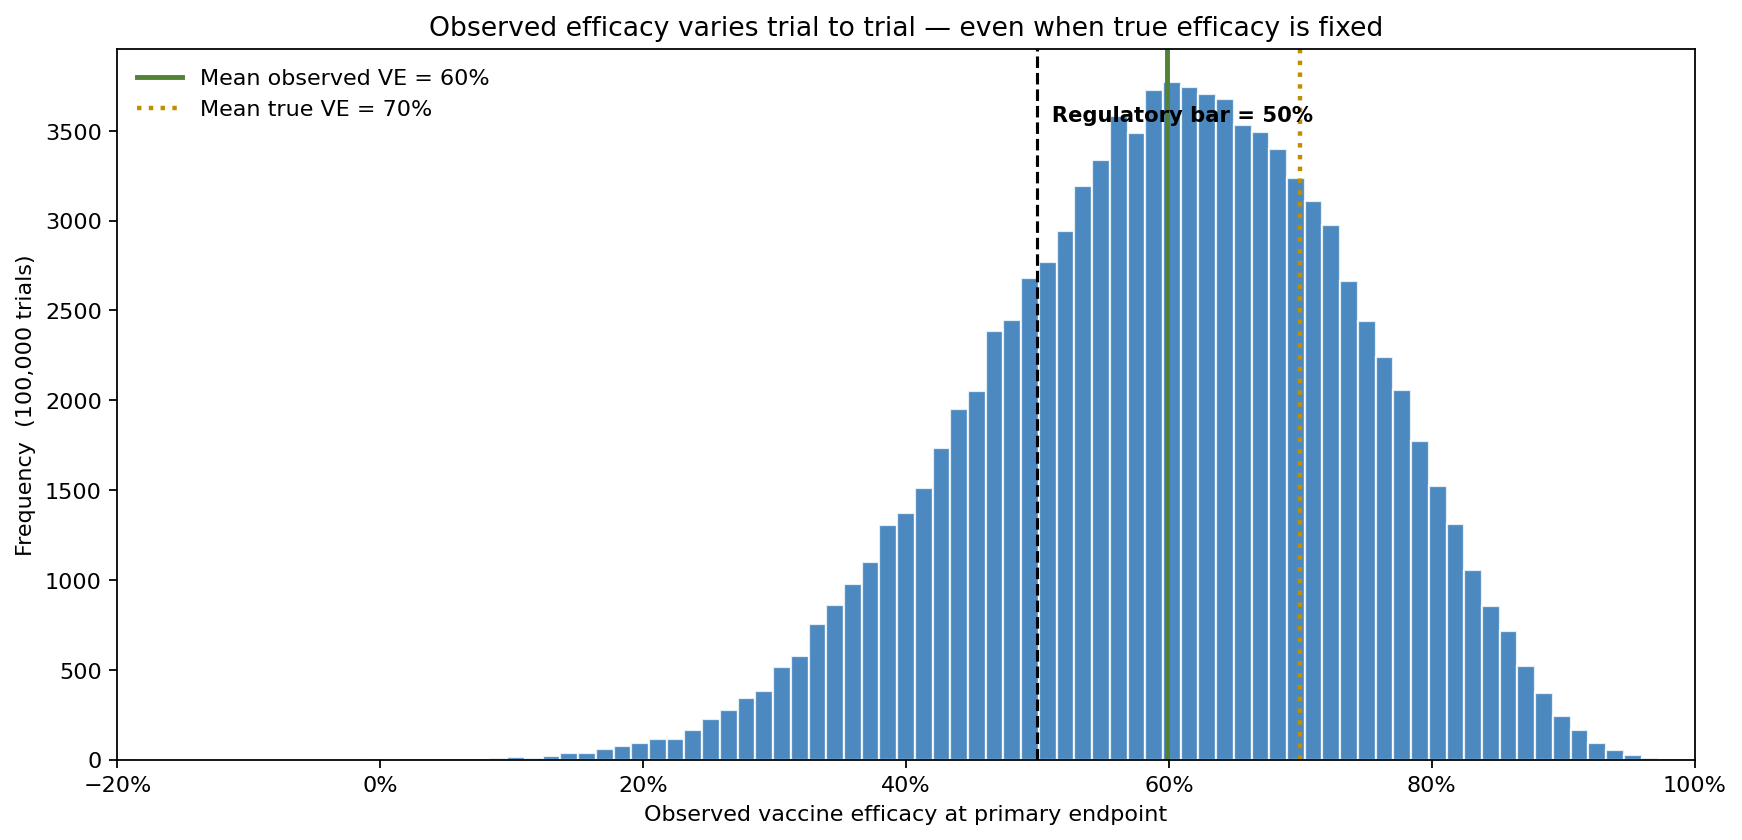
Mean true efficacy is 70%, but mean observed efficacy reads 60% — pulled down by waning between vaccination and the primary endpoint — and the observed readout spans a P10–P90 of 41% to 78%. The regulatory bar sits at 50%, and 76% of trials read out above it. The gap between "true 70%" and "demonstrated above bar 58% of the time" (using the stricter lower-confidence-bound criterion) is the entire reason to simulate rather than quote a single efficacy figure.
Why a point estimate fails
Vaccine efficacy is estimated from a ratio of rare event counts — infections in the vaccine arm versus the control arm. With a low attack rate, even a large trial sees only a few hundred infections, and the ratio of two Poisson-like counts is noisy. A point estimate of true efficacy says nothing about how often the trial's confidence interval will clear the bar, yet that frequency is the only thing that determines whether the program succeeds. Worse, waning means the efficacy measured at the primary endpoint is systematically below the peak efficacy — so the point estimate is biased high relative to what the trial will show.
A trial-level model with one shared truth per trial
Each simulated trial draws its governing quantities once, as trial-level common factors: true underlying efficacy (Beta, mean 70%, bounded in \([0,1]\)), control-arm attack rate (Beta, mean ~8%), and waning loss by the primary endpoint (Beta, mean ~14% of protection lost). Protection at endpoint is \(\text{true\VE}\times(1-\text{waning})\). Subjects then experience correlated outcomes through that shared truth: infections in each arm are Binomial draws on the trial's own attack and vaccine-infection probabilities, and the readout is \[ \widehat{VE} = 1 - \frac{\text{infections}_\text{vacc}}{\text{infections}\\text{ctrl}} \] with a 95% confidence bound from the log-relative-risk standard error.
The trial-level common factor is essential. If every subject's infection were an independent Bernoulli draw with a fixed probability, a 15,000-subject trial would estimate efficacy almost exactly and there would be no trial-to-trial distribution worth plotting — the central-limit theorem would collapse it. By drawing the true efficacy, attack rate, and waning once per trial and letting subjects inherit that shared truth, the model produces the genuine trial-to-trial spread that makes the success probability less than one.
Trial size has surprisingly little leverage
The instinct when success probability is low is to enrol more subjects. The trial-size sweep shows how weak that lever is here:
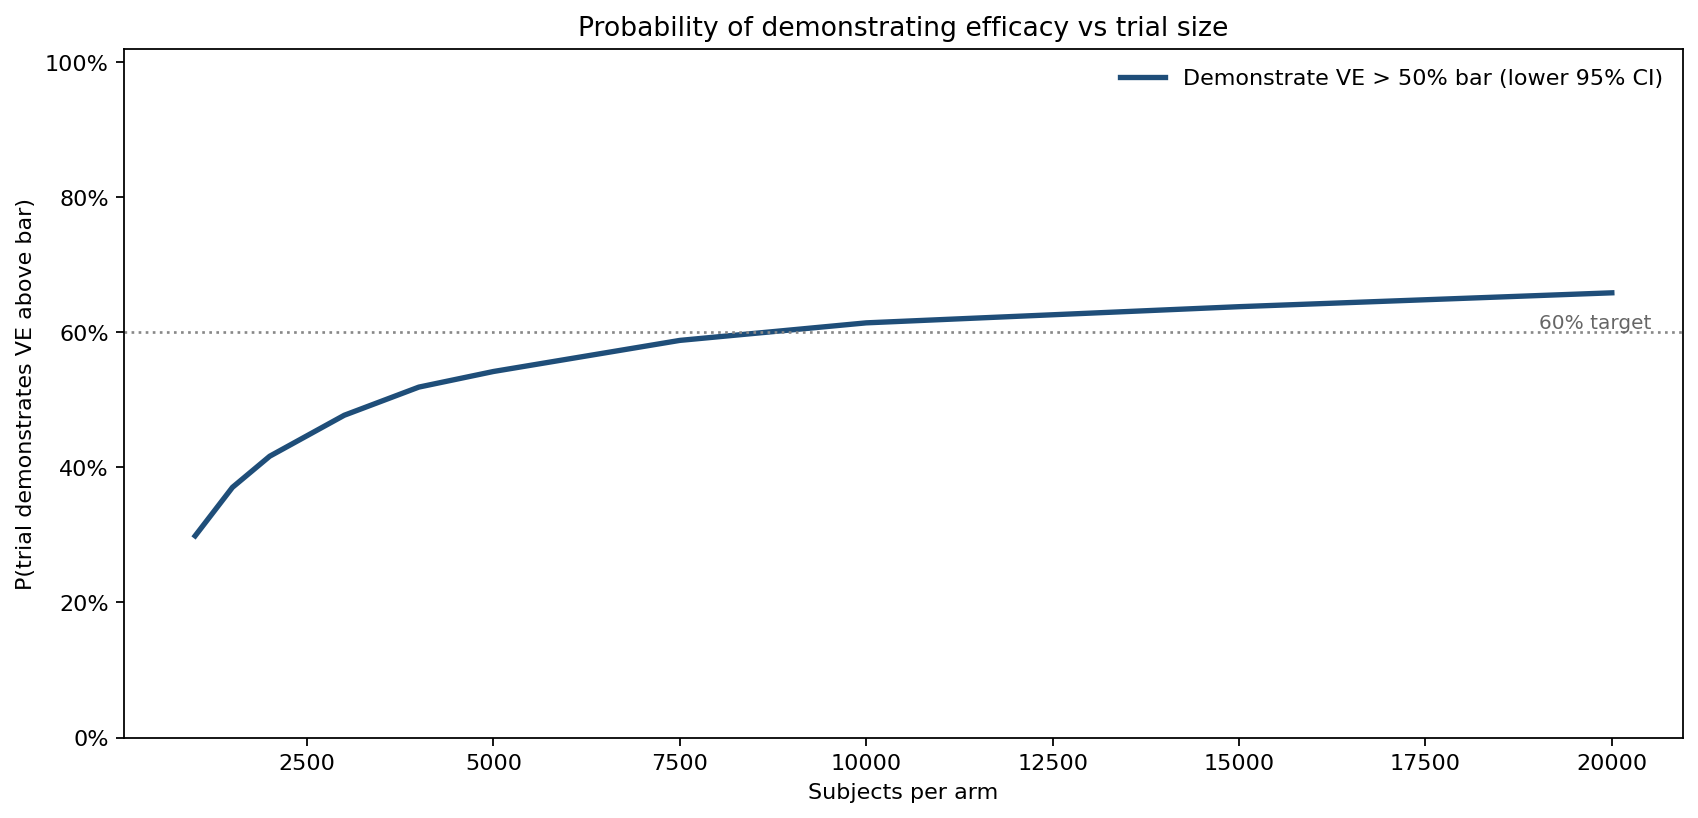
Going from 5,000 to 10,000 subjects per arm lifts P(demonstrate) only from 54% to 61%, and even 20,000 per arm reaches just 66% — the curve flattens hard. The 60% decision line is first crossed at 10,000 per arm. Subjects buy precision around the observed efficacy, but they cannot fix a trial whose true efficacy or waning happens to be unfavourable on that draw — those are set before the first subject is enrolled. You cannot size your way past efficacy and waning uncertainty.
What actually drives success
Tornado-ranking the drivers of P(demonstrate efficacy) confirms where the leverage really is:
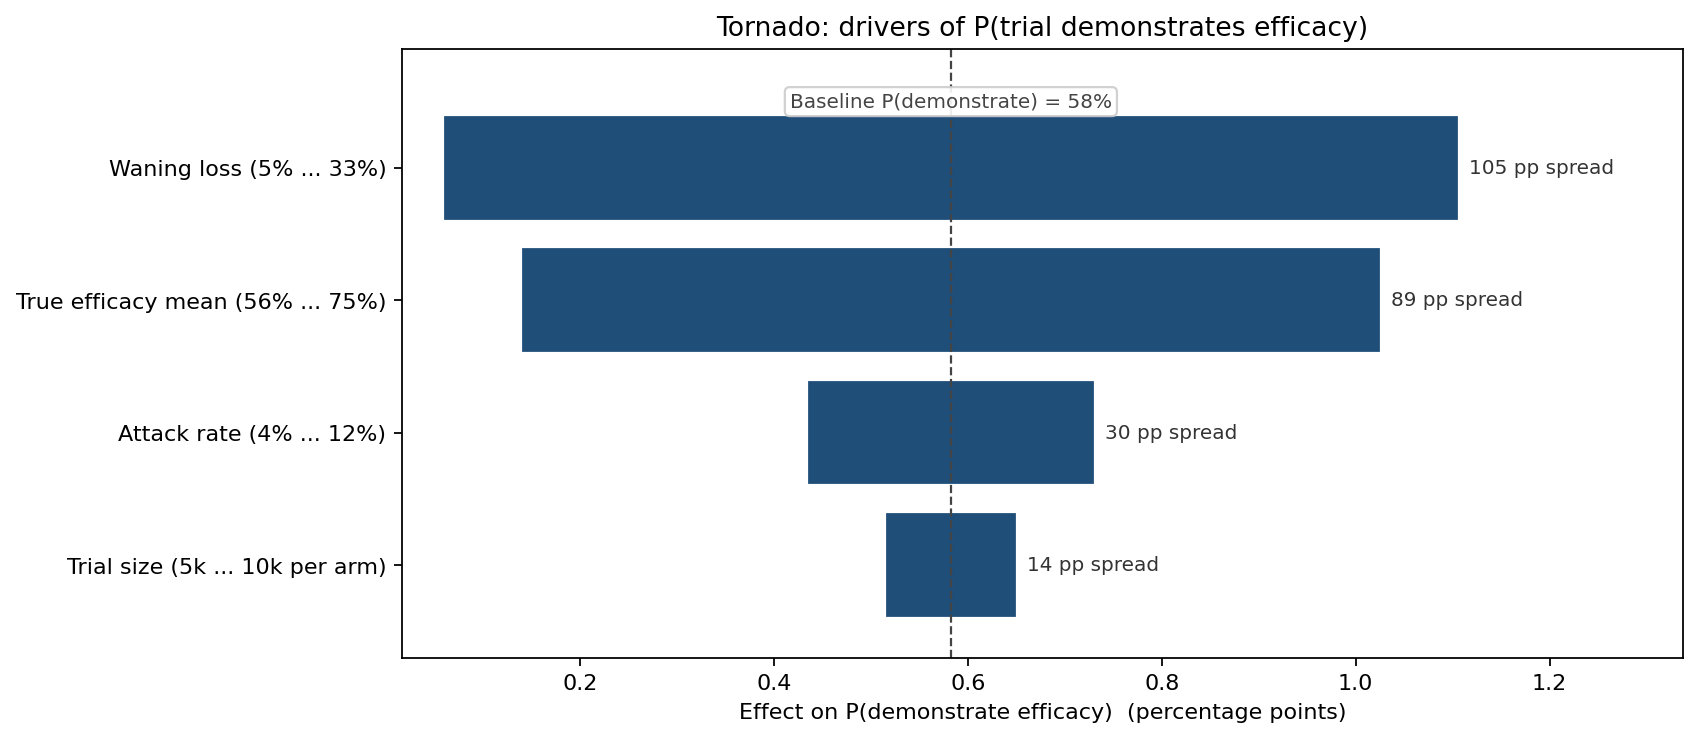
Waning loss dominates at 52 percentage points of swing (from low 5% loss to high 33% loss), with true efficacy second at 44 pp and attack rate third at 15 pp. Trial size is last at just 7 pp. The ranking inverts the usual program instinct: the highest-value investments are a longer-lasting formulation or an earlier primary endpoint (both attack waning), and conducting the trial in a higher-incidence setting or season (attack rate) — not a bigger trial.
The trial is a noisy measurement
Plotting each trial's true efficacy against its observed readout makes the measurement noise explicit:
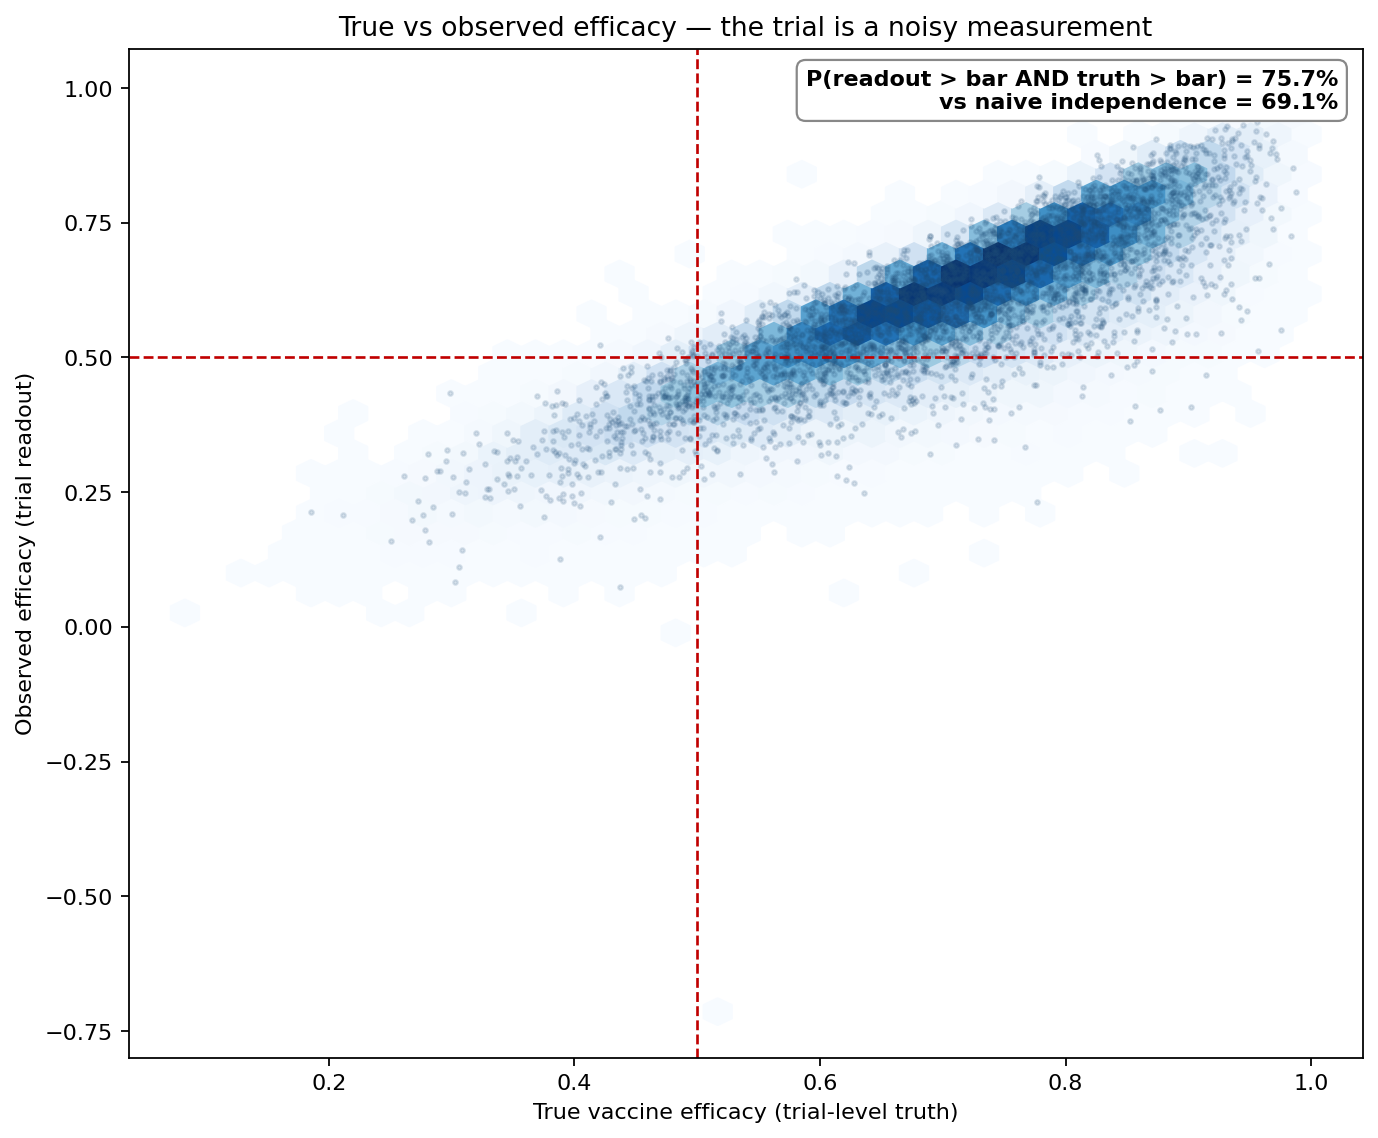
91% of trials have a true efficacy above the bar, but the readout-above-bar-and-truth-above-bar joint probability is 75.7% — meaningfully above the 69.1% a naive independence calculation would give, because true and observed efficacy are positively coupled through the shared trial truth. The cloud straddling the horizontal bar line is the 33% of genuinely-above-bar trials that read out at or below it under the strict lower-confidence-bound rule, alongside essentially 0% of below-bar vaccines that falsely clear — the trial errs toward missing good vaccines, not toward false positives.
What the model changed
- Go/no-go reframed around P(demonstrate), not point efficacy — the 58% lower-bound success rate on a genuinely 70%-efficacious vaccine triggered a redesign rather than a green light on the point estimate.
- Endpoint timing moved earlier after the tornado put waning loss (52 pp) ahead of every other lever, recovering observed efficacy lost to protection decay.
- Trial enlargement rejected as the primary fix: the sweep showed 5k→10k per arm buys only 7 pp, so budget shifted to a higher-incidence trial setting (attack rate) and the earlier endpoint.
- Site selection weighted toward higher-incidence regions to lift the attack rate and the event count the efficacy ratio depends on.
ModelRisk Functionality Used
- Monte Carlo simulation of 100,000 trials, each drawing trial-level true efficacy, attack rate, and waning (all Beta, bounded), with Binomial subject-level infections feeding the efficacy ratio.
- Trial-level common factors drawn once per trial so observed efficacy retains genuine trial-to-trial spread instead of collapsing under the central-limit theorem.
- Probability-of-success reporting via the lower 95% confidence bound on observed VE against the regulatory bar — the actual go/no-go criterion, not the point efficacy.
- Trial-size sweep computing P(demonstrate) across subjects-per-arm, quantifying how little leverage enrolment carries against efficacy and waning uncertainty.
- Tornado decomposition ranking waning and true efficacy far above trial size, redirecting program investment from headcount to endpoint timing and site incidence.
A vaccine is not "70% efficacious"; the trial that has to prove it returns a distribution of readouts, and the program lives or dies on how often that distribution clears the bar. The simulation in ModelRisk replaces "VE = 70%, comfortably above 50%" with "demonstrates above bar 58% of the time, limited by waning, and unfixable by trial size" — the number a development committee can actually plan against.