

Industry: Biotech
Product: ModelRisk
Application: Protein Folding Analysis
1% vs 96%: Picking the Expression Construct That Actually Folds Soluble
The number that decides whether a recombinant therapeutic protein reaches manufacturing is not its melting temperature or its predicted \(\Delta G\) — it is the soluble, correctly-folded fraction of expressed protein. Everything else aggregates into inclusion bodies and is lost to yield. For the five candidate expression constructs of this protein, the soluble fraction that clears a 60% target ranges from 1% of production batches to 96% depending only on which construct you pick. The construct decision, made early and cheaply, dominates every downstream refolding optimisation the team could attempt later.
A protein-engineering group rebuilt its construct-selection analysis in ModelRisk around the distribution of soluble yield per construct rather than a single predicted folding score. This is not directed-evolution screening — the team is not searching a mutant library for a winner — it is quantifying, for a fixed set of designs, the batch-to-batch soluble yield each one delivers and the probability it meets target. The headline is the gap between the best and worst construct, and how little overlap there is:
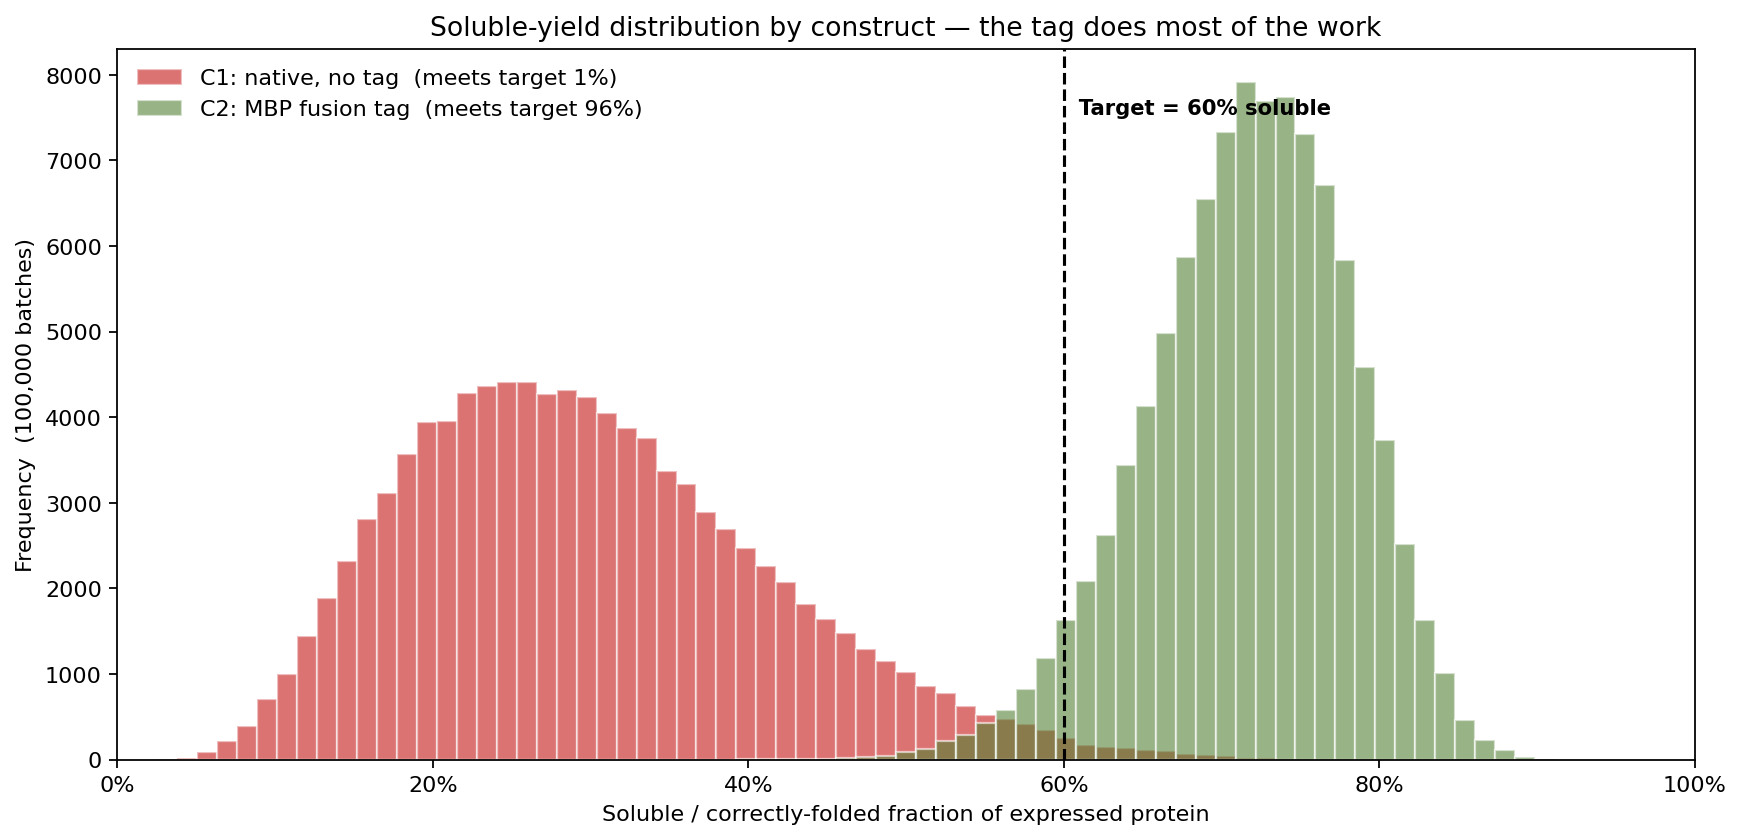
The native, untagged construct (C1) averages 30% soluble and meets the 60% target in only 1% of batches. The MBP-fusion construct (C2) averages 72% soluble and meets target in 96% of batches. The two distributions barely touch. No amount of process tuning on C1 will close a gap that the fusion tag closes by design — which is precisely why the construct choice has to be made on the distribution, not on a mean folding propensity that would rank C1 as merely "lower" rather than "almost never adequate".
Why a point estimate fails
A predicted folding free energy or a single "expected yield" figure collapses two different things into one number: the intrinsic folding propensity of the sequence-and-host design, and the batch-to-batch process variability around it. A construct with a 55% mean yield and tight batches can be a better manufacturing choice than one with a 60% mean and wide batches, because what gets a lot released is the probability the batch clears target — not the long-run average. A point estimate cannot express "meets target 35% of the time", and that frequency is the manufacturing criterion.
A two-level model with a shared construct propensity
Each construct has an intrinsic folding propensity \(p_\text{fold}\), a Beta-distributed property of the sequence and host strain, drawn once per construct. Individual production batches perturb that propensity through a logit-normal process factor (induction temperature, induction timing, chaperone availability), and the folded versus aggregated molecules are then sampled Binomially: \[ \text{soluble fraction} = \frac{\text{correctly-folded molecules}}{\text{expressed molecules}},\qquad \in [0,1] \]
The shared construct-level \(p_\text{fold}\) is the key modelling choice. If every molecule folded independently with a fixed probability, a batch of thousands of molecules would estimate the soluble fraction almost exactly and there would be no batch-to-batch distribution to speak of — the central-limit theorem would collapse the spread. By making \(p_\text{fold}\) a per-construct common factor and adding a batch-level process perturbation on top, the model produces genuine batch variability (P10–P90 spans of roughly 16 percentage points within a construct), which is what real production records show.
Every construct ranked against the target
Sweeping the target level shows P(meet target) for all five constructs at once:
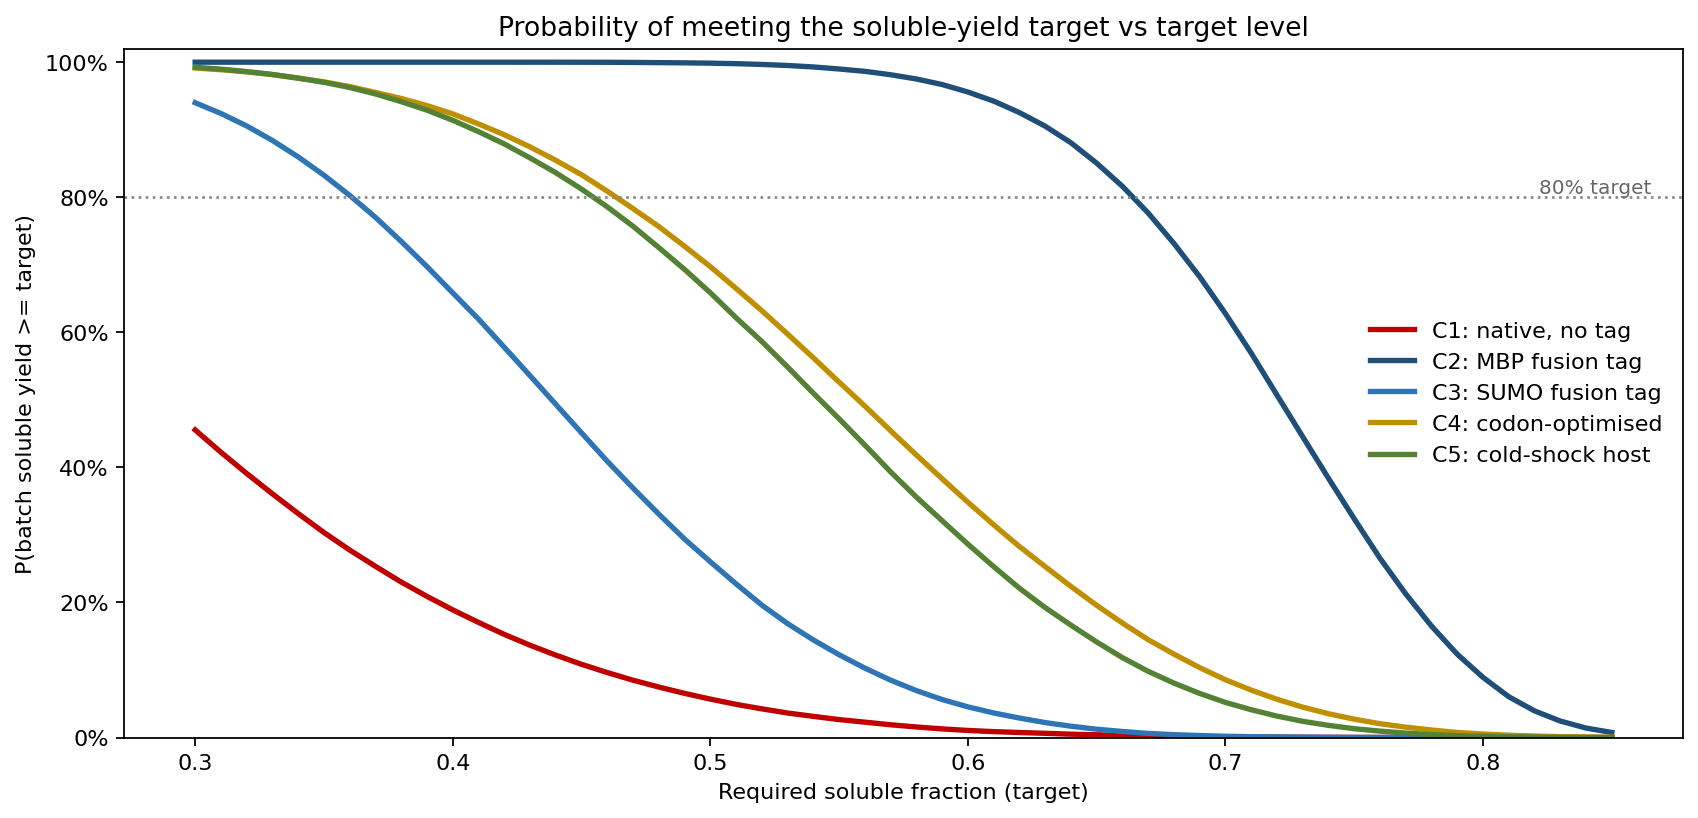
At the 60% target the constructs separate cleanly: C2 (MBP fusion) 96%, C4 (codon-optimised) 35%, C5 (cold-shock host) 29%, C3 (SUMO fusion) 5%, C1 (native) 1%. The sweep also shows how brittle the middle of the pack is — C4 and C5 sit on the steep part of their curves, so a small upward revision of the target (a stricter QC spec) collapses their pass rate, while C2 stays above the 80% probability line until the target climbs past 65%. That robustness is a property only the distribution reveals.
What drives soluble yield
Tornado-ranking the levers for the winning construct shows where the remaining yield comes from:
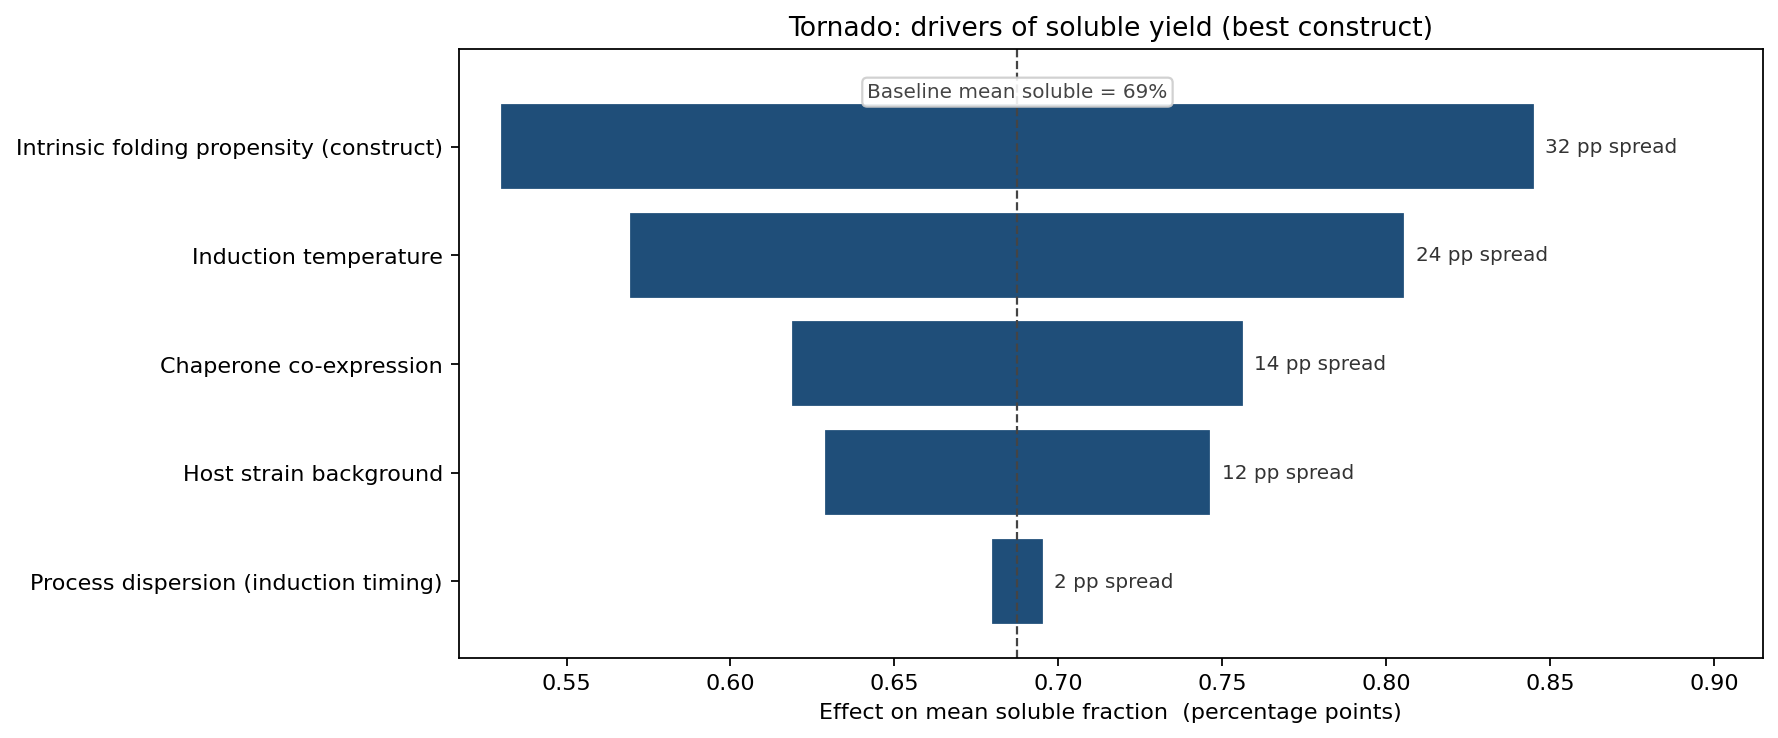
Intrinsic folding propensity dominates at 16 percentage points of swing — i.e. the construct design itself — followed by induction temperature (12 pp), chaperone co-expression (7 pp), and host-strain background (6 pp). Tightening process dispersion (better induction-timing control) moves the mean by only 1 pp: it narrows the distribution rather than shifting it. The message is that the largest yield lever is the construct/sequence choice already made, with induction temperature the most valuable operational knob — process-discipline investment improves consistency but not the average.
Construct ranking — the decision in one view
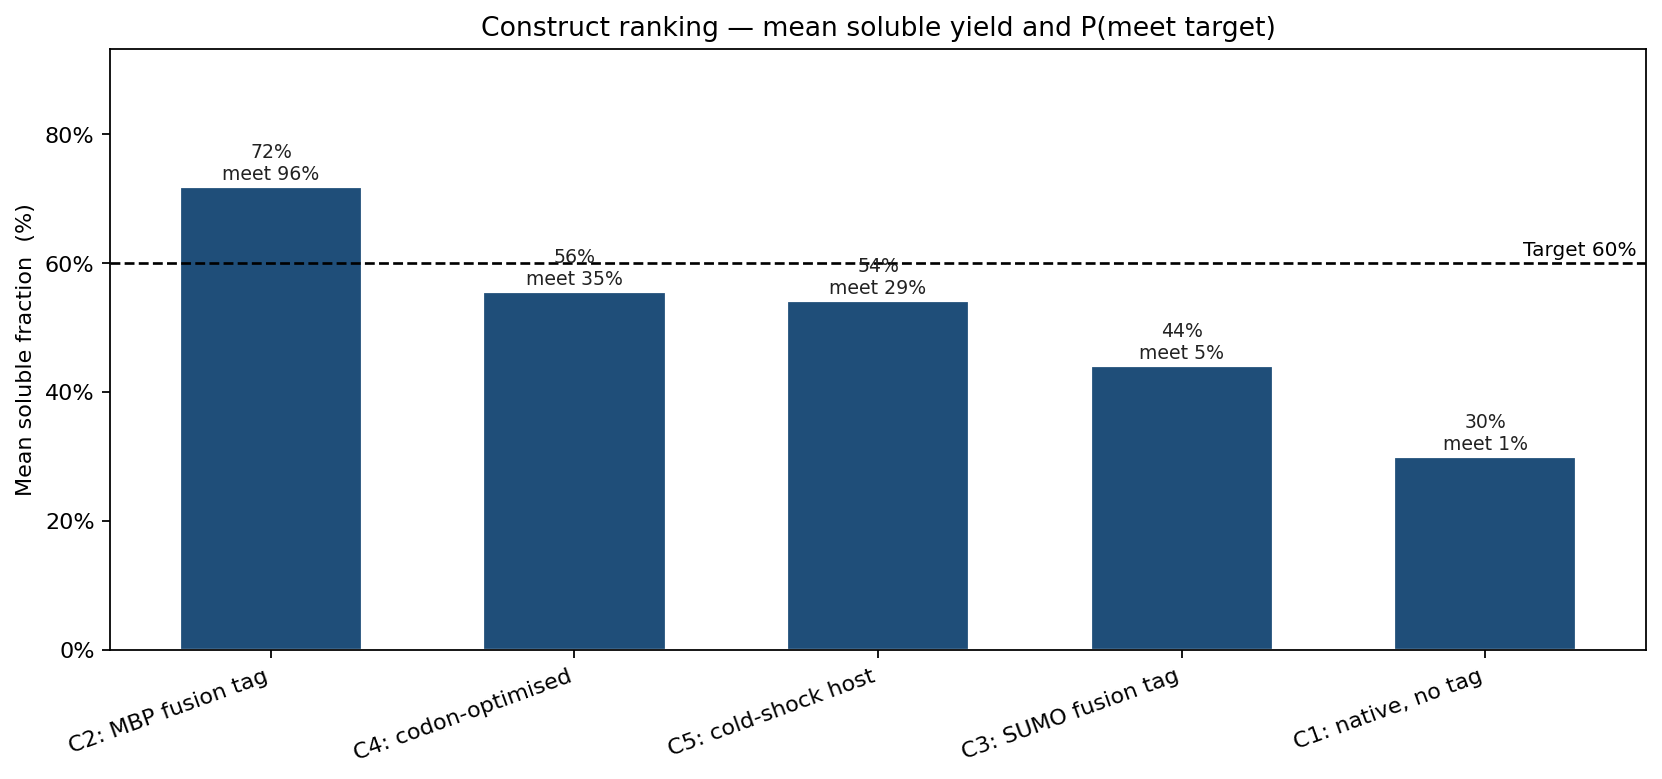
Ranked by mean soluble yield: C2 72% (meets target 96%), C4 56% (35%), C5 54% (29%), C3 44% (5%), C1 30% (1%). The ranking by P(meet target) is what the team carries into the lab: C2 is the clear lead candidate, C4 and C5 are viable only with process improvements that the tornado says would lift them modestly, and C1/C3 are non-starters at this target regardless of refolding effort.
What the model changed
- MBP-fusion construct (C2) selected as lead on its 96% meet-target rate, not merely its highest mean — the distribution made the decision unambiguous.
- C1 and C3 dropped from the soluble-expression route; their 1% and 5% pass rates ruled out the deterministic plan to "optimise refolding conditions" on them.
- Induction temperature prioritised over process-timing controls after the tornado showed temperature carries 12 pp of yield against 1 pp for dispersion tightening.
- QC target robustness checked before lock: the sweep showed C4/C5 collapse if the soluble-fraction spec is raised, so the team set the spec where C2 retains margin.
ModelRisk Functionality Used
- Monte Carlo simulation of 100,000 production batches per construct, with Beta intrinsic folding propensity, logit-normal process perturbation, and Binomial folded/aggregated sampling.
- Shared construct-level propensity as a common factor so batch-to-batch soluble yield retains realistic spread instead of collapsing under the central-limit theorem.
- Probability-of-target reporting giving P(soluble yield ≥ target) per construct, the manufacturing criterion the deterministic folding score could not express.
- Target sweep computing pass probability across the full target range for all five constructs, exposing which candidates are robust and which sit on a cliff.
- Tornado decomposition separating construct design (dominant) from operational levers and from process dispersion, directing optimisation effort to induction temperature.
A protein construct is not "60% folded"; it is a distribution of batch soluble yields, and the only number that matters is how often a batch clears target. The simulation in ModelRisk replaces "predicted to fold" with "meets the 60% soluble target in 96% of batches for C2 versus 1% for C1" — a ranking the lab can act on before a single litre is fermented.