

Industry: Biotech
Product: ModelRisk
Application: Genomic Data Analysis
A point estimate says the interpretation pipeline meets its SLA. It clears it only 40% of weeks — and runs over analyst capacity in two weeks out of three
A clinical genomics lab interprets a weekly cohort of about 120 already-sequenced cases. The downstream pipeline — variant triage, classification, manual curation, reporting — is where uncertainty actually accumulates. The capacity plan multiplies 120 cases by 9 candidate variants by a 10% actionable rate and lands on 108 clinically-actionable findings per week, comfortably staffed against an analyst team that clears 95 interpretations weekly… on paper. Simulate the week 60,000 times and the average yield is 107 — almost identical — but the resemblance is a trap: the workload exceeds analyst capacity in 68% of weeks, the per-case SLA breach rate averages 12.2% against a 9% plan, and the cohort meets its "≤5% of cases late" reporting SLA only 40% of the time.
The point estimate and the simulation agree on the mean and disagree on everything that matters. The reason is a shared, per-cohort batch-difficulty factor: a hard week brings more variants of uncertain significance, slower curation, and higher cost — all at once, across every case in the cohort. That common factor is invisible to a mean-of-means calculation and decisive to operations.
Why a point estimate fails
Deterministic capacity planning treats each weekly average as the week. But variant load, turnaround, and cost do not vary independently around their means — they are yoked together by how hard the batch is to interpret. A difficult cohort inflates the per-case variant count (modelled as a Poisson rate scaled by the difficulty factor), lengthens turnaround (a difficulty-driven mean against the SLA clock), and raises cost (base cost scaled by difficulty, plus overtime once the actionable load exceeds analyst capacity). Because the same factor drives all three, the bad weeks are bad on every axis simultaneously. A single expected-value figure for each metric collapses that correlation and reports a system that looks balanced and reliable when it is neither.
The yield that drives workload is a distribution, not a target
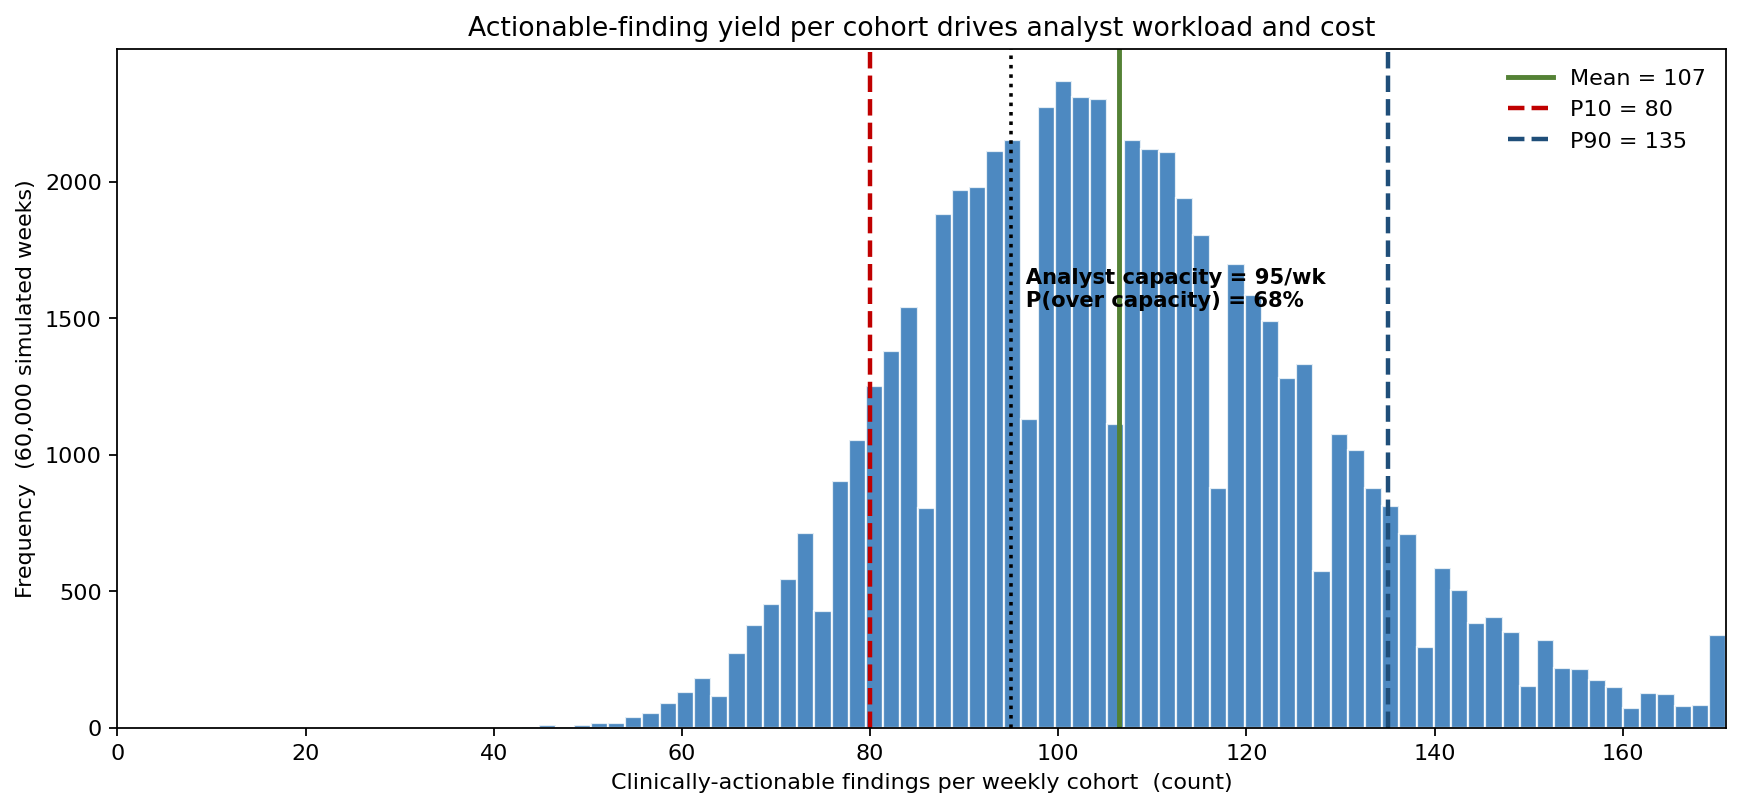
Across 60,000 simulated weeks the actionable-finding yield averages 107 (P10 80, P50 105, P90 135) — and the deterministic point estimate of 108 sits almost exactly on the mean, which is precisely why it lulls. The analyst team's capacity of 95 interpretations per week falls to the left of the mean: the cohort exceeds capacity in 68% of weeks. A plan anchored on the average therefore commits the lab to chronic overflow, overtime, and the queueing that pushes cases past their reporting clock.
The reporting SLA is missed more often than met — and one FTE flips it
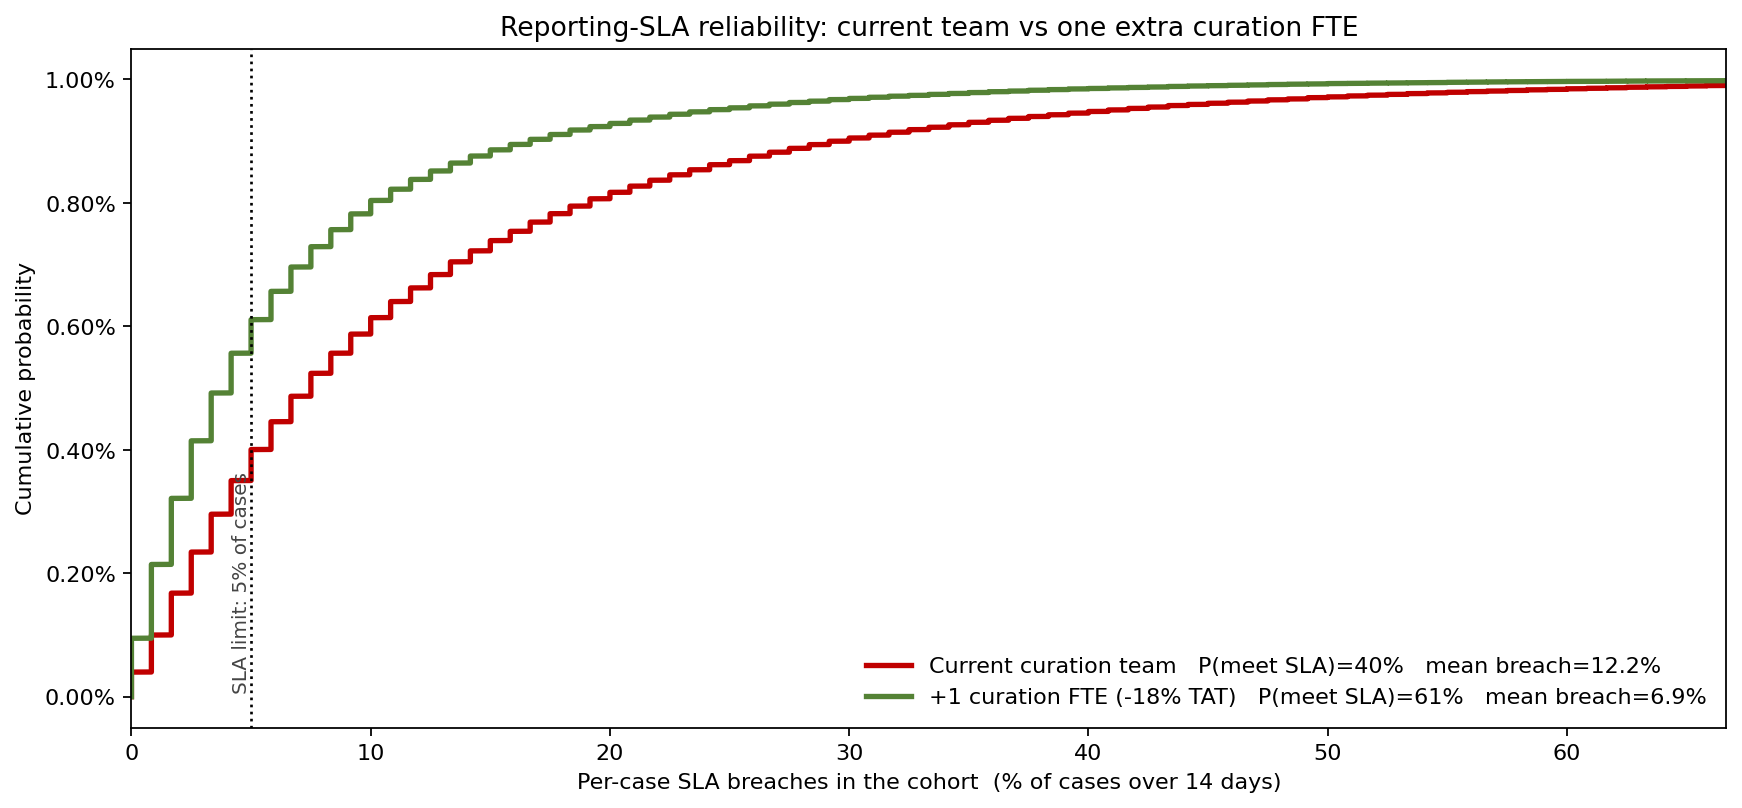
Defining the SLA as "no more than 5% of cases breach the 14-day clock," the current curation team meets it in only 40% of weeks, with a mean per-case breach rate of 12.2% — well above the deterministic 9% that a difficulty-free calculation predicts. Adding one curation FTE, modelled as an 18% reduction in difficulty-driven turnaround, lifts SLA reliability to 61% of weeks and cuts the mean breach rate to 6.9%. The CDF makes the business case quantitative: the extra FTE buys a 21-percentage-point improvement in on-time reporting, and the curve shows exactly how much of the breach-rate distribution moves under the limit.
What drives mean cost per cohort
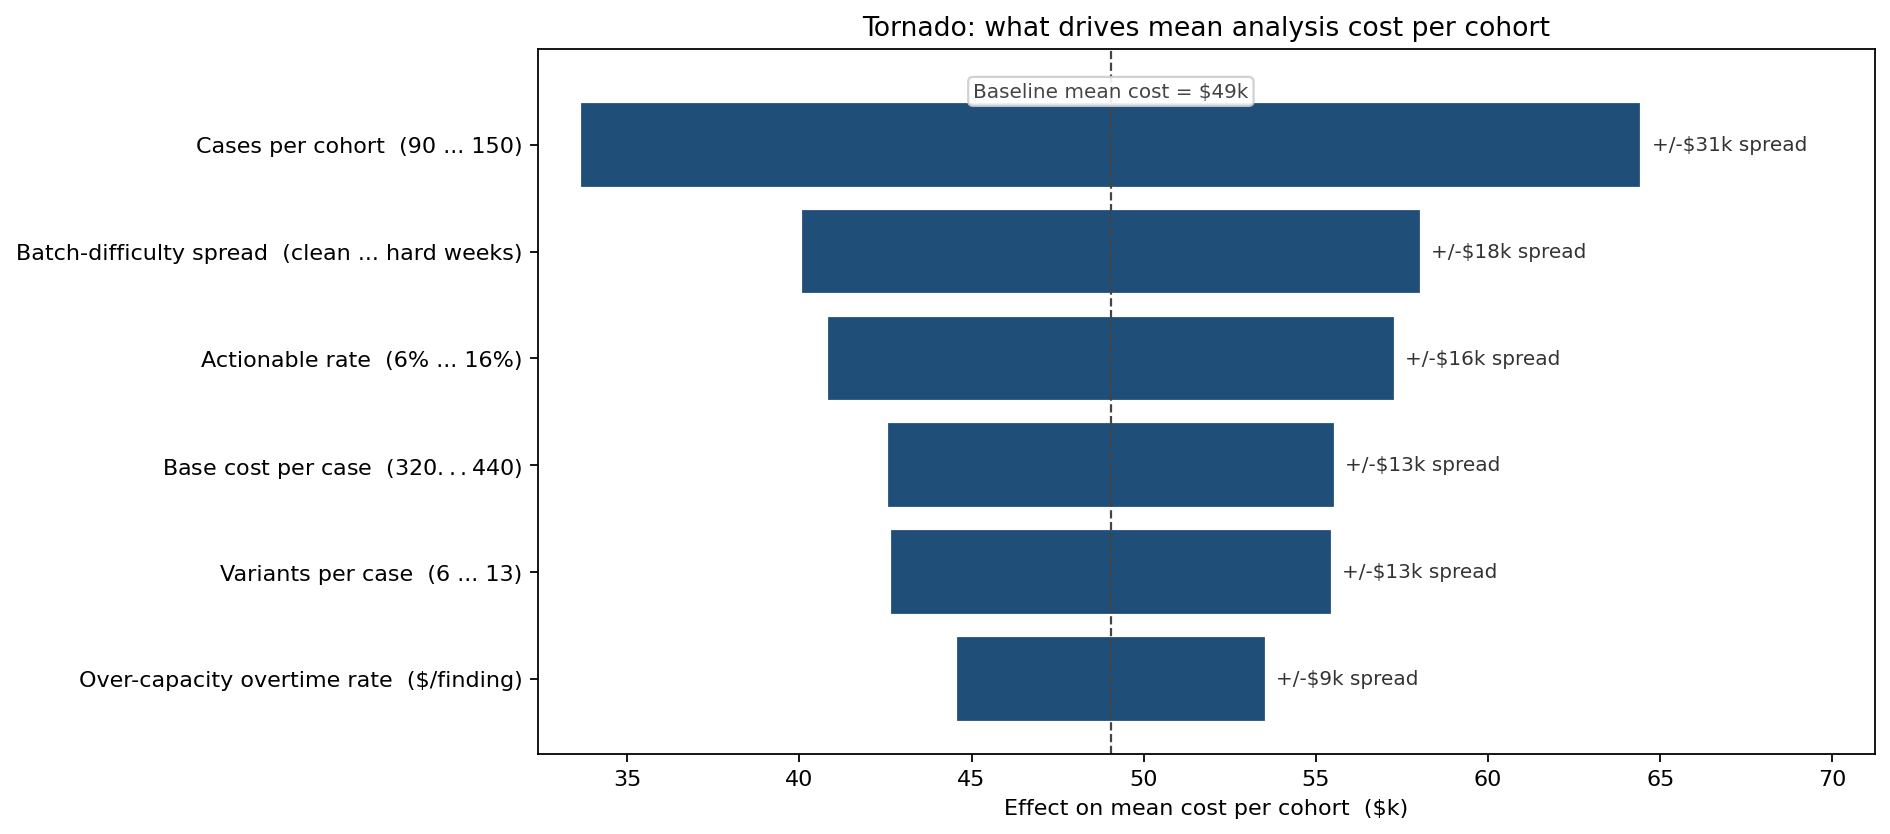
Against a baseline mean cost of $49k per cohort, the swing in cases per cohort dominates — 90 versus 150 cases moves cost from $35k to $65k — followed by the actionable rate (6% vs 16% → $46k vs $62k) and the variant load per case (6 vs 13 → $46k vs $59k). The batch-difficulty spread and the over-capacity overtime rate add further upside on the bad weeks. The ranking tells the lab that intake volume and case mix, not unit price, are the real cost drivers — and that overtime triggered by capacity overflow is a controllable tail rather than a fixed cost.
Hard weeks bite twice
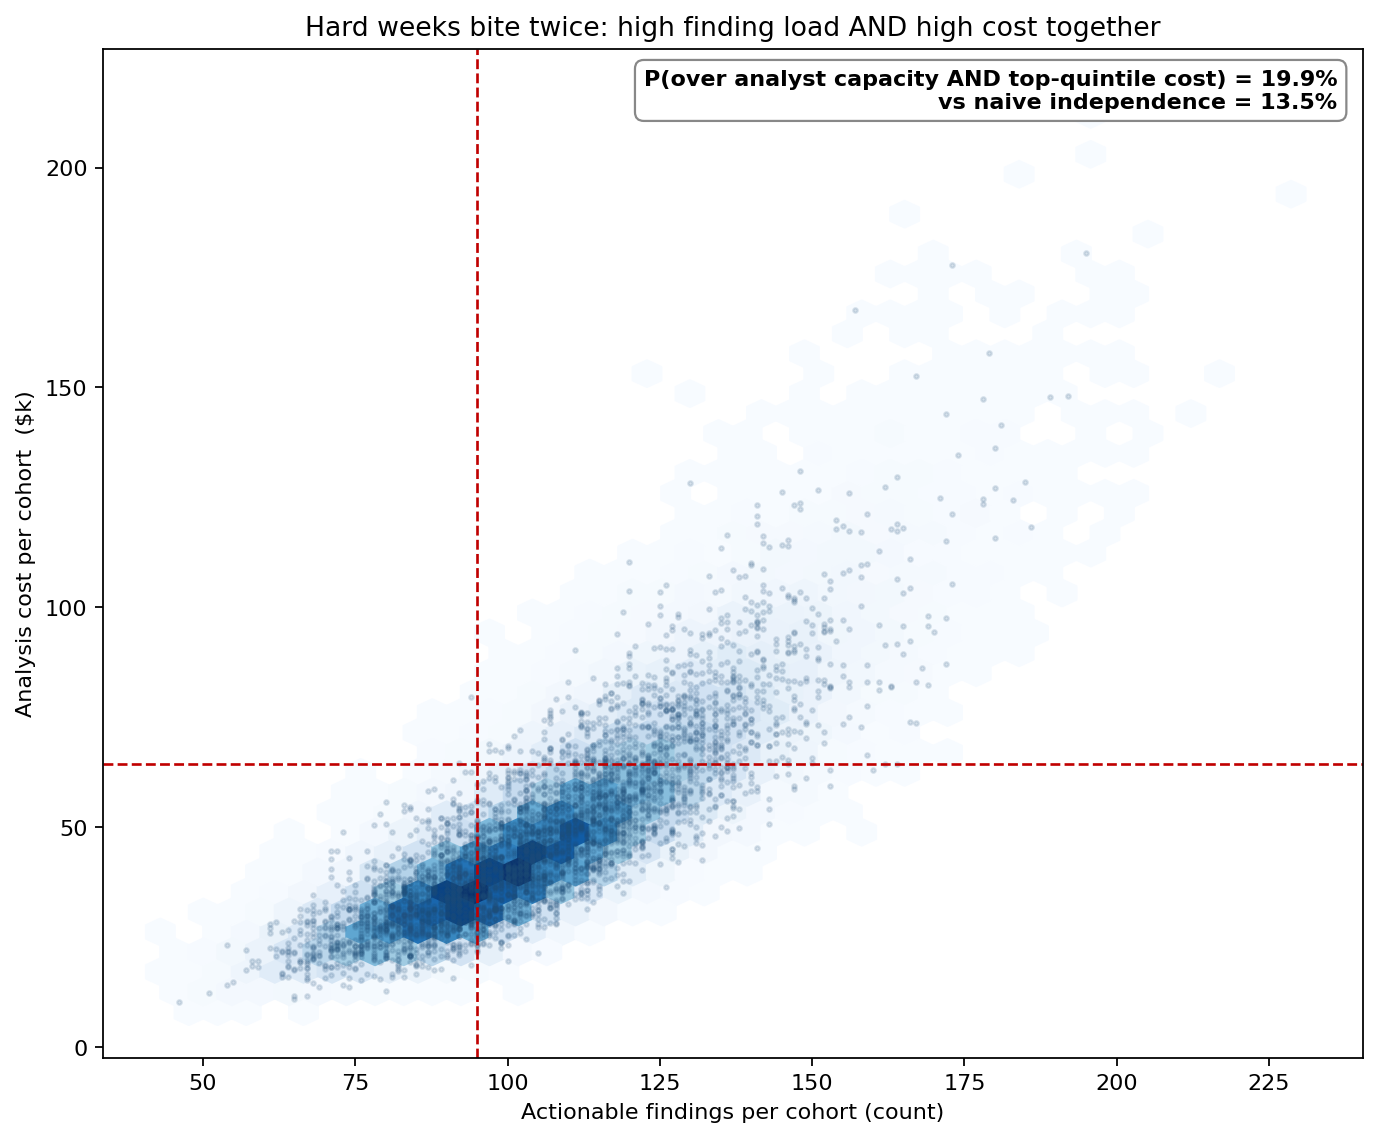
Plotting each week's actionable yield against its cost exposes the shared difficulty factor directly. The probability of a week that is both over analyst capacity and in the top quintile of cost is 19.9% — markedly higher than the 13.5% a naive independence assumption would predict. The high-cost weeks are disproportionately the high-load weeks (the cost P80 threshold is $64k), because one factor drives both. Budgeting and staffing to independent averages understates how often the lab gets hit on workload and cost in the same week.
What the model changed
The lab stopped planning to weekly averages and started planning to the distribution. Three operational decisions followed: staff to roughly the P75–P90 of the actionable-yield distribution rather than the mean, since 68% of weeks exceed the capacity an average-based plan would set; justify the additional curation FTE on the simulated jump in SLA reliability from 40% to 61% of weeks; and treat over-capacity overtime as a managed tail tied to intake volume, the dominant cost lever in the tornado. Replacing four comfortable point estimates with their joint distribution turned a plan that looked balanced into one that actually holds under the weeks that matter.
ModelRisk functionality used
- Monte Carlo simulation to propagate batch-difficulty uncertainty through yield, turnaround, and cost simultaneously.
- Poisson distribution for candidate-variant load and Binomial distributions for actionable findings and per-case SLA breaches.
- LogNormal distributions for the shared batch-difficulty factor and for per-cohort cost noise.
- Probabilistic targets — P(meet the reporting SLA) and P(exceed analyst capacity) — reported as full distributions.
- Scenario comparison (CDF) to quantify the SLA-reliability gain from an additional curation FTE.
- Sensitivity analysis (tornado) and joint-density analysis to rank cost drivers and expose the correlation between high-load and high-cost weeks.