

Industry: Biotech
Product: ModelRisk
Application: Gene Therapy Optimization
The Dose That Maximises Efficacy Lands in the Therapeutic Window Only 62% of the Time
A gene-therapy team had picked its clinical dose the way most teams do: take the AAV vector dose that drives transgene expression as high as it will reasonably go. At 5e13 vg/kg the expected expression was 77% of target and the probability of meeting the 50% efficacy floor was 97% — an easy choice on an efficacy spreadsheet. The Monte Carlo model agreed on efficacy and then asked the question the spreadsheet had skipped: how often does that dose land a patient in the therapeutic window — efficacy target met and dose-limiting toxicity at or below one event? The answer was 62%. A lower dose, 2e13 vg/kg, did better: 70%.
Pushing the dose to maximise efficacy moved patients out of the window, not into it. That is the structural feature a single-number dose decision cannot see, because the curve that matters is not monotonic — it is an inverted U.
Why a point estimate fails here
A deterministic dose-finding model plots expected expression against dose, picks the dose where expected expression comfortably clears the efficacy floor, and stops. Two things break that logic. First, raising the dose raises toxicity at least as fast as it raises efficacy, so the binding constraint flips from "too little expression" at low doses to "too much toxicity" at high doses — there is an interior optimum the efficacy-only view never looks for. Second, expression and toxicity are adversely coupled across patients: a patient with high pre-existing anti-AAV titre or poorer liver health transduces worse and tolerates the vector worse, so the same patient tends to fail on both axes at once.
The model captures both. At each dose, every patient shares an immune/hepatic susceptibility factor that pushes transduction down and toxicity up together. Transgene expression follows an Emax dose-response (a Beta around a logistic mean in log-dose and susceptibility); dose-limiting toxicity is a Poisson count whose rate climbs steeply with dose and susceptibility. A patient is in the therapeutic window only if expression meets the 50% target and toxicity stays at or below one event.
The therapeutic window peaks at an interior dose
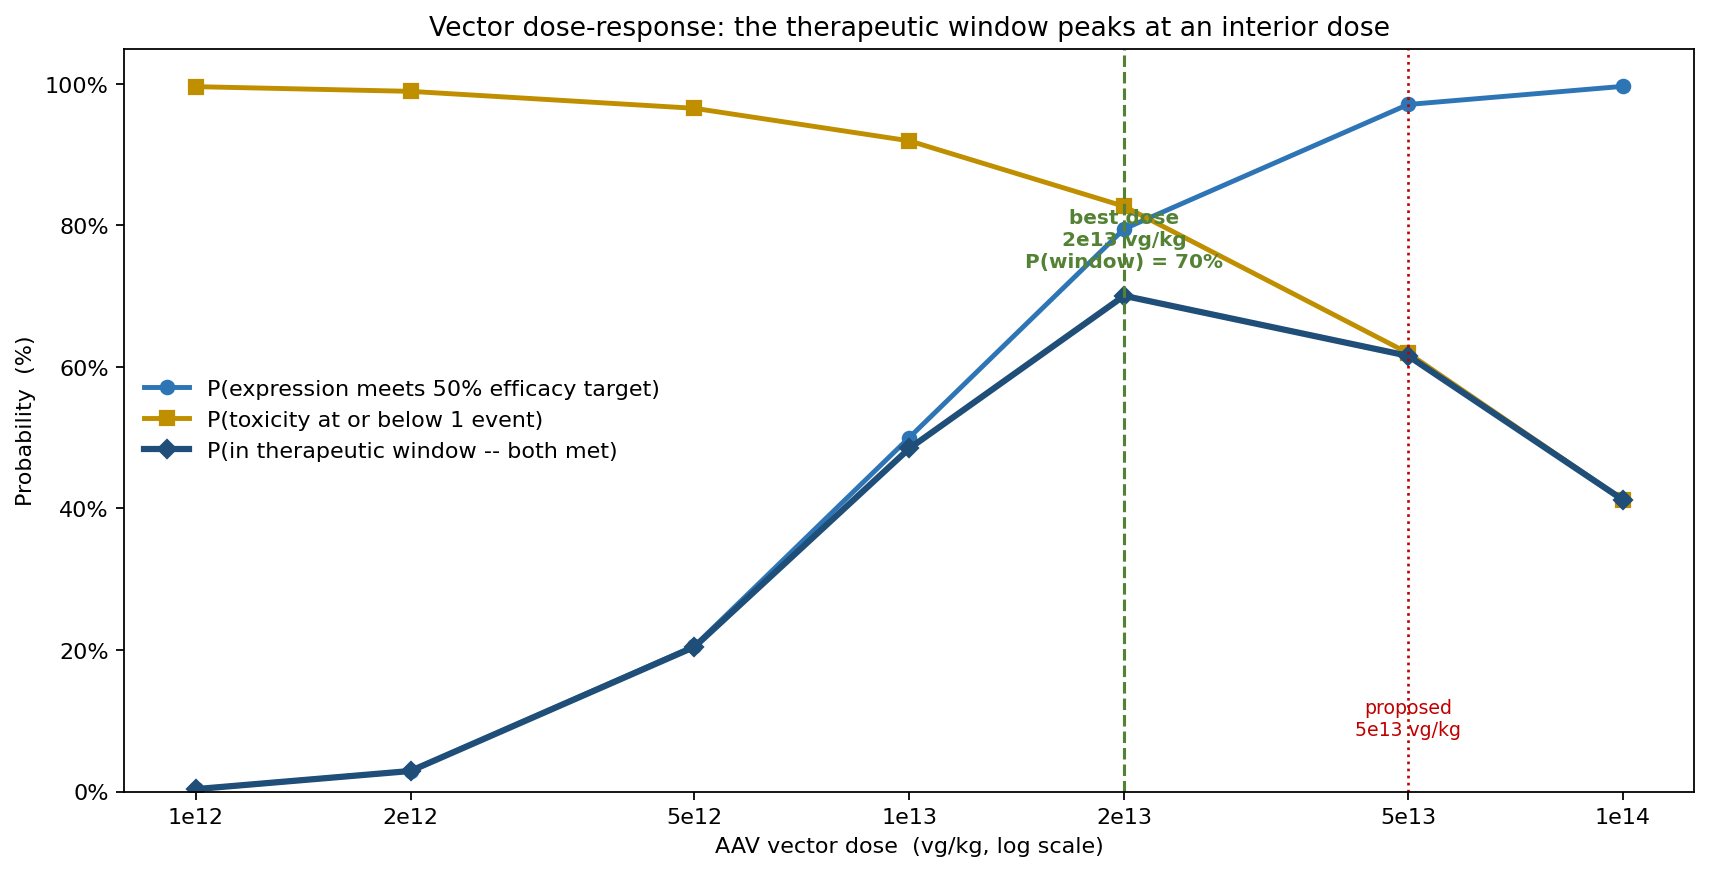
Sweeping the dose grid traces three curves. The efficacy pass-rate rises monotonically with dose; the safety pass-rate falls monotonically; and their product — the therapeutic-window probability — rises, peaks, and then falls:
- 1e12 vg/kg — P(eff) 0%, P(safe) 100%, P(window) 0%
- 2e12 vg/kg — P(eff) 3%, P(safe) 99%, P(window) 3%
- 5e12 vg/kg — P(eff) 21%, P(safe) 97%, P(window) 20%
- 1e13 vg/kg — P(eff) 50%, P(safe) 92%, P(window) 48%
- 2e13 vg/kg — P(eff) 80%, P(safe) 83%, P(window) 70%
- 5e13 vg/kg — P(eff) 97%, P(safe) 62%, P(window) 62%
- 1e14 vg/kg — P(eff) 100%, P(safe) 41%, P(window) 41%
The window peaks at 2e13 vg/kg with a 70% probability. The team's proposed 5e13 dose buys near-certain efficacy (97%) but spends it on toxicity, dropping the window to 62% — 8 percentage points below the optimum despite a four-fold lower window failure at the lower dose's expense. At 1e14 the window has collapsed to 41%: every patient is efficacious and most are over-dosed.
Expression and toxicity are adversely coupled across patients
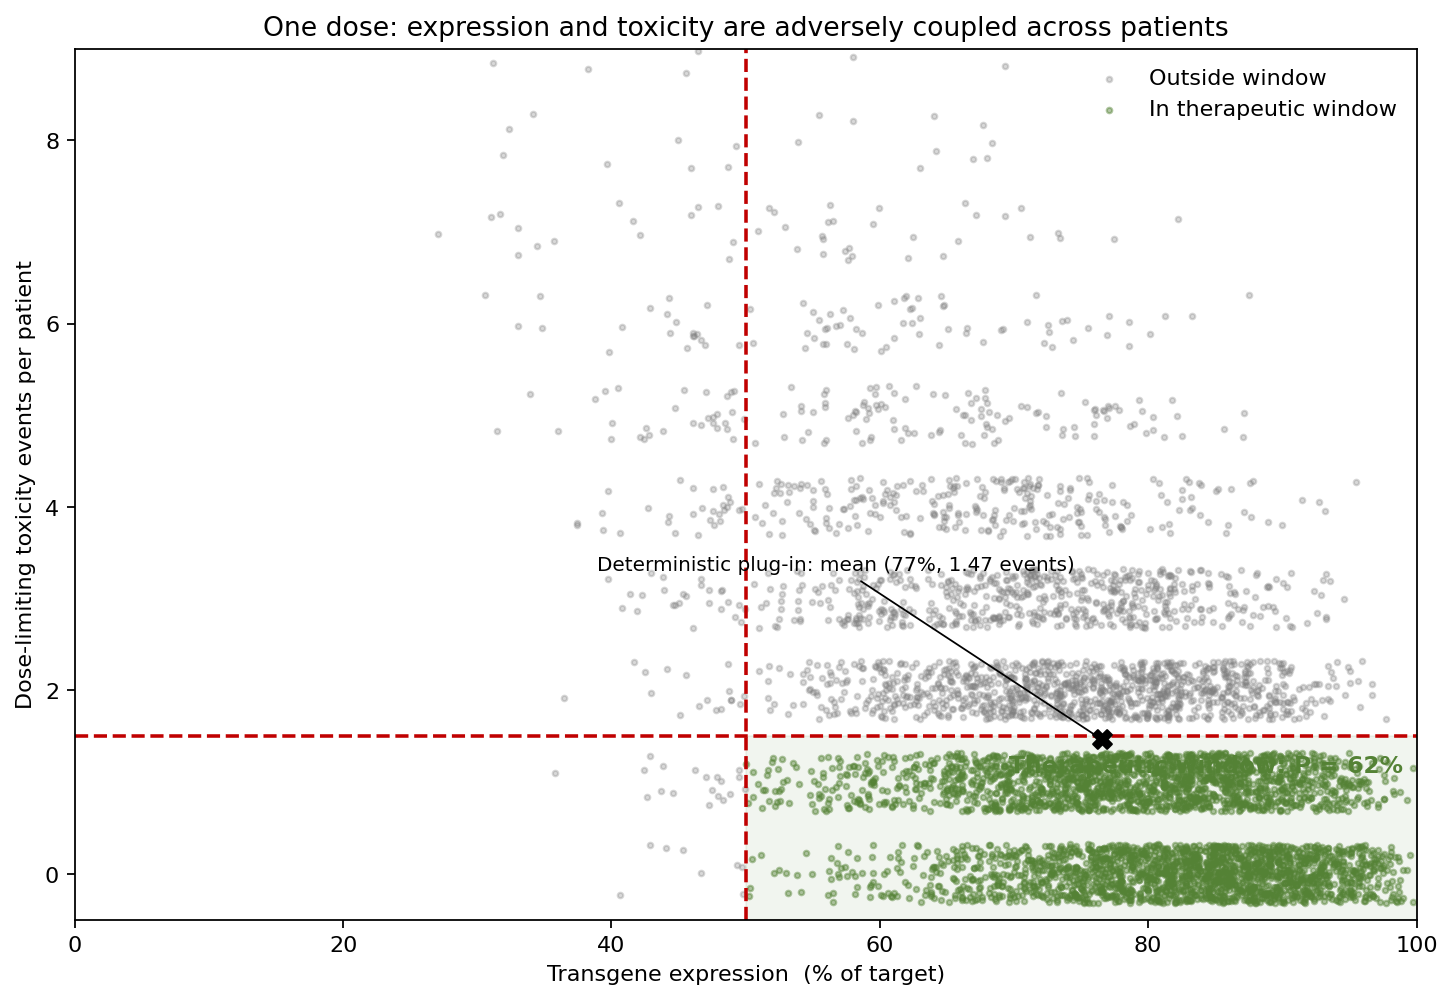
At 5e13 vg/kg the deterministic plug-in sits at its mean of (77% expression, 1.47 toxicity events). Note that the mean toxicity already exceeds the limit of one — the point estimate is on the wrong side of the safety line, a warning the efficacy-only view never surfaced. The patient cloud shows the adverse coupling: low-expression patients cluster with high toxicity in the same upper-left region, because the same susceptibility drives both. The green therapeutic-window region holds only 62% of patients.
At the over-dose, mean toxicity "rounds to about one" but the tail breaches the limit
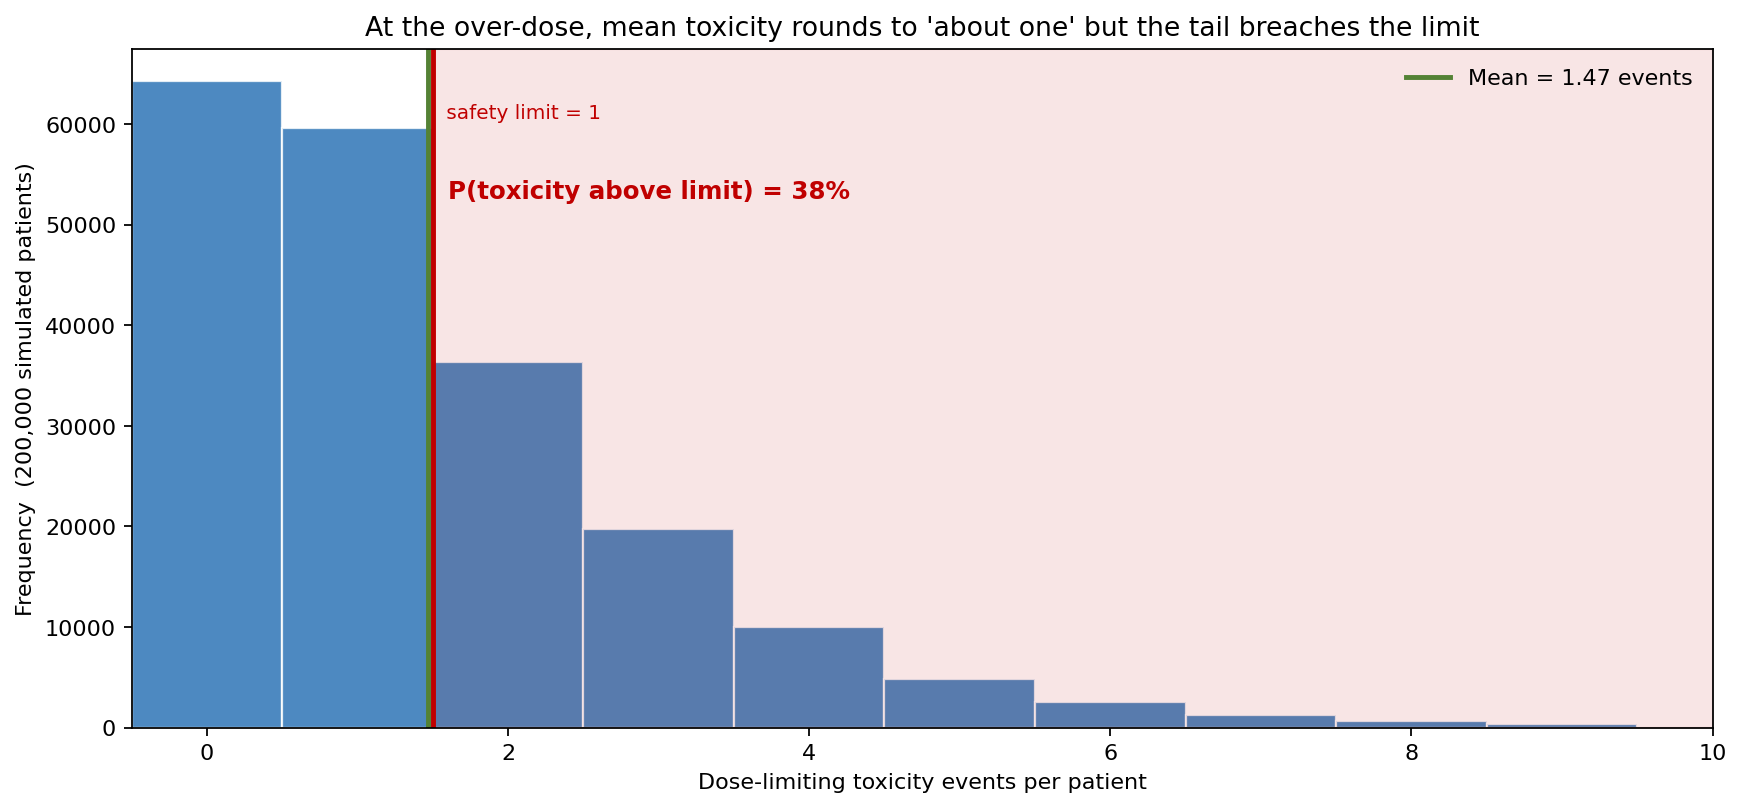
The toxicity count at 5e13 vg/kg has a mean of 1.47 events — close enough to the limit of one that a team reading only the average might wave it through. But the count is an integer Poisson with a long right tail: the probability of exceeding the safety limit is 38%, and the probability of staying at or below it is 62%. More than one patient in three over-doses at the proposed level — the safety signal that flips the dose decision.
What the model changed
- The clinical dose dropped from 5e13 to 2e13 vg/kg. The team had selected the higher dose to maximise expected efficacy; the window analysis showed the lower dose was 8 points more likely to land patients in the therapeutic window, and the proposed dose's mean toxicity already breached the safety limit.
- Patient screening was reframed as second-order. The tornado around the chosen 2e13 dose showed tightening the enrolled cohort (anti-AAV titre and liver-function screening) moved the window probability only a few points, whereas a half-log change in dose moved it by tens of points — so dose selection, not screening, became the primary lever.
- The decision criterion changed from "expected efficacy" to "P(therapeutic window)." Dose-finding discussions were re-anchored on the joint window probability rather than the expression curve alone.
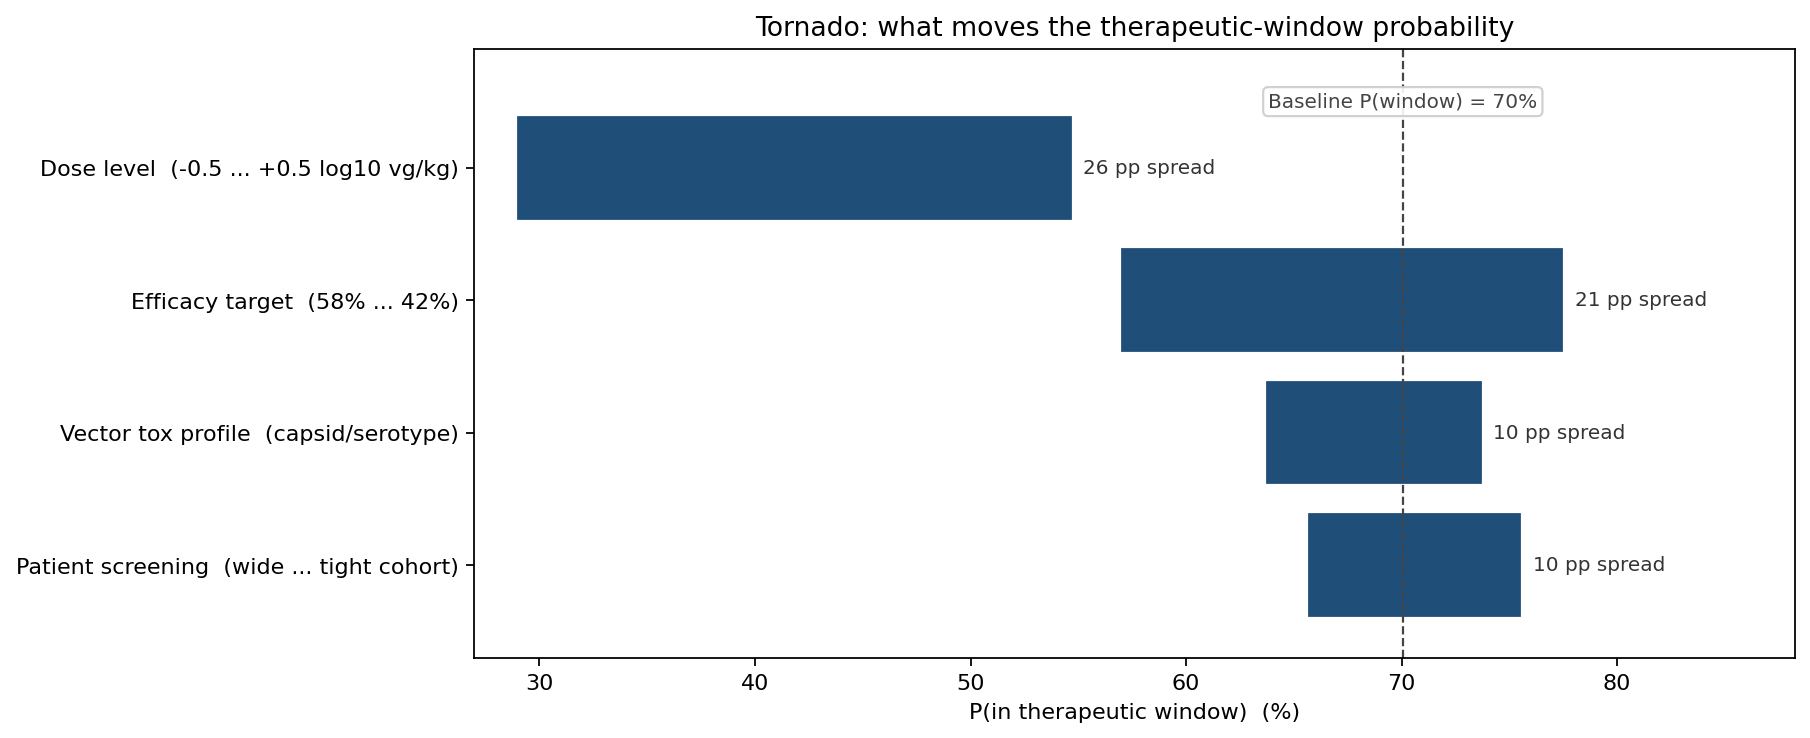
Around the chosen 2e13 dose, the tornado shows dose level dominating: a -0.5 to +0.5 log10 vg/kg move swings the window probability from -41 to -15 points (both directions hurt — the signature of sitting near the peak). Efficacy-target stringency swings it -13 to +7, patient screening -4 to +6, and the vector toxicity profile -6 to +4. Dose is the decision; everything else is fine-tuning.
ModelRisk Functionality Used
- Emax dose-response for expression and a dose-driven Poisson toxicity rate, linked through a shared per-patient susceptibility factor so efficacy and toxicity are adversely correlated.
- Dose sweep computing P(efficacy met), P(toxicity below limit), and the joint therapeutic-window probability across the vg/kg grid, locating the interior optimum.
- Joint window logic evaluating both criteria in the same patient rather than treating efficacy and safety as independent checks.
- Tornado sensitivity ranking dose level, efficacy stringency, patient screening, and vector toxicity profile on the window probability around the chosen dose.
The dose that maximises expected efficacy is not the dose that maximises the chance of helping a patient safely. Simulating the joint distribution moved the recommended dose down a notch — from a 62% window at the efficacy-maximising dose to a 70% window at the interior optimum — and exposed a proposed dose whose average toxicity was already over the line.