

Industry: Biotech
Product: ModelRisk
Application: Optimizing Drug Delivery Systems Under Uncertainty
38% In the Window vs 83%: Why a Single Bioavailability Number Cannot Size a Formulation
A formulation report that quotes "mean bioavailability 42%" has answered the wrong question. The dose that a patient actually sees is a steady-state plasma exposure, and what matters clinically is not its average but the fraction of the treated population that lands inside the therapeutic window — above the minimum effective concentration, below the toxicity threshold. Run the conventional formulation of this controlled-release compound through 100,000 simulated patients and only 38% land in the 0.8–2.5 mg/L window; the other 60% are sub-therapeutic and 1% stray into toxic exposure. The mean exposure of 0.81 mg/L is a number that hides exactly the two tails the regulator cares about.
A biotech team designing a nanoparticle controlled-release platform rebuilt its formulation comparison in ModelRisk around the population exposure distribution rather than a point estimate of bioavailability. The headline result is what the deterministic mean conceals — the conventional formulation sits mostly below the window, while the nanoparticle formulation centres the population inside it:
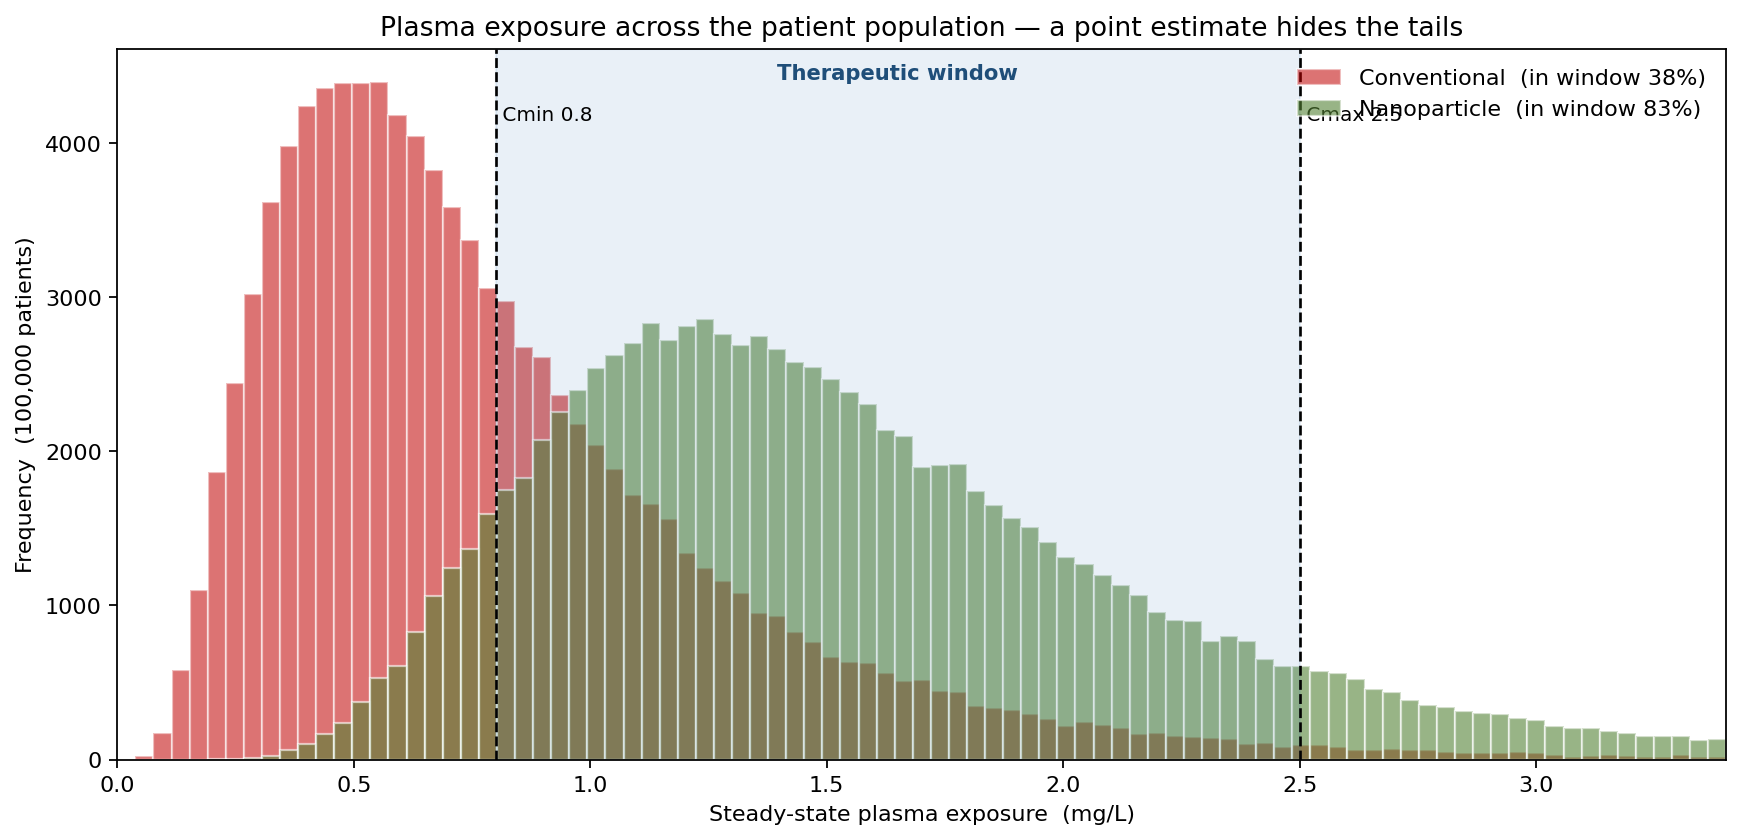
The conventional formulation has a mean exposure of 0.81 mg/L and the nanoparticle 1.56 mg/L, but the means are not the point. The nanoparticle moves the in-window share from 38% to 83% — and in doing so it raises the median exposure enough that 9% of patients now cross Cmax into the toxic tail, against 1% for the conventional formulation. That trade-off is invisible in any mean-bioavailability comparison and is the whole reason to model the distribution.
Why a point estimate fails
Bioavailability is the product of several bounded fractions — encapsulation efficiency, fractional release over the dosing window, and gut/first-pass absorption — divided by a clearance that varies several-fold across a population. Multiplying point estimates gives one exposure value; it cannot tell you what share of patients fall outside the window, and the share outside the window is the clinical and regulatory criterion. Two formulations can share an identical mean exposure while one keeps 85% of patients in range and the other only 50%, because the spread differs. A deterministic model is structurally blind to the quantity the decision turns on.
A population model with a shared formulation factor
Each simulated patient receives a bioavailable fraction \[ F = \mathrm{EE}\times f_r \times g \] where encapsulation efficiency \(\mathrm{EE}\) and fractional release \(f_r\) are Beta-distributed properties of the formulation recipe, drawn once per lot and shared across the population, and gut absorption \(g\) is a per-patient Beta draw. Clearance \(CL\) is a per-patient LogNormal (right-skewed, never negative). Steady-state exposure is \(C_{ss} = (\text{Dose}\times F)/(CL\times\tau)\), strictly positive by construction, with all fractions confined to \([0,1]\).
The shared lot-level release and encapsulation terms are deliberate: they are common factors across the population, so the population spread does not collapse to zero the way it would if every patient drew every parameter independently. The nanoparticle differs from the conventional formulation in two ways the model captures explicitly — a higher and tighter encapsulation/release profile, and a tighter clearance influence — which is why it both shifts and narrows the exposure distribution.
Dose is the lever — and the nanoparticle's optimum is near its label dose
Because exposure scales linearly with dose, the obvious question is whether the conventional formulation can simply be up-dosed into the window. Sweeping the dose answers it:
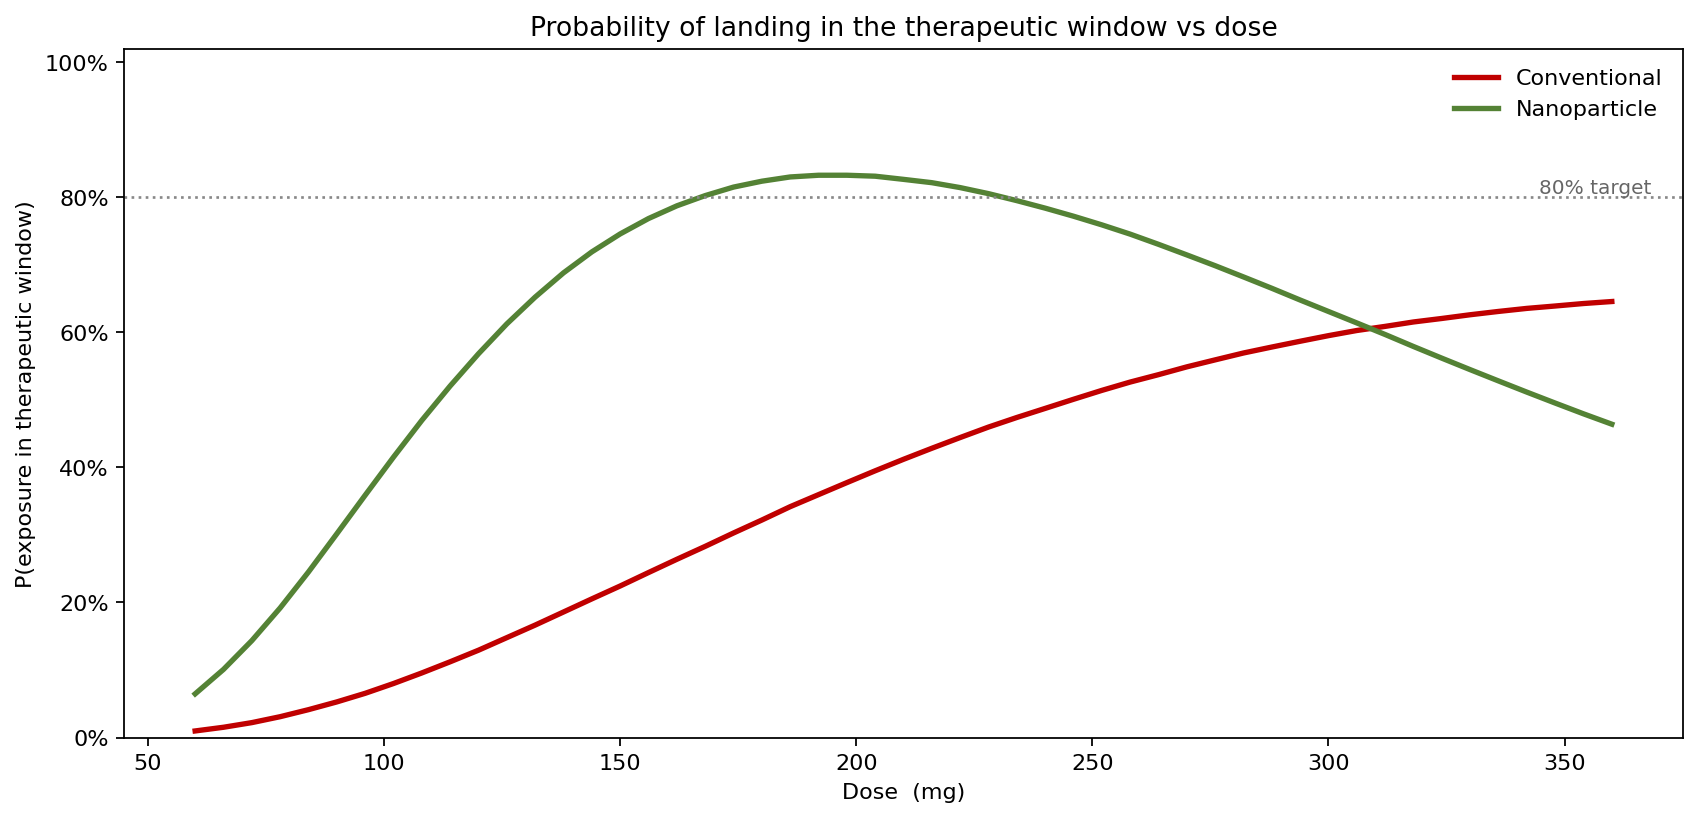
At the 200 mg label dose the nanoparticle already sits at 83% in-window, essentially at its own optimum of 83% near 198 mg — the formulation is dosed where it should be. The conventional formulation peaks at only 65% even at 360 mg: no dose puts it reliably in the window, because its wide clearance-driven spread always leaves either a sub-therapeutic or a toxic tail outside the limits. You cannot up-dose your way out of a formulation whose variability is too wide; the curve never reaches the 80% line.
What drives the variability
Tornado-ranking the drivers of exposure for the nanoparticle arm shows where the residual spread comes from:
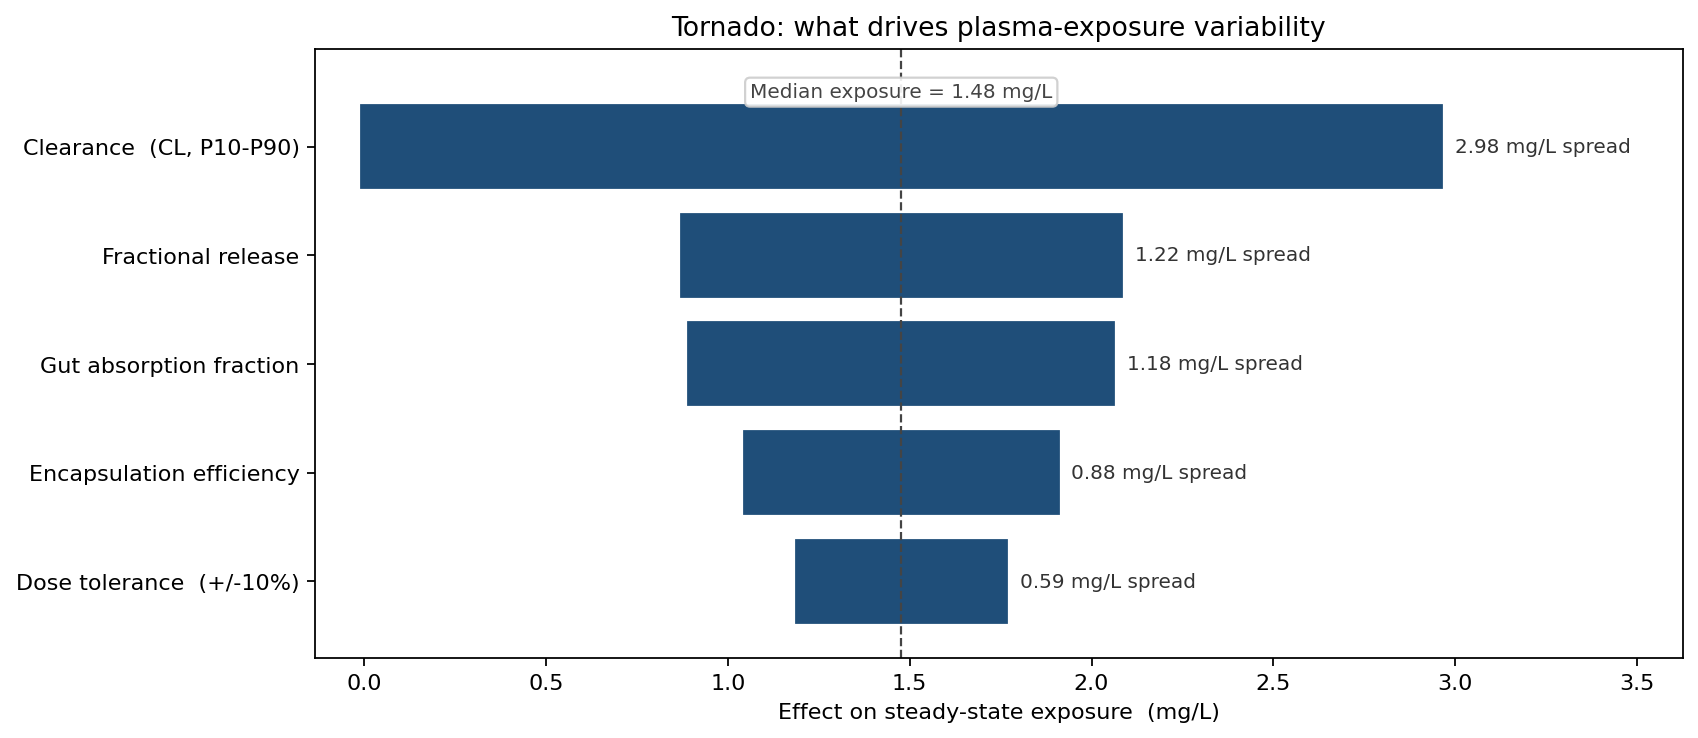
Patient clearance dominates — its P10–P90 range swings exposure by about 1.49 mg/L, more than the formulation-controllable factors combined. Fractional release (0.61 mg/L) and gut absorption (0.59 mg/L) are second-tier, encapsulation efficiency (0.44 mg/L) third, and a ±10% dose tolerance contributes only 0.30 mg/L. The implication is sharp: once the formulation is good, the largest remaining source of patients falling outside the window is inter-patient clearance — which argues for clearance-based dose stratification (e.g. renal-function dosing) rather than further formulation tightening.
Where the population lands
The formulation comparison summarises the decision in one view:
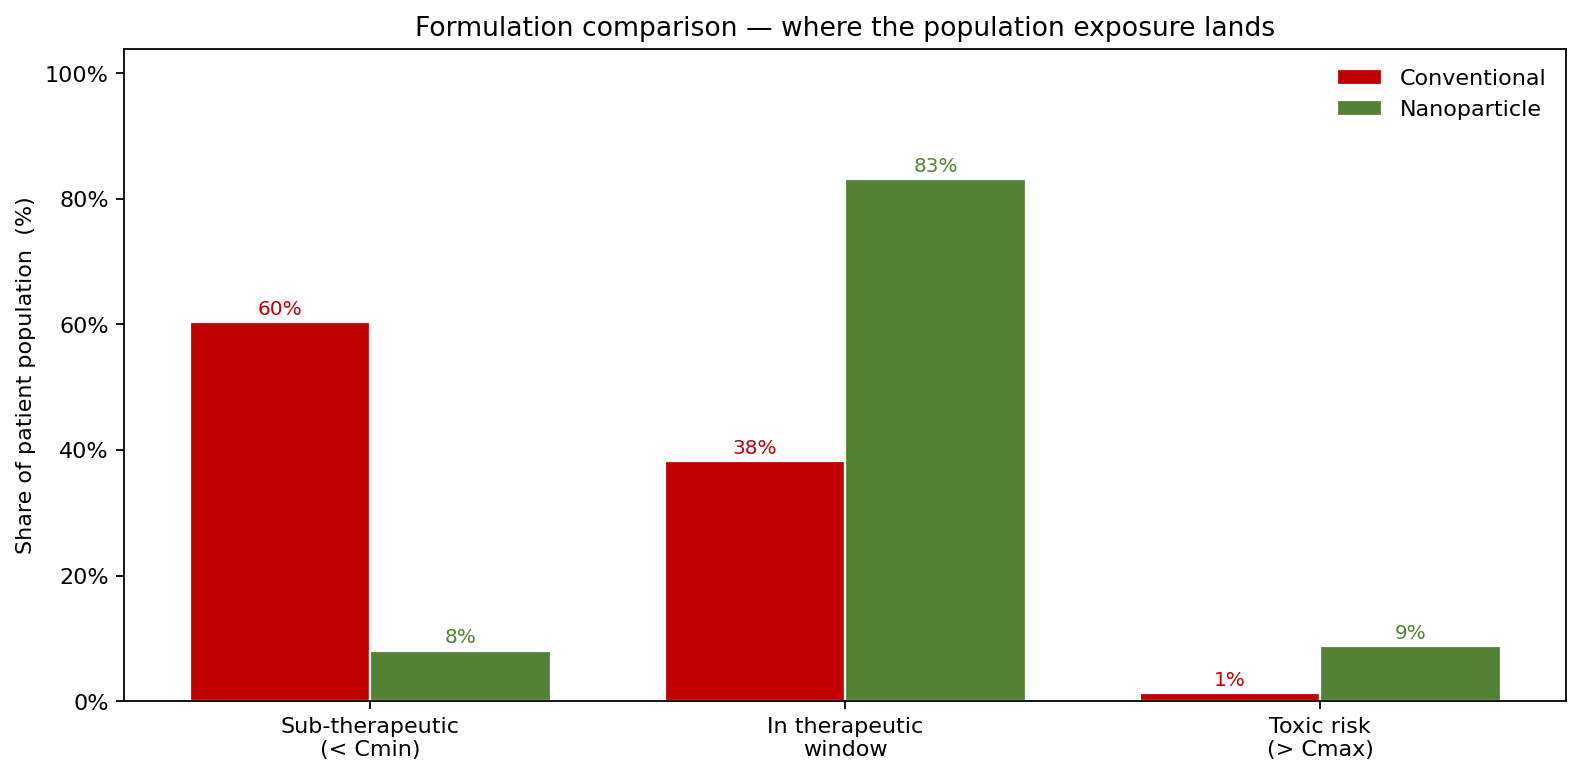
The conventional formulation leaves 60% sub-therapeutic, 38% in window, 1% toxic; the nanoparticle delivers 8% sub-therapeutic, 83% in window, 9% toxic — a 45-percentage-point gain in the share of patients correctly dosed. The 9% toxic tail is the price of moving the population up into the window and is exactly the kind of trade a mean comparison would never expose: it is the argument for either a modest dose reduction on the nanoparticle or, better, the clearance-based stratification the tornado points to.
What the model changed
- Formulation selection rebuilt on in-window share rather than mean bioavailability — the nanoparticle was selected on its 83% vs 38% in-window result, with the 9% toxic tail flagged as a managed risk rather than ignored.
- Dose held at 200 mg for the nanoparticle once the sweep confirmed it sits at its own optimum, ending a proposal to up-dose for "more exposure" that would have pushed the toxic tail higher.
- Conventional up-dosing rejected: the sweep showed no dose reaches the 80% in-window target, redirecting effort from dose-finding to formulation.
- Clearance-based dose stratification added to the development plan after the tornado identified inter-patient clearance — not formulation variability — as the dominant remaining driver of out-of-window exposure.
ModelRisk Functionality Used
- Monte Carlo simulation of 100,000 virtual patients per formulation, propagating Beta encapsulation/release, Beta gut absorption, and LogNormal clearance through the steady-state exposure formula.
- Shared formulation-level common factors (encapsulation efficiency and release drawn once per lot) so the population exposure distribution retains genuine spread instead of collapsing under the central-limit theorem.
- Probability-of-target calculation reporting P(in window), P(sub-therapeutic), and P(toxic) directly, replacing the point bioavailability estimate the team had previously decided on.
- Dose sweep computing P(in window) across the dose range for both formulations, proving the conventional formulation cannot be rescued by up-dosing.
- Tornado decomposition isolating inter-patient clearance as the dominant driver and redirecting the optimisation effort toward dose stratification.
A formulation is not "42% bioavailable"; it is a distribution of exposures across a population, most of which a single number throws away. The simulation in ModelRisk replaces "mean exposure 0.81 mg/L" with "38% of patients in the therapeutic window, fixable to 83% by formulation but not by dose" — a statement a clinical and regulatory team can actually act on.