

Industry: Biotech
Product: ModelRisk
Application: Cell culture optimization — choosing the media + feed condition that most reliably clears the harvest-titer target
The Highest-Titer Media Condition Was the Wrong One to Scale
A process-development group screening CHO fed-batch conditions for a new monoclonal antibody had a simple-looking decision: pick the media-and-feed condition that gives the highest harvest titer, lock it in, and scale up. Four candidate conditions had been run at bench scale. On the headline metric — mean harvest titer — the answer was obvious: the high-feed fed-batch condition delivered 4.84 g/L, comfortably ahead of the low-lactate feed condition at 4.12 g/L. The recommendation memo had already been drafted around it.
The trouble is that a process is not scaled on its mean. It is scaled on whether it clears a fixed titer target — here 4.0 g/L — reliably, batch after batch, because anything below the target breaks the downstream economics of the run. Titer is the product of a chain of variable, partly correlated factors: peak viable-cell density, integral-viable-cell-time, and cell-specific productivity, all of them right-skewed, plus a lactate-accumulation crash that can truncate a run. When the group rebuilt the four conditions in ModelRisk and ran 60,000 simulated runs each, the mean-based ranking inverted.
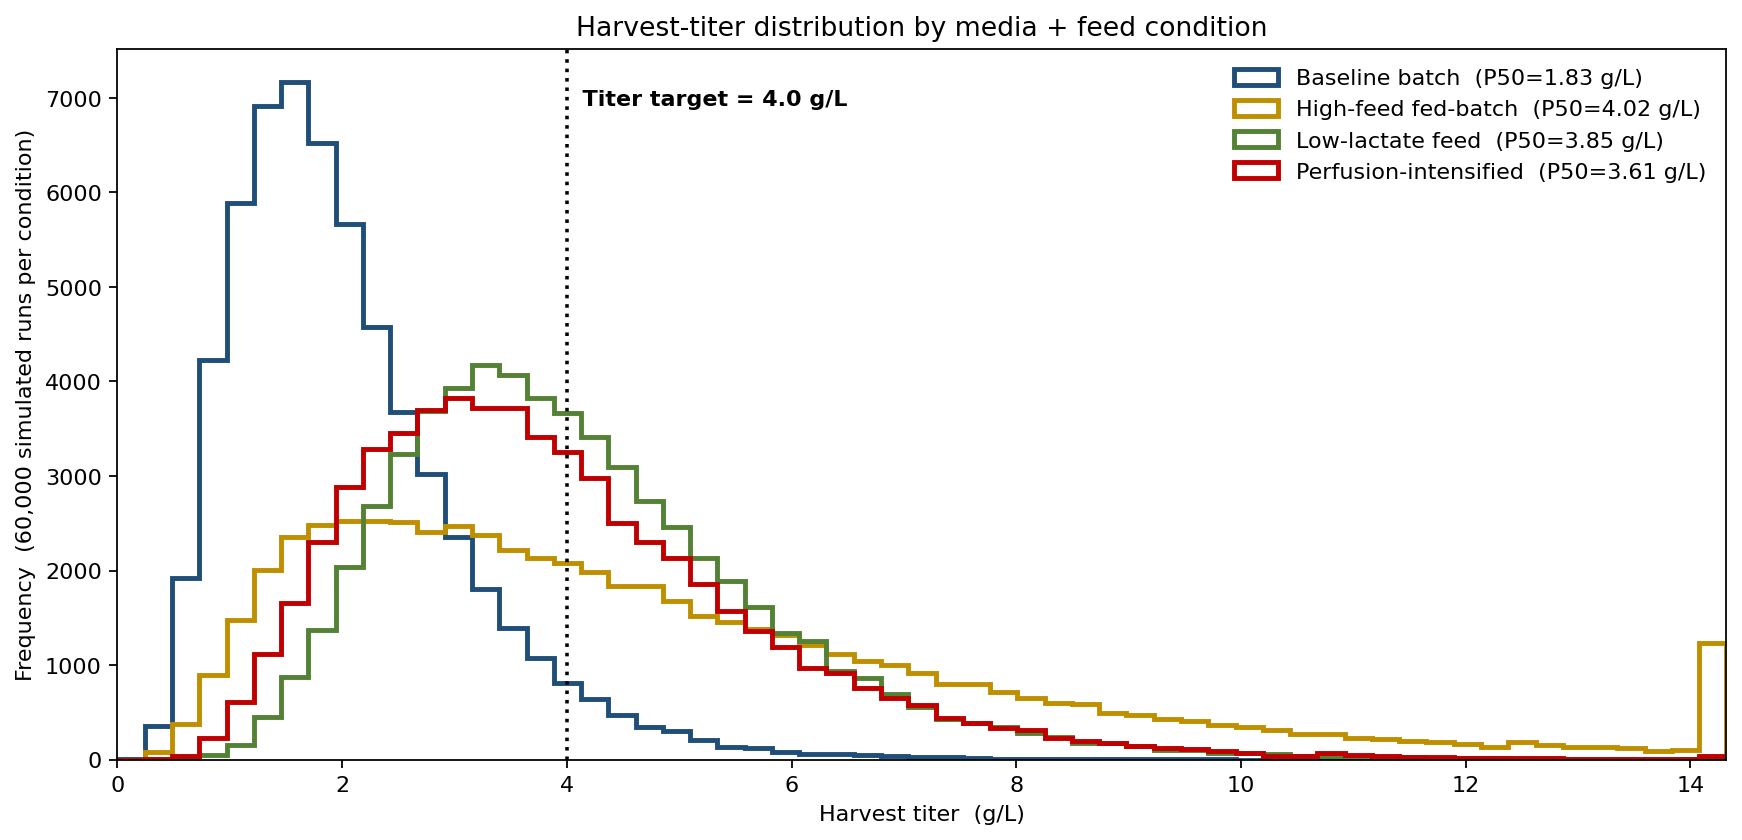
The high-feed condition has the highest median (4.02 g/L) and the longest right tail (P90 = 9.05 g/L) — the source of its winning mean. But it also has the fattest left tail: a 34% per-run lactate-crash risk truncates a third of its runs, dragging its P10 down to 1.58 g/L. The low-lactate condition is more modest in the middle (median 3.85 g/L) but tightly distributed, with a P10 of 2.28 g/L — meaningfully higher than the high-feed condition's downside. The condition that wins on average is the one most likely to crash below the target on any given run.
Why a mean titer cannot pick a process
Ranking conditions by mean titer answers "which condition produces the most antibody over many runs?" — but that is not the manufacturing question. The manufacturing question is "which condition clears 4.0 g/L on this run with the highest probability?", and the two answers differ whenever the distributions have different shapes:
- Titer is right-skewed. A few high-titer runs inflate the mean of the high-feed condition without making any individual run more likely to clear the target. The mean is a poor proxy for "a typical run succeeds."
- The downside, not the upside, sets the risk. A run that lands at 9 g/L is no more useful than one at 4.5 g/L — both clear the target. A run that lands at 1.6 g/L fails it. What matters is the left tail, and the mean is blind to it.
- The factors are correlated within a run. A strong inoculum lifts peak cell density and productivity together, so the titer components do not average out independently — modelling them as independent would understate the spread that the downside risk lives in.
What each condition actually clears, run after run
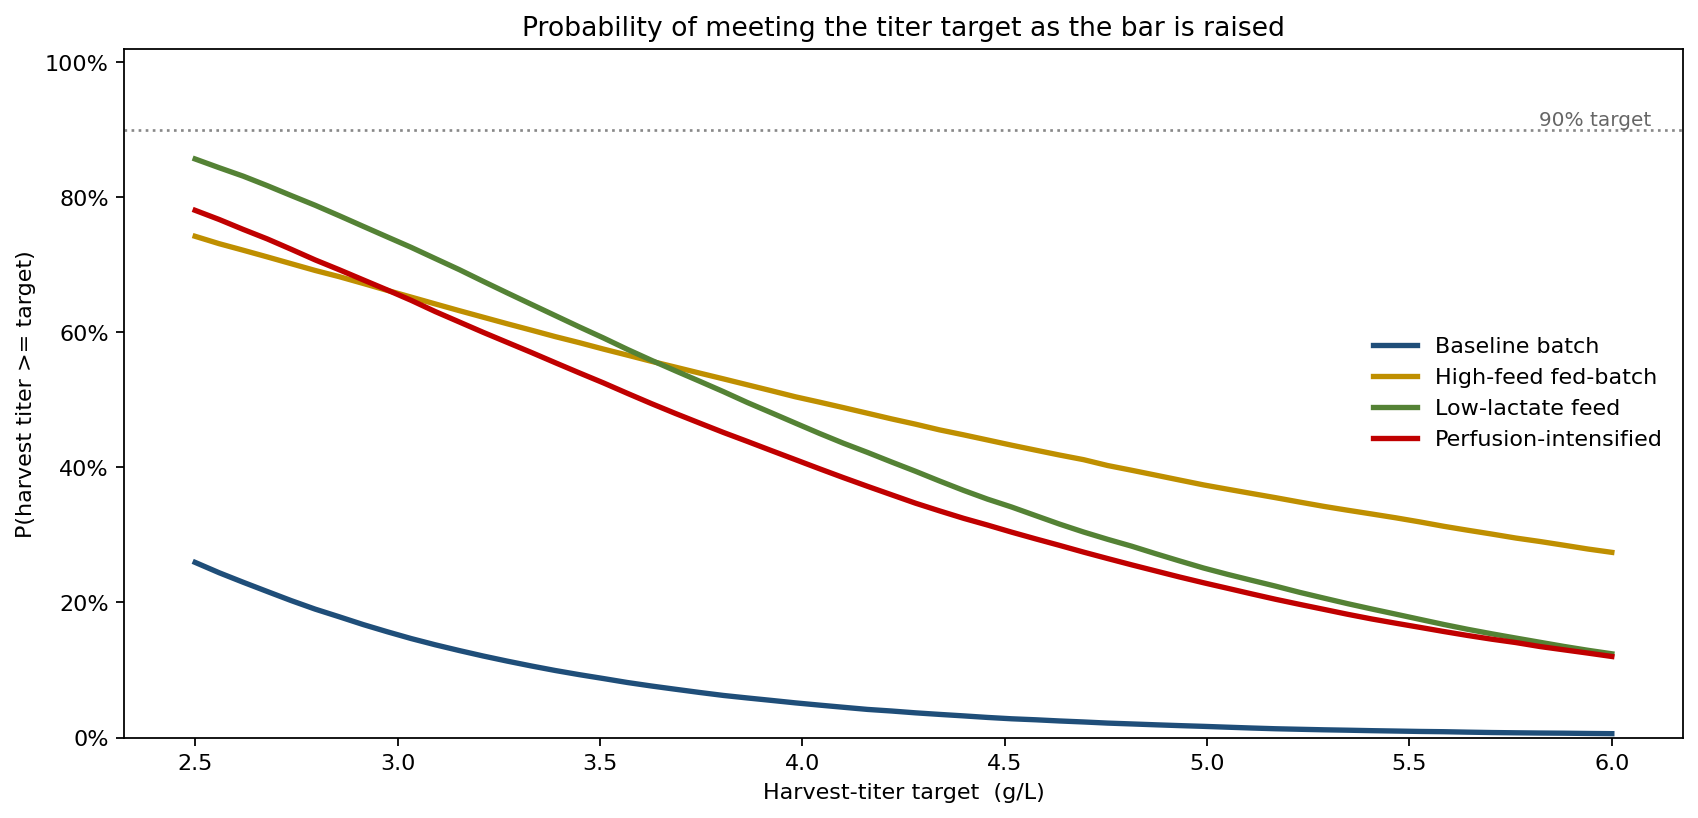
Sweeping the titer bar from 2.5 to 6.0 g/L shows how the four conditions trade off. At the 4.0 g/L target, the conditions clear it with probability 5% (baseline batch), 50% (high-feed), 46% (low-lactate) and 41% (perfusion-intensified) — high-feed looks marginally best here, on its inflated upside. But the picture flips as soon as you ask what each condition delivers reliably: the titer each clears with 90% probability (the P10) is 0.95 g/L (baseline), 1.58 g/L (high-feed), 2.28 g/L (low-lactate) and 1.94 g/L (perfusion). For a process that must hold a floor, low-lactate is the strongest guarantee — it carries the highest downside, by a wide margin over the high-mean condition.
Mean versus downside — the ranking that actually matters
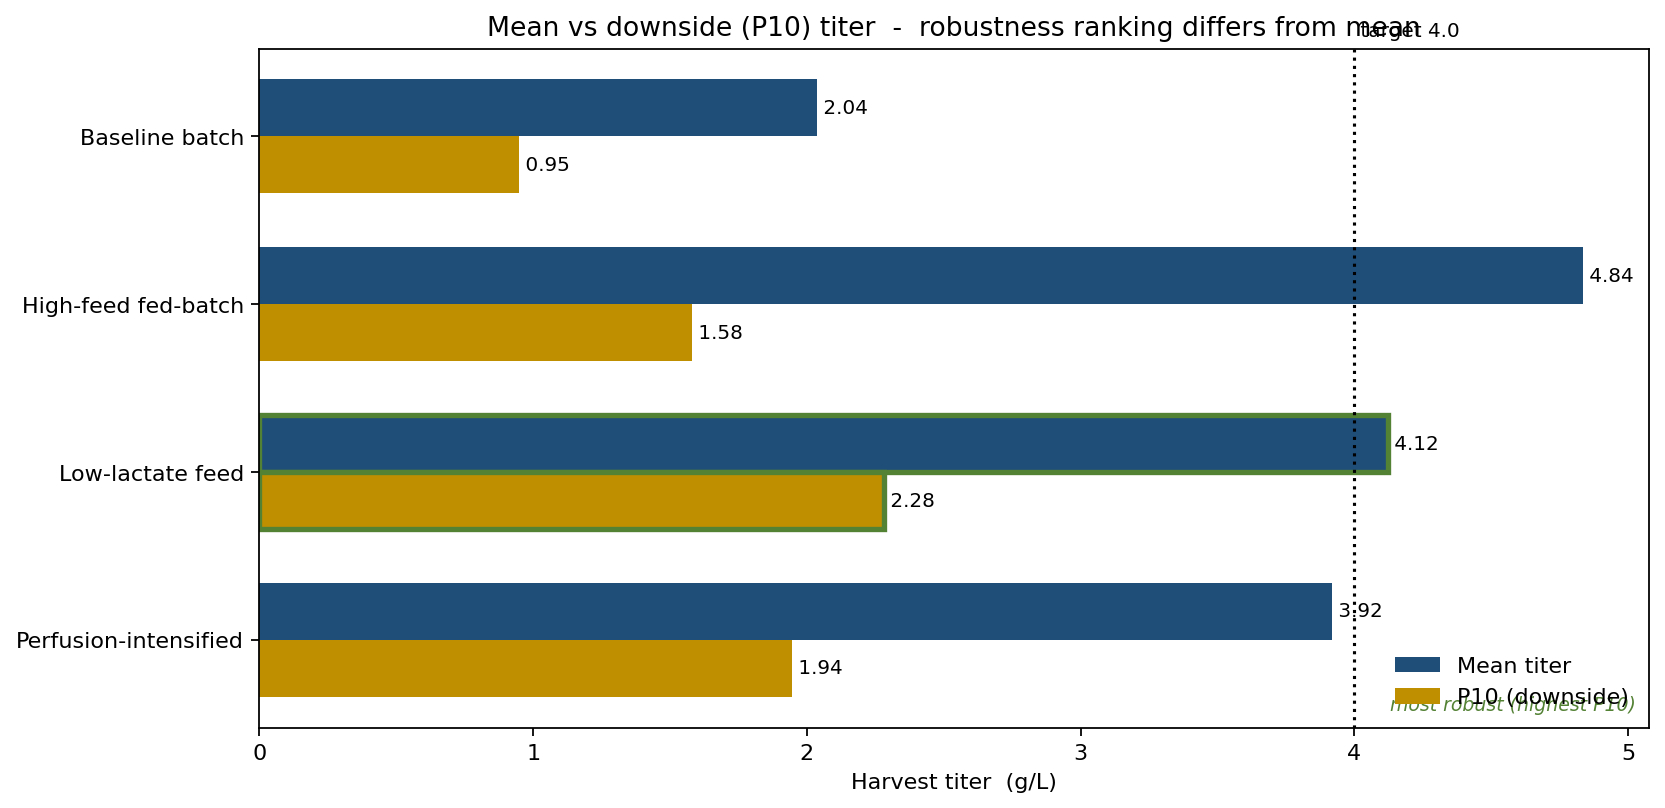
Side by side, the inversion is unambiguous. On mean titer the order is high-feed (4.84) > low-lactate (4.12) > perfusion (3.92) > baseline (2.04). On downside P10 the order is low-lactate (2.28) > perfusion (1.94) > high-feed (1.58) > baseline (0.95). The high-feed condition trades its top spot on the mean for the worst downside of the three viable conditions, because its 34% lactate-crash rate concentrates failure exactly where it hurts. The low-lactate feed — with a 5% crash rate and a tight distribution — is the most robust condition, the one a scale-up team should commit to when the run must clear a floor rather than win an average.
What drives titer in the robust condition
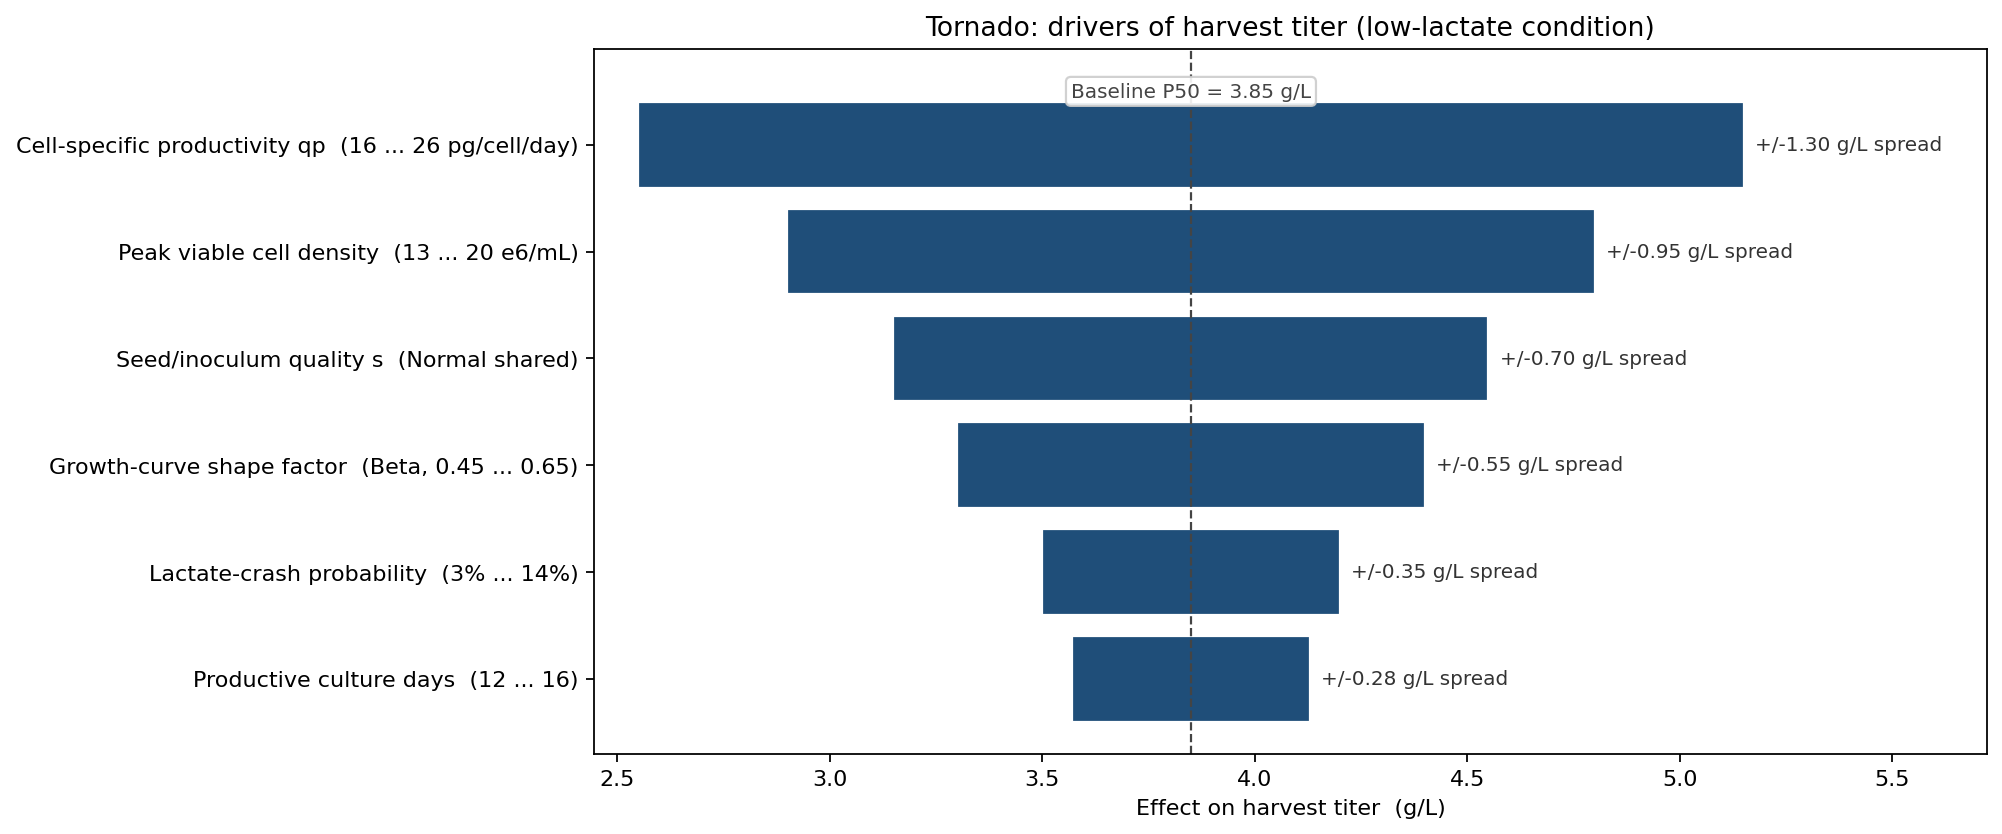
For the chosen low-lactate condition, ranked by their effect on harvest titer, cell-specific productivity (qp) dominates, followed by peak viable-cell density and the shared seed/inoculum-quality factor. The growth-curve shape factor and the lactate-crash probability rank lower — confirming that having suppressed the lactate crash, the remaining titer leverage sits in productivity and inoculum quality. That directed the next round of DOE: a productivity-focused clone screen and tighter seed-train release criteria, rather than further feed tinkering.
What the model changed
- The scale-up condition was reversed. The high-mean high-feed condition was rejected in favour of the low-lactate feed, on the basis that it clears the 4.0 g/L floor far more reliably (P10 = 2.28 g/L vs 1.58 g/L) despite a lower mean titer.
- Conditions are now ranked on downside (P10) and P(meet target), not mean titer, so a long upside tail can no longer disguise a fragile process.
- The lactate-crash risk became a first-class design parameter. Quantifying its 34% incidence in the high-feed condition — and its concentration in the left tail — is what disqualified the highest-mean option.
- The next DOE round was re-targeted at cell-specific productivity and seed-train quality, the two drivers the tornado put at the top, instead of further feed-strategy iteration.
ModelRisk Functionality Used
- LogNormal peak-VCD and productivity distributions, capturing the right skew in both factors that a Normal approximation would have missed.
- Beta growth-curve shape factor bounded on (0, 1) for the integral-viable-cell-time calculation, keeping the area-under-the-VCD-curve physically valid.
- Bernoulli lactate-crash event with a truncation multiplier, modelling the regime where a run's productive days are cut short — the mechanism that builds the high-feed condition's fat left tail.
- Shared seed/inoculum-quality factor correlating peak VCD and productivity within each run, so the titer components do not independently average away the spread.
- Probability-of-meeting-target sweep across the full 2.5–6.0 g/L range, converting four titer distributions into the decision-relevant question of reliable target attainment.
- Mean-versus-P10 robustness comparison, surfacing the ranking inversion that the mean-titer memo had inverted.
- Tornado sensitivity on the chosen condition, ranking productivity and inoculum quality ahead of feed parameters and re-targeting the next experimental round.
The bench data named the highest-titer condition; the highest-titer condition was the least reliable one to scale. Monte Carlo simulation in ModelRisk ranks media-and-feed conditions on the probability of clearing the titer floor — the property the process is actually scaled on — rather than on an average no single run delivers.