

Industry: Biotech
Product: ModelRisk
Application: Bioprocess Optimization
The DoE Optimum Yields 5.2 g/L on Paper and 4.5 g/L in the Plant
A design-of-experiments campaign finds the response-surface peak, the team locks the process to that setpoint, and the validation report quotes 5.2 g/L. Then routine manufacturing settles at a mean of 4.5 g/L, and nearly a third of batches miss the yield target. Nothing failed. The DoE found the right peak — but it found it on a sharp pH ridge, and a sharp peak is exactly where ordinary batch-to-batch drift does the most damage. The optimum that maximises deterministic yield is not the optimum that maximises delivered yield.
A biologics manufacturer rebuilt its upstream optimisation in ModelRisk to ask the question the DoE response surface cannot: not "where is the peak" but "what is the distribution of per-batch yield once pH, temperature and feed-rate drift around whatever setpoint we choose." The first result is the gap between the surface and the world.
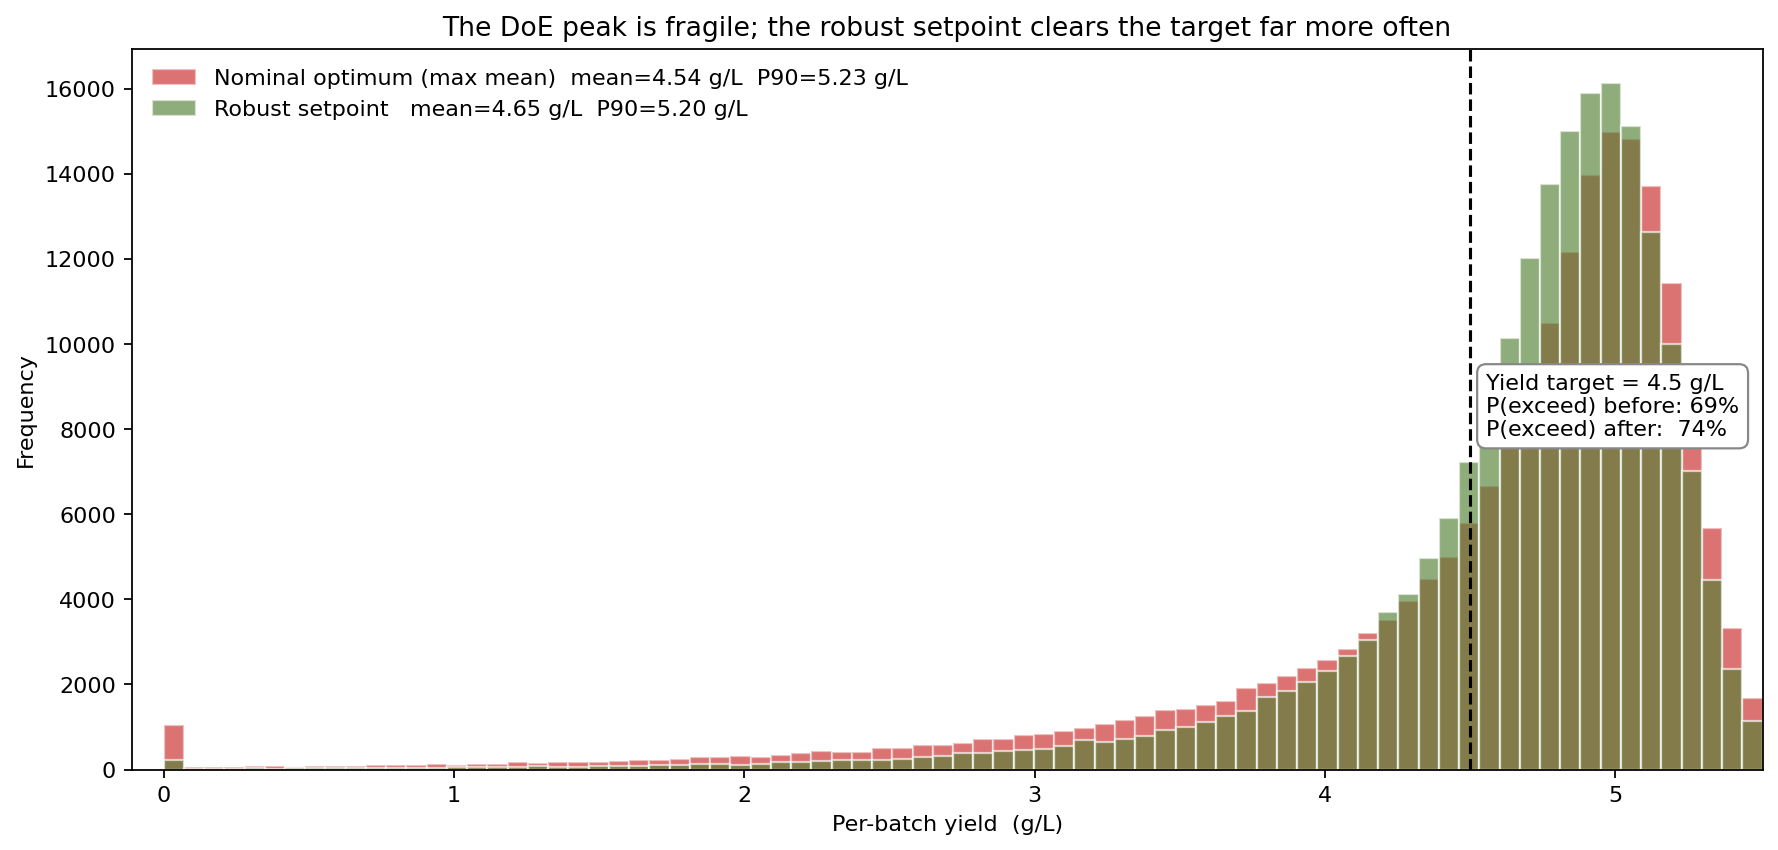
The DoE response surface peaks at 5.20 g/L. Run that exact setpoint through realistic batch-to-batch control drift and the mean yield is 4.54 g/L with a standard deviation of 0.87 — and only 69% of batches clear the 4.5 g/L target. Moving to a robust setpoint that trades a sliver of peak height for a flatter ridge lifts the mean to 4.65 g/L, cuts the spread to 0.64, and raises the meet-target rate to 74%.
Why a point estimate fails here
The response surface is a curve of mean yield against setpoint. But the process never sits exactly on its setpoint — pH, temperature and feed rate each drift batch-to-batch within the band the controllers can actually hold. Where the surface is sharply curved, that drift is pure loss: every excursion off the peak costs yield, and the costs do not cancel. The result is that the realised mean at a sharp peak sits well below the surface value, and the downside tail is fat.
The model captures four sources of variability:
- pH setpoint drift — Normal, 1-sigma of 0.08, the tightest control achievable at scale. pH sits on the sharpest direction of the surface, so this drift is the dominant loss.
- Temperature drift — Normal, ±0.45 °C, on a much gentler surface direction.
- Feed-rate drift — Normal, ±3% of nominal. Crucially, a richer feed flattens the pH ridge (it buffers the culture), so feed is both a yield input and a robustness lever.
- Run quality — a shared per-batch additive common factor (raw-material lot plus analyst) that shifts the whole surface up or down for that batch, so batches are not independent draws.
Each of 200,000 simulated batches draws one value of each input and evaluates the response surface plus the run-quality shift. The robust setpoint keeps the same pH and temperature but pushes feed up to +10%, flattening the pH ridge so the unavoidable pH drift costs far less.
The peak is fragile exactly where it is highest
Sweeping pH setpoint across the operating window shows why "sit on the peak" is the wrong instruction:
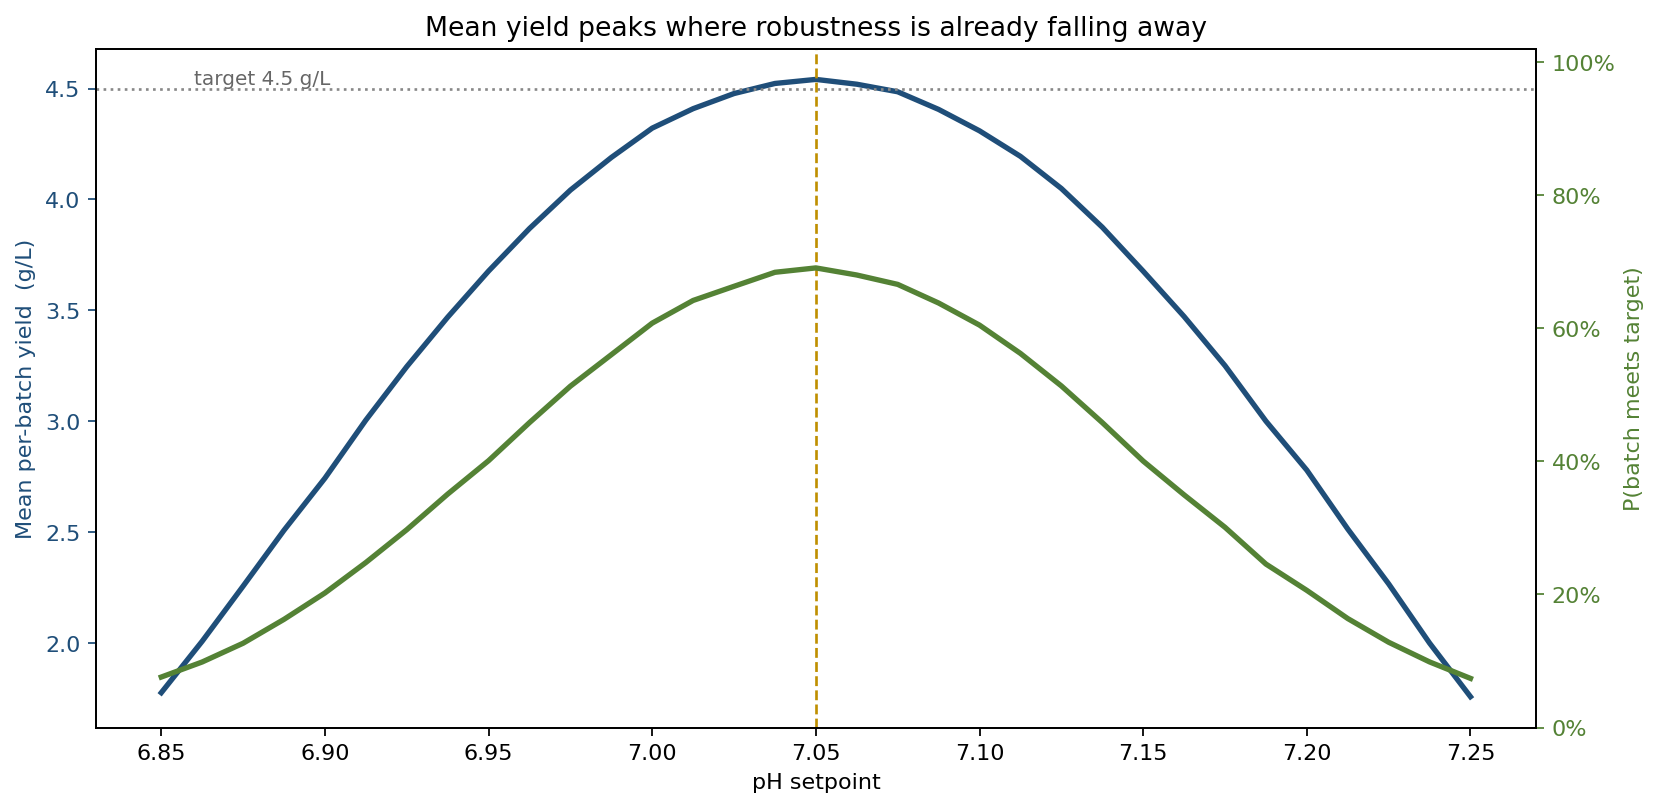
Mean yield and meet-target probability both peak at pH 7.05, where only 69% of batches clear the target. The window that keeps P(meet target) above 60% is just 0.10 pH units wide (7.00 to 7.10) — and at pH 7.15, a drift of one-tenth of a unit off the peak, the meet-target rate has already collapsed to 40%. The peak is not a plateau; it is a knife-edge, and a controller that holds ±0.08 will spend real time off it.
Where the yield spread comes from
Ranking each setpoint by the yield swing across its DoE-explored window confirms which knob to respect:
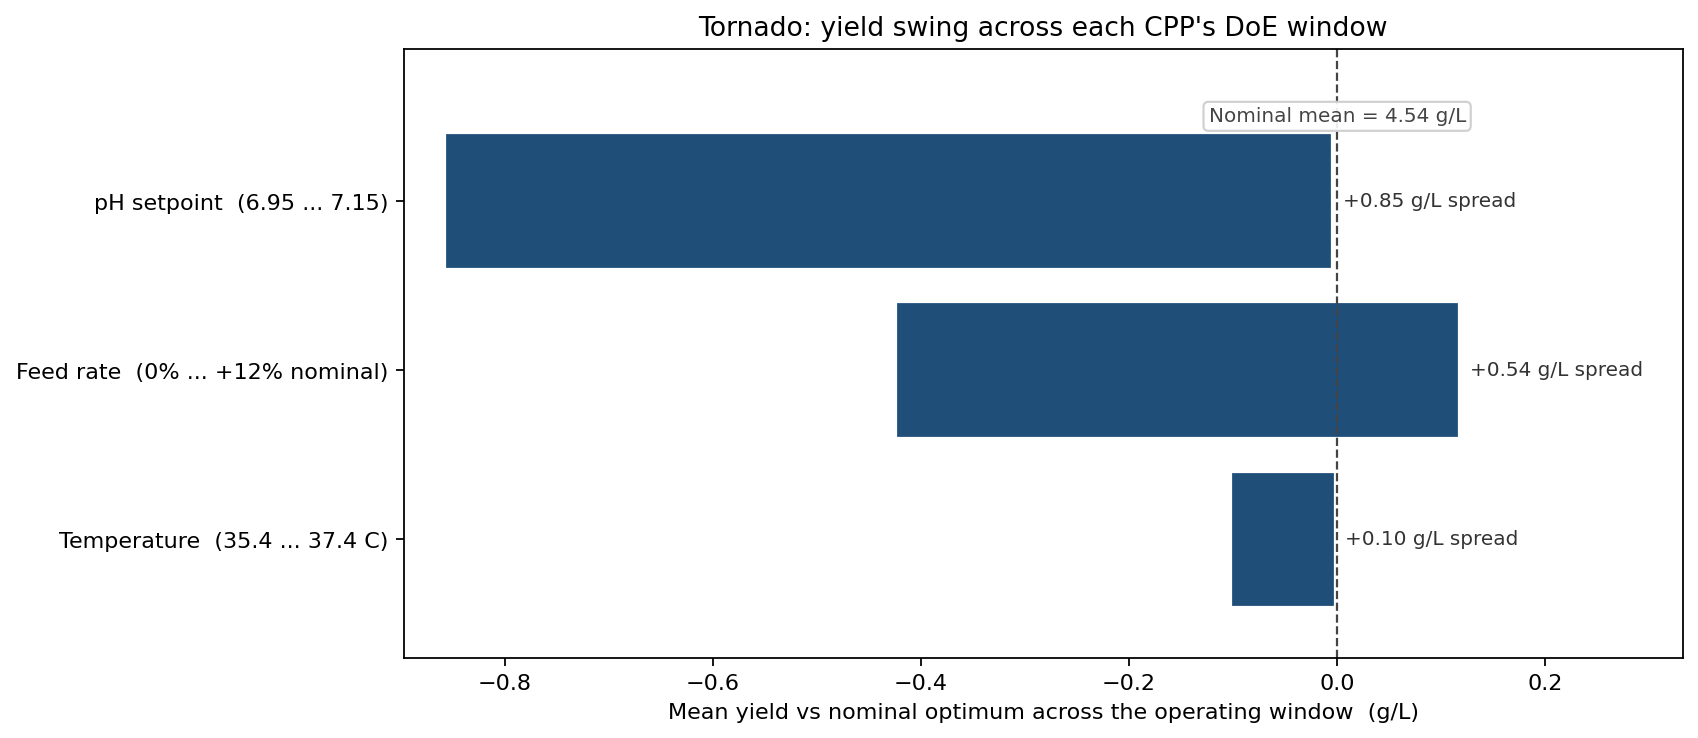
pH setpoint dominates: moving to either edge of its window (6.95 or 7.15) drops mean yield from 4.54 to 3.68 g/L — a symmetric collapse that reflects the sharp ridge. Temperature is mild (down to 4.44 at the window edges), and feed rate is asymmetric: cutting feed to nominal drops yield to 4.12, while raising it to +12% lifts yield to 4.66 by softening the pH ridge. The tornado is the argument for the robust setpoint in one picture — the biggest lever, pH, is the one the process cannot hold tightly, so the answer is to change feed and flatten the ridge.
The robust setpoint lifts the whole lower tail
Reading the two setpoints as cumulative distributions shows the robustness gain where it matters — the downside:
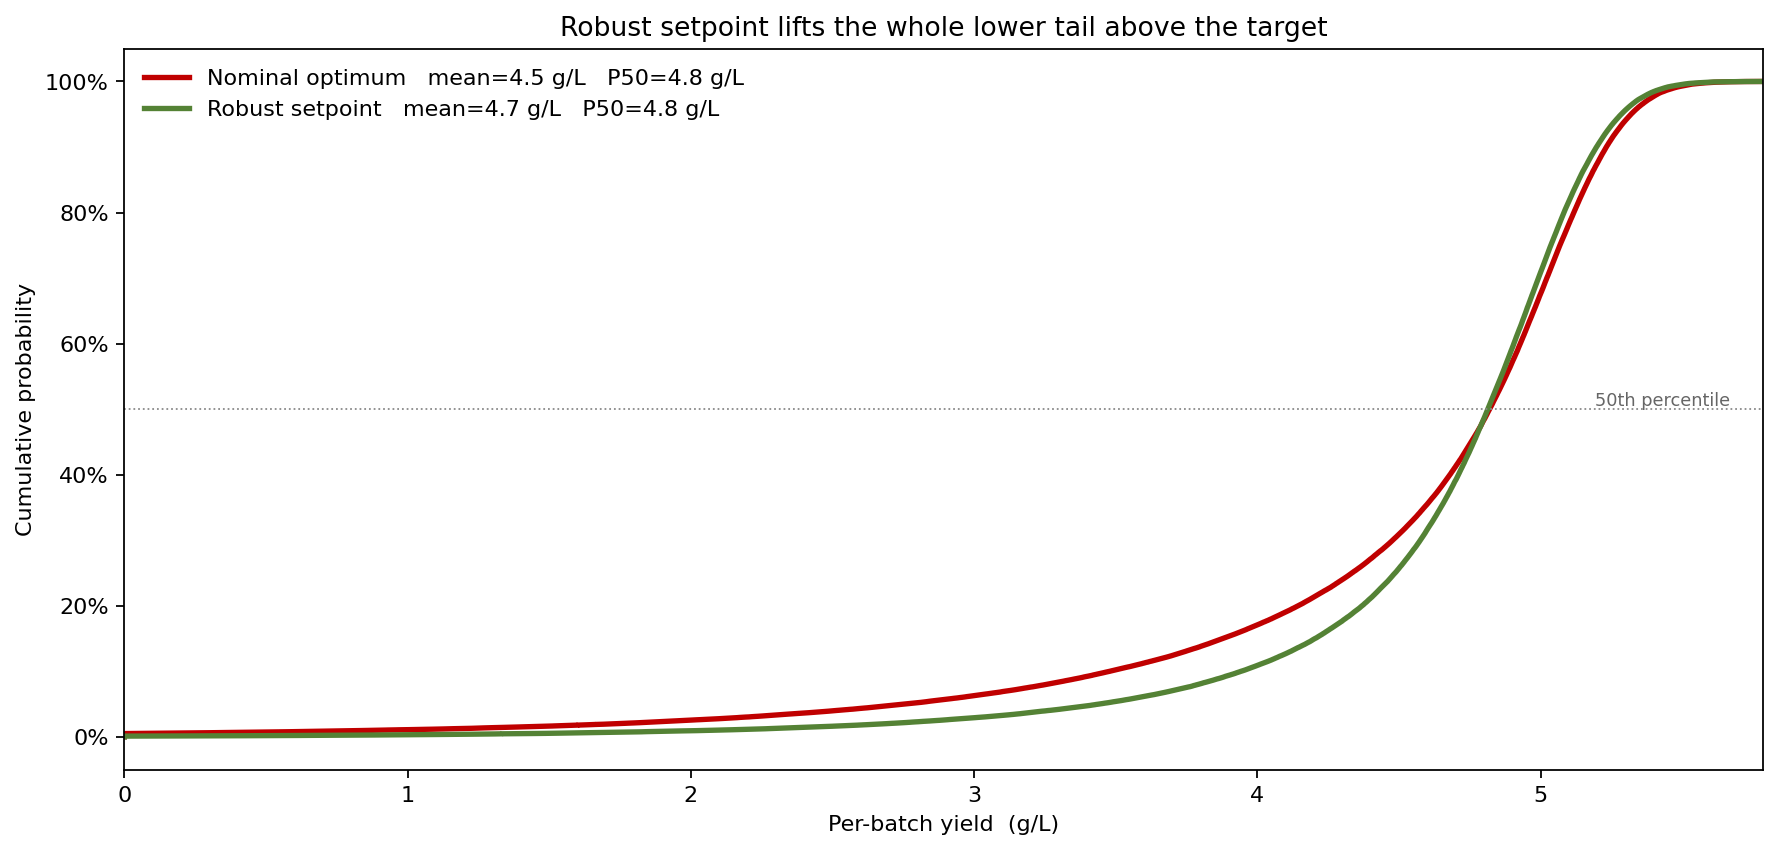
The nominal optimum's 5th-percentile batch is 2.76 g/L; the robust setpoint lifts that P5 to 3.44 g/L. Across 100 batches the robust setpoint produces 26 below-target batches versus 31 at the nominal optimum — 5 fewer failed batches per 100, achieved while raising the mean. The robust setpoint is not a compromise that trades mean for safety; it wins on both because it removes the convexity penalty the sharp peak was paying.
What the model changed
- The process setpoint was moved off the DoE peak: same pH and temperature, feed raised to +10%, lifting both mean yield (4.54 → 4.65 g/L) and meet-target rate (69% → 74%).
- The validation yield claim was restated from the deterministic 5.20 g/L peak to a realised mean of 4.65 g/L with a quantified meet-target probability — closing a chronic gap between filing and floor.
- Control-system investment was re-aimed: because pH drift is the dominant loss and pH cannot be held tighter cheaply, the team funded the feed-strategy change (which flattens the ridge) rather than a costly pH-control upgrade.
- Batch-failure budgeting moved to a per-100-batch expected count, giving QA a defensible out-of-spec rate instead of an implicit zero.
ModelRisk Functionality Used
- Normal drift inputs on pH, temperature and feed rate around a chosen setpoint, feeding a DoE-fitted quadratic response surface with a feed-by-pH robustness interaction.
- Shared per-batch run-quality common factor so correlated batch outcomes are simulated rather than averaged away into a deterministic mean.
- Setpoint sweep across the operating window to expose the sharp-ridge fragility and the narrow high-probability pH band.
- Tornado sensitivity across the DoE window to rank setpoints by realised-yield impact and justify the feed-led robustness fix.
- Cumulative-distribution comparison of nominal versus robust setpoints to quantify the lower-tail and below-target-batch gains.
A response surface tells you where the mean is highest; it does not tell you where the delivered yield is highest once the process drifts. The ModelRisk model replaces "the optimum is 5.2 g/L" with "the optimum delivers 4.54 g/L and misses target 31% of the time, but a richer feed delivers 4.65 g/L and misses only 26%" — the setpoint the plant should actually run.