

Industry: Biotech
Product: ModelRisk
Application: Modeling Biochemical Pathways Under Uncertainty
A Pathway That "Makes 3.2 mmol/gDW/h" Actually Hits Target in 1 Run of 5
An engineered production strain carries a four-enzyme pathway from substrate to product. Plug the median kinetic constants into the steady-state flux equation and the answer is a clean 3.2 mmol/gDW/h. The strain-engineering team reports that number, the campaign is planned around it, and then the runs come in scattered between 2 and 5 — with only one in five clearing the 4.0 mmol/gDW/h target the process was sized for. The median kinetics were right. The single flux value they produced was a fiction, because enzyme expression and turnover are not constants, and a linear pathway's flux is governed by whichever enzyme happens to be slowest that run.
A biotech rebuilt the pathway in ModelRisk to replace the plug-in with the thing that actually matters: the distribution of product flux once every enzyme's capacity is uncertain, and the identity of the rate-limiting step is itself a random variable. The headline is the distribution the deterministic answer collapses.
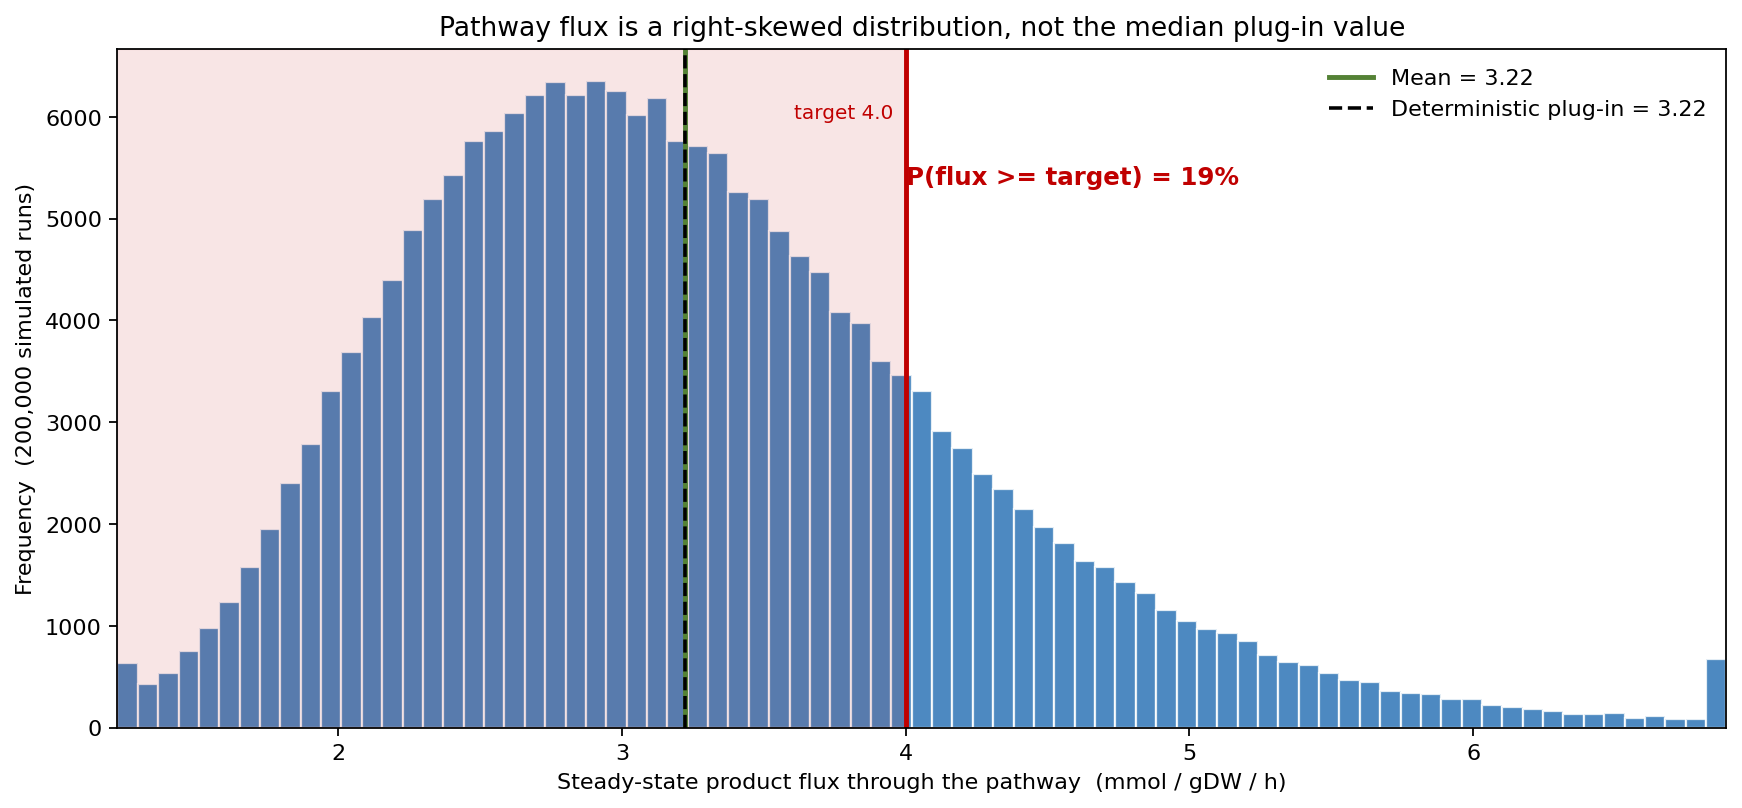
The deterministic plug-in lands at 3.22 mmol/gDW/h — and so does the simulated mean (3.22) — but that single number hides a right-skewed spread from a P10 of 2.08 to a P90 of 4.52, and the consequence is stark: only 19.4% of runs clear the 4.0 mmol/gDW/h target. The point estimate sits comfortably below target and tells you nothing about how often you will reach it.
Why a point estimate fails here
Flux through a near-linear pathway is set by the slowest step — the bottleneck. At steady state the enzyme resistances (the reciprocals of their capacities) add along the chain, so the flux is a soft minimum dominated by whichever enzyme has the least capacity. Each enzyme's capacity is the product of two uncertain things, turnover number (kcat) and expression level, plus a fractional saturation set by an uncertain Michaelis constant. The model treats all three as LogNormal:
- kcat — LogNormal, assay-to-assay turnover variability.
- Expression level [E] — LogNormal, the largest source of capacity spread.
- Km — LogNormal, setting each step's fractional saturation at the working substrate concentration.
- Run quality — a shared per-run common factor (induction strength plus carbon-source lot) that scales every enzyme's capacity together, so runs are correlated rather than independent draws and the distribution does not collapse to its average.
Each of 200,000 simulated runs draws a full set of kinetics, computes every enzyme's capacity, and takes the resistance-sum flux. The plug-in uses median kinetics and so reports a single point on that distribution — it cannot tell you that four runs in five fall short of target.
The bottleneck is a probability, not a label
Which enzyme limits the flux is not fixed — it shifts run to run as the kinetics vary. The model quantifies both each enzyme's flux-control coefficient and how often it is the binding constraint:
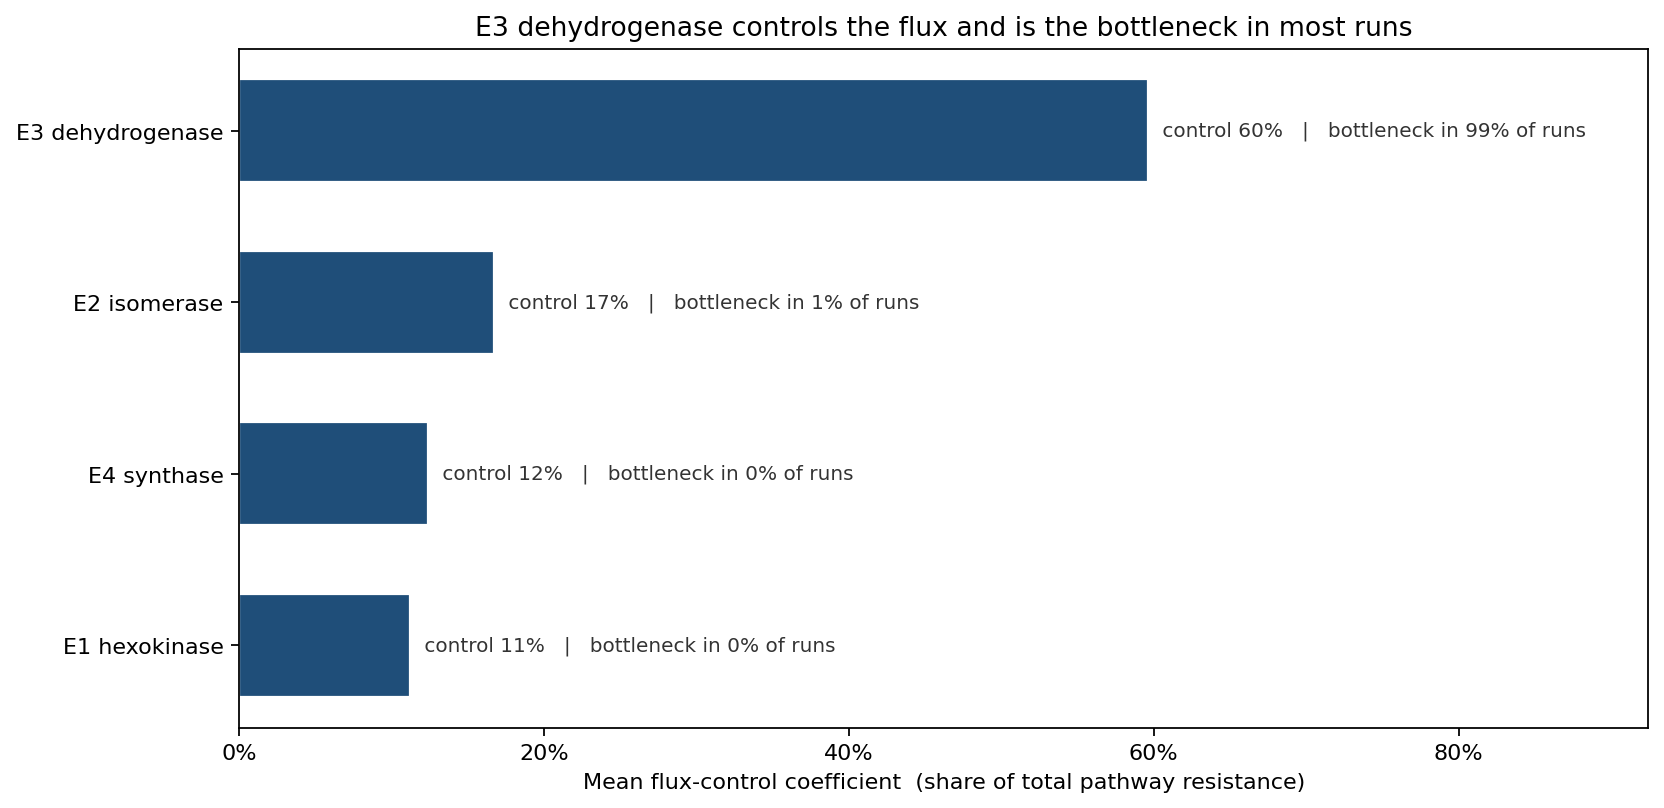
E3 dehydrogenase carries a 60% flux-control coefficient and is the single rate-limiting enzyme in 99% of runs. The other three enzymes split the remaining control — E2 isomerase at 17%, E4 synthase at 12%, E1 hexokinase at 11% — and are essentially never the bottleneck. This is the result a deterministic model can only assert; the simulation demonstrates it across the full kinetic uncertainty, so the engineering target is unambiguous.
Where flux sensitivity concentrates
Ranking each enzyme by the flux swing when its capacity moves from P10 to P90 confirms where engineering effort pays:
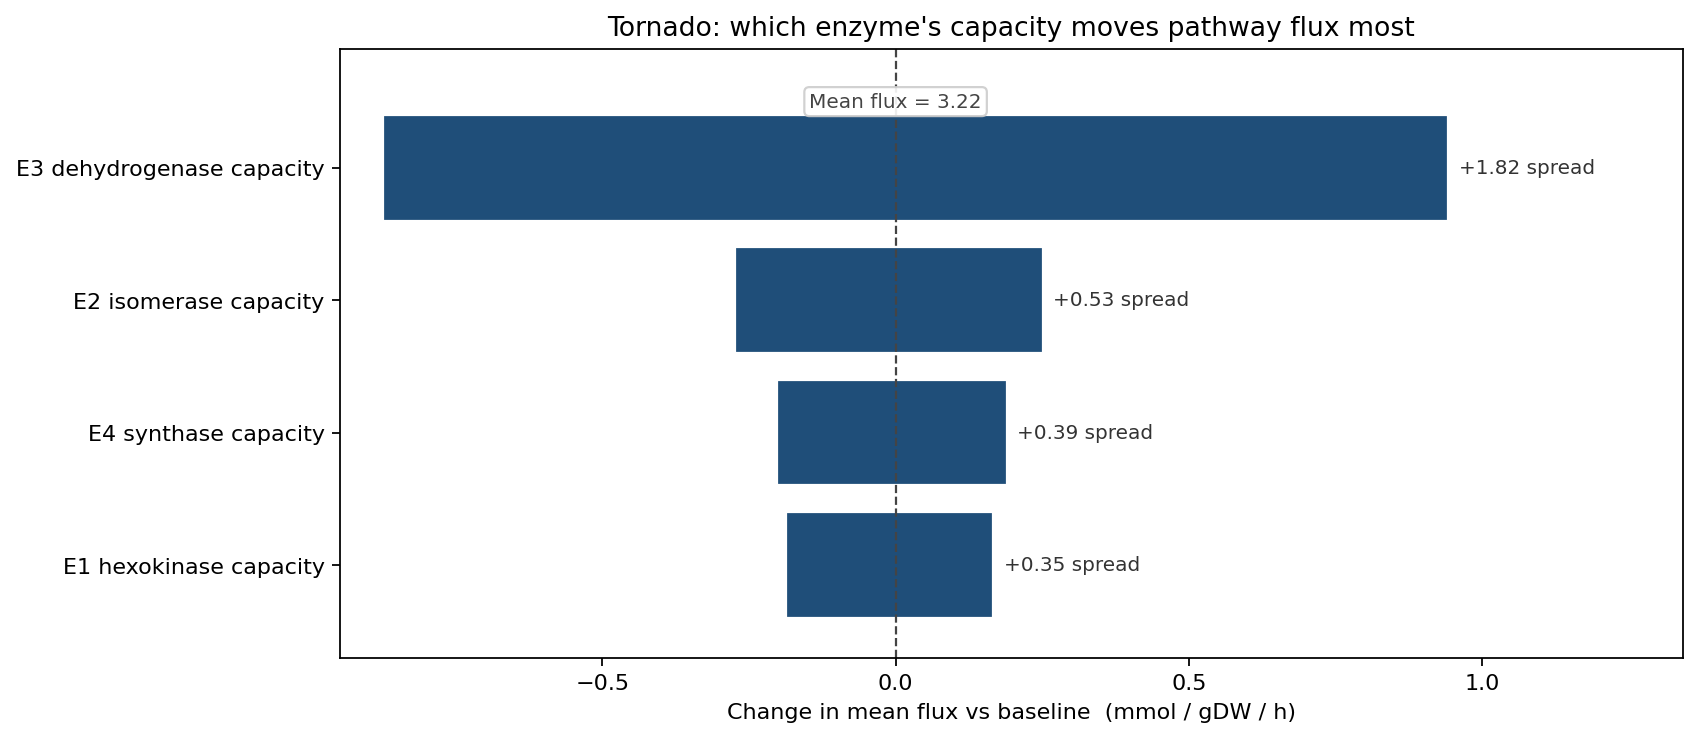
E3 dehydrogenase dominates, swinging mean flux by roughly ±0.9 mmol/gDW/h across its capacity range, while E1, E2 and E4 each move it by only ±0.2. The asymmetry is the whole point: improving a non-bottleneck enzyme does almost nothing to flux, because it was never the constraint. Effort spent over-expressing E1 or E4 is effort wasted; the entire flux-control budget lives in E3.
Relieving the bottleneck moves the whole distribution
The model tests the obvious intervention — doubling E3 expression — and reads the result against target:
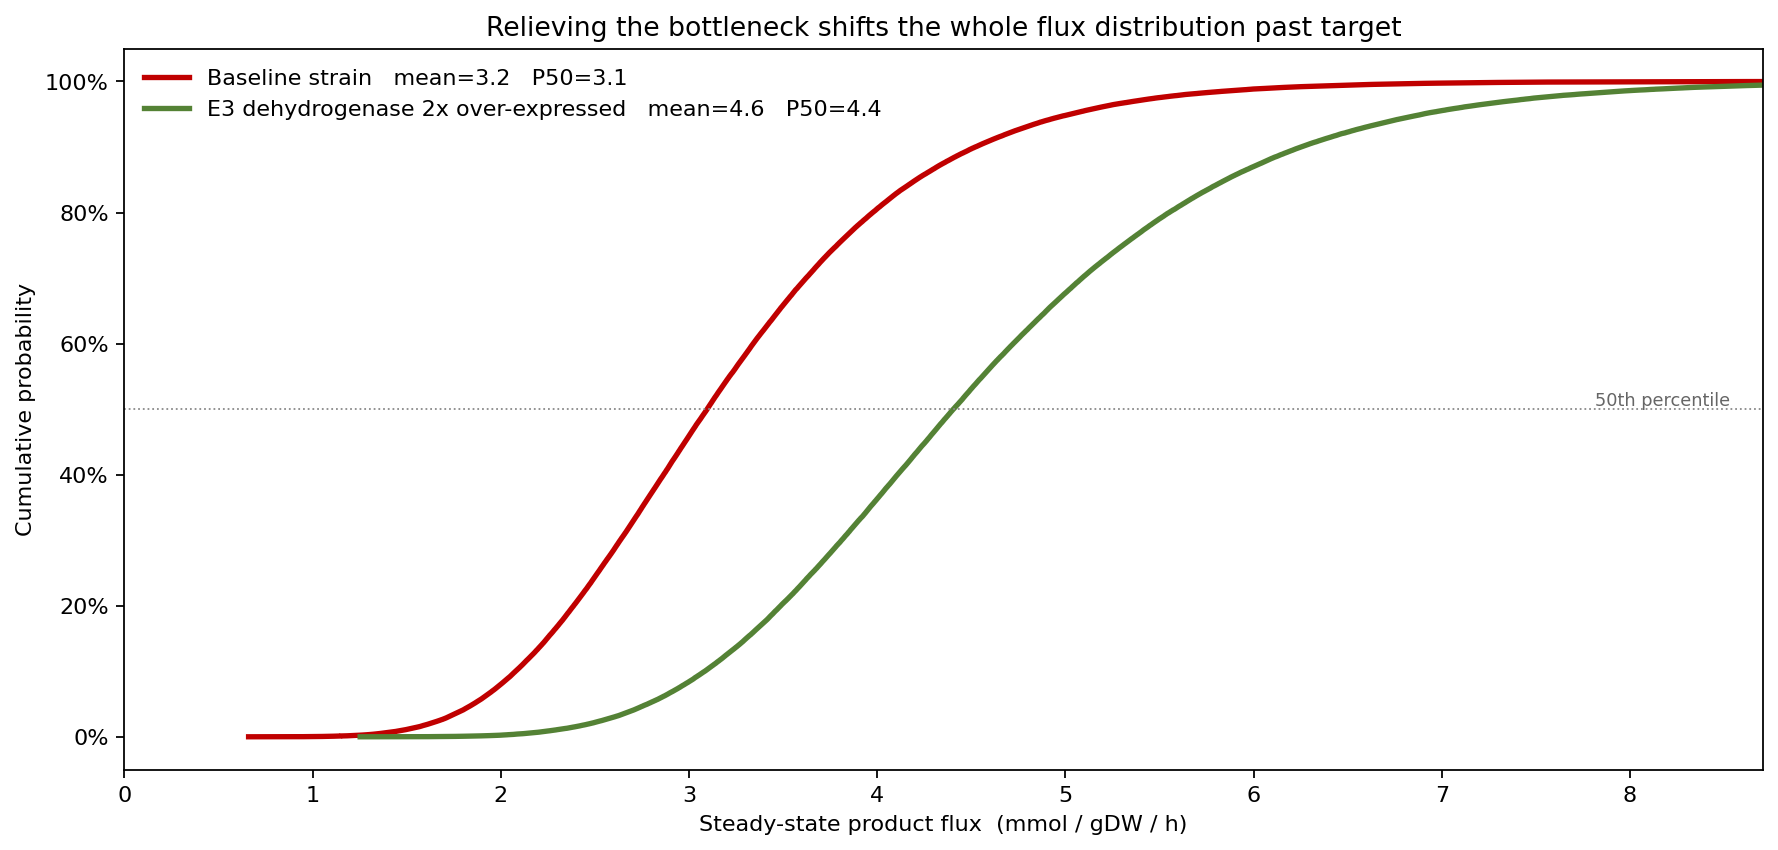
Two-fold over-expression of E3 lifts mean flux from 3.22 to 4.57 mmol/gDW/h and raises the share of runs meeting the 4.0 target from 19.4% to 63.7% — a 44-percentage-point uplift. The deterministic boosted flux (4.64) again sits near the new mean, but only the distribution shows that the intervention turns a one-in-five hit rate into a near-two-in-three one. Once E3 is relieved, control begins to pass to the next-slowest enzyme — the simulation says where the second round of engineering should look before the first round is even run.
What the model changed
- The engineering target was pinned to E3 dehydrogenase, justified by a 60% flux-control coefficient and bottleneck status in 99% of runs rather than by a single-point sensitivity.
- Effort on non-limiting enzymes was stopped: the tornado showed E1/E2/E4 capacity changes move flux by ±0.2 at most, so cloning effort there was reallocated.
- The campaign hit-rate expectation was corrected from an implicit "we make 3.2, target is 4.0, we are short" to a quantified 19.4% meet-target probability, and the E3 intervention was funded on a projected jump to 63.7%.
- The next bottleneck was identified in advance, so the second engineering cycle was scoped before the first strain was built.
ModelRisk Functionality Used
- LogNormal inputs on kcat, expression level and Km for all four enzymes, with a shared per-run common factor (induction plus carbon-source lot) so correlated runs are simulated rather than averaged.
- Resistance-sum steady-state flux computed inside the model, so the rate-limiting step emerges from the kinetics rather than being assumed.
- Flux-control coefficients and bottleneck frequencies derived per enzyme to turn "which step limits flux" into a probability.
- Tornado sensitivity ranking to separate the one enzyme worth engineering from the three that are not.
- Cumulative-distribution comparison of baseline versus E3 over-expression to quantify the meet-target uplift before any strain was constructed.
A pathway does not have a flux; it has a flux distribution, and a bottleneck that moves. The ModelRisk model replaces "the pathway makes 3.2 mmol/gDW/h" with "3.2 on average, target met in only 19% of runs, and the entire fix is E3" — the difference between a number and a decision.